
|
|||||
|
 | |
| |
| |
| |
| |
| |
|
Gene: SMIM14 |
Gene summary for SMIM14 |
| Gene information | Species | Human | Gene symbol | SMIM14 | Gene ID | 201895 |
| Gene name | small integral membrane protein 14 | |
| Gene Alias | C4orf34 | |
| Cytomap | 4p14 | |
| Gene Type | protein-coding | GO ID | GO:0001701 | UniProtAcc | A0A024R9S4 |
Top |
Malignant transformation analysis |
| Identification of the aberrant gene expression in precancerous and cancerous lesions by comparing the gene expression of stem-like cells in diseased tissues with normal stem cells |
| Entrez ID | Symbol | Replicates | Species | Organ | Tissue | Adj P-value | Log2FC | Malignancy |
| 201895 | SMIM14 | GSM4909280 | Human | Breast | Precancer | 9.40e-05 | -5.84e-01 | 0.0305 |
| 201895 | SMIM14 | GSM4909281 | Human | Breast | IDC | 3.44e-04 | -2.84e-01 | 0.21 |
| 201895 | SMIM14 | GSM4909282 | Human | Breast | IDC | 6.01e-05 | -3.20e-01 | -0.0288 |
| 201895 | SMIM14 | GSM4909285 | Human | Breast | IDC | 1.11e-04 | -2.96e-01 | 0.21 |
| 201895 | SMIM14 | GSM4909286 | Human | Breast | IDC | 9.34e-08 | -3.52e-01 | 0.1081 |
| 201895 | SMIM14 | GSM4909287 | Human | Breast | IDC | 1.47e-04 | -3.38e-01 | 0.2057 |
| 201895 | SMIM14 | GSM4909288 | Human | Breast | IDC | 1.52e-03 | -4.54e-01 | 0.0988 |
| 201895 | SMIM14 | GSM4909293 | Human | Breast | IDC | 1.45e-29 | 6.24e-01 | 0.1581 |
| 201895 | SMIM14 | GSM4909294 | Human | Breast | IDC | 1.14e-07 | 2.66e-01 | 0.2022 |
| 201895 | SMIM14 | GSM4909296 | Human | Breast | IDC | 4.19e-11 | -3.22e-01 | 0.1524 |
| 201895 | SMIM14 | GSM4909297 | Human | Breast | IDC | 1.97e-12 | -4.46e-02 | 0.1517 |
| 201895 | SMIM14 | GSM4909298 | Human | Breast | IDC | 1.26e-04 | 2.95e-01 | 0.1551 |
| 201895 | SMIM14 | GSM4909302 | Human | Breast | IDC | 9.06e-07 | 3.86e-01 | 0.1545 |
| 201895 | SMIM14 | GSM4909304 | Human | Breast | IDC | 3.76e-23 | 5.94e-01 | 0.1636 |
| 201895 | SMIM14 | GSM4909306 | Human | Breast | IDC | 1.22e-14 | 4.81e-01 | 0.1564 |
| 201895 | SMIM14 | GSM4909308 | Human | Breast | IDC | 1.80e-07 | 3.67e-01 | 0.158 |
| 201895 | SMIM14 | GSM4909311 | Human | Breast | IDC | 3.49e-28 | -3.24e-01 | 0.1534 |
| 201895 | SMIM14 | GSM4909312 | Human | Breast | IDC | 1.57e-10 | 1.19e-01 | 0.1552 |
| 201895 | SMIM14 | GSM4909319 | Human | Breast | IDC | 1.62e-36 | -2.66e-01 | 0.1563 |
| 201895 | SMIM14 | GSM4909320 | Human | Breast | IDC | 1.20e-04 | -3.55e-01 | 0.1575 |
| Page: 1 2 3 4 5 6 7 8 9 10 11 |
| Tissue | Expression Dynamics | Abbreviation |
| Breast | 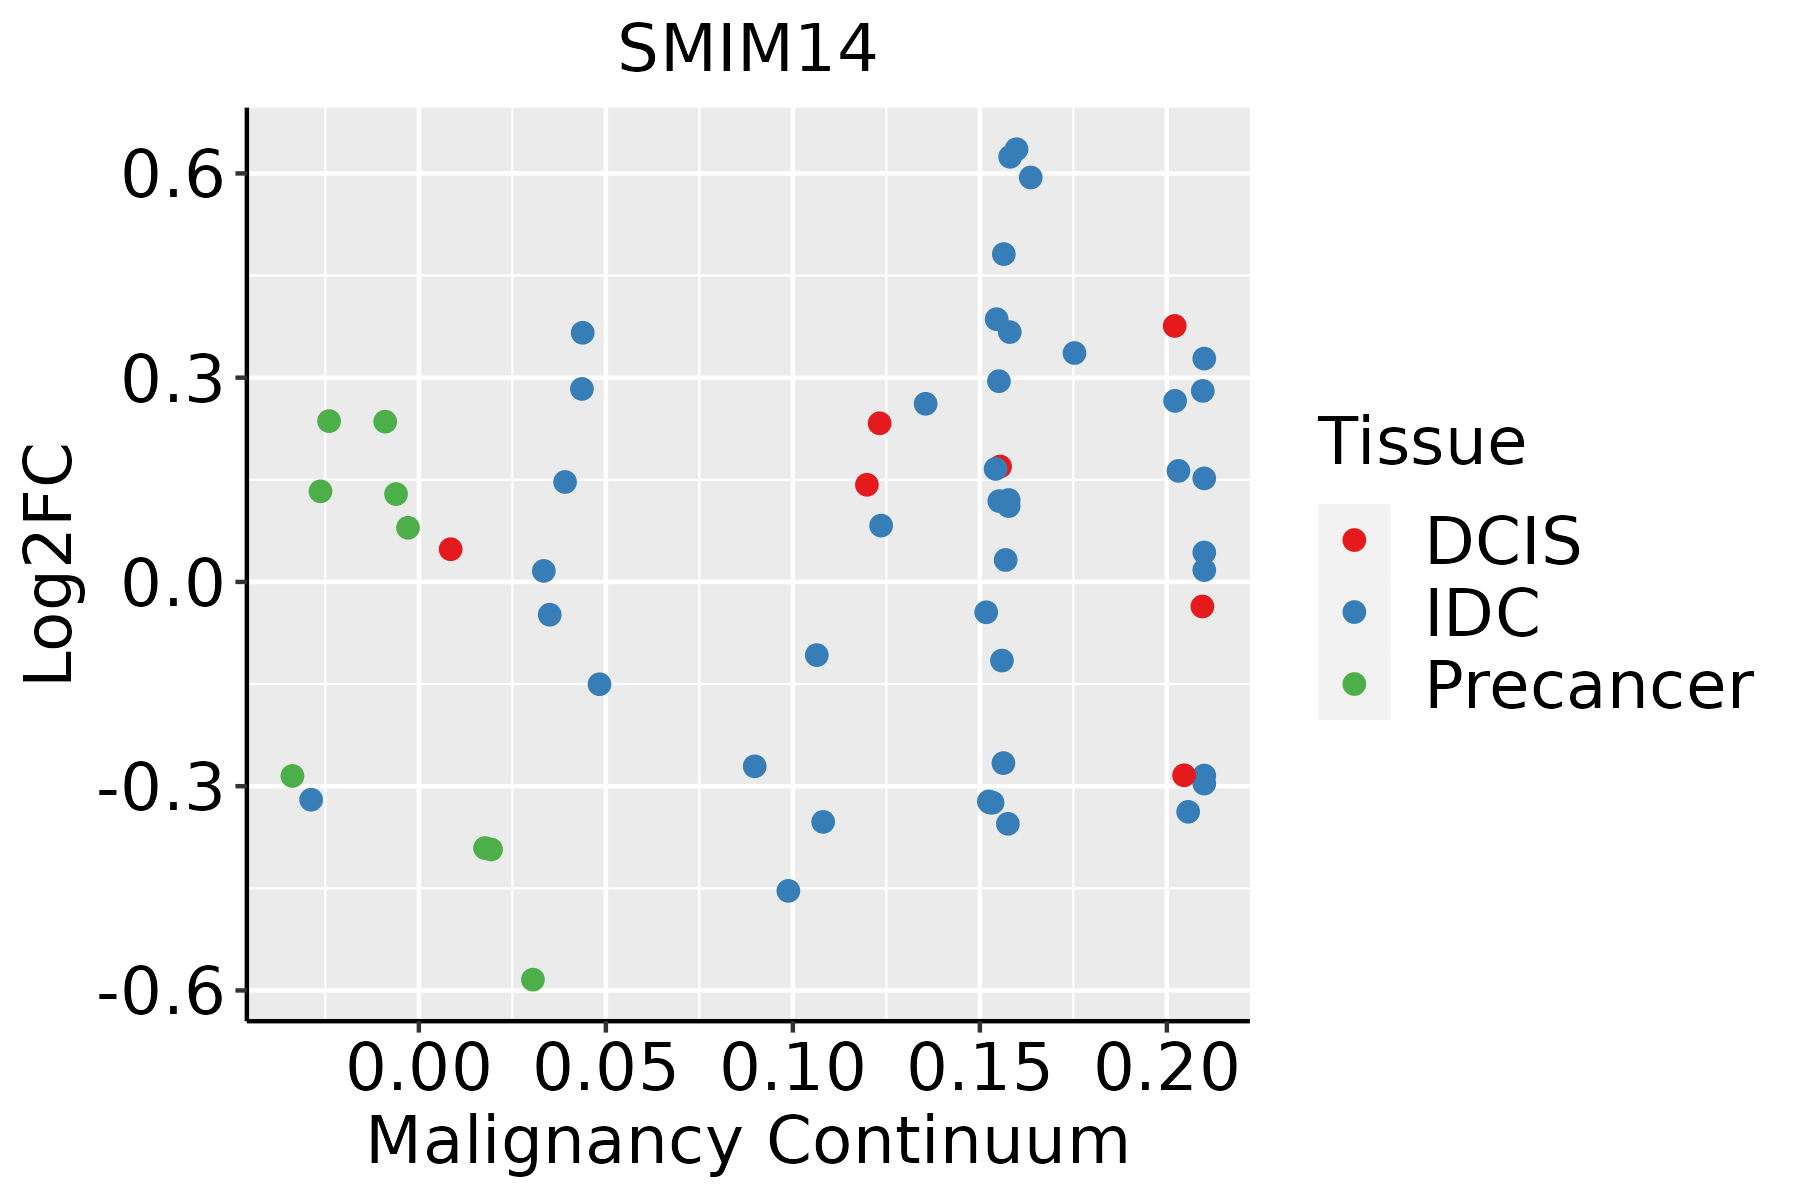 | IDC: Invasive ductal carcinoma |
| DCIS: Ductal carcinoma in situ | ||
| Precancer(BRCA1-mut): Precancerous lesion from BRCA1 mutation carriers | ||
| Colorectum (GSE201348) |  | FAP: Familial adenomatous polyposis |
| CRC: Colorectal cancer | ||
| Colorectum (HTA11) |  | AD: Adenomas |
| SER: Sessile serrated lesions | ||
| MSI-H: Microsatellite-high colorectal cancer | ||
| MSS: Microsatellite stable colorectal cancer | ||
| Esophagus |  | ESCC: Esophageal squamous cell carcinoma |
| HGIN: High-grade intraepithelial neoplasias | ||
| LGIN: Low-grade intraepithelial neoplasias | ||
| GC |  | CAG: Chronic atrophic gastritis |
| CAG with IM: Chronic atrophic gastritis with intestinal metaplasia | ||
| CSG: Chronic superficial gastritis | ||
| GC: Gastric cancer | ||
| SIM: Severe intestinal metaplasia | ||
| WIM: Wild intestinal metaplasia | ||
| Liver | 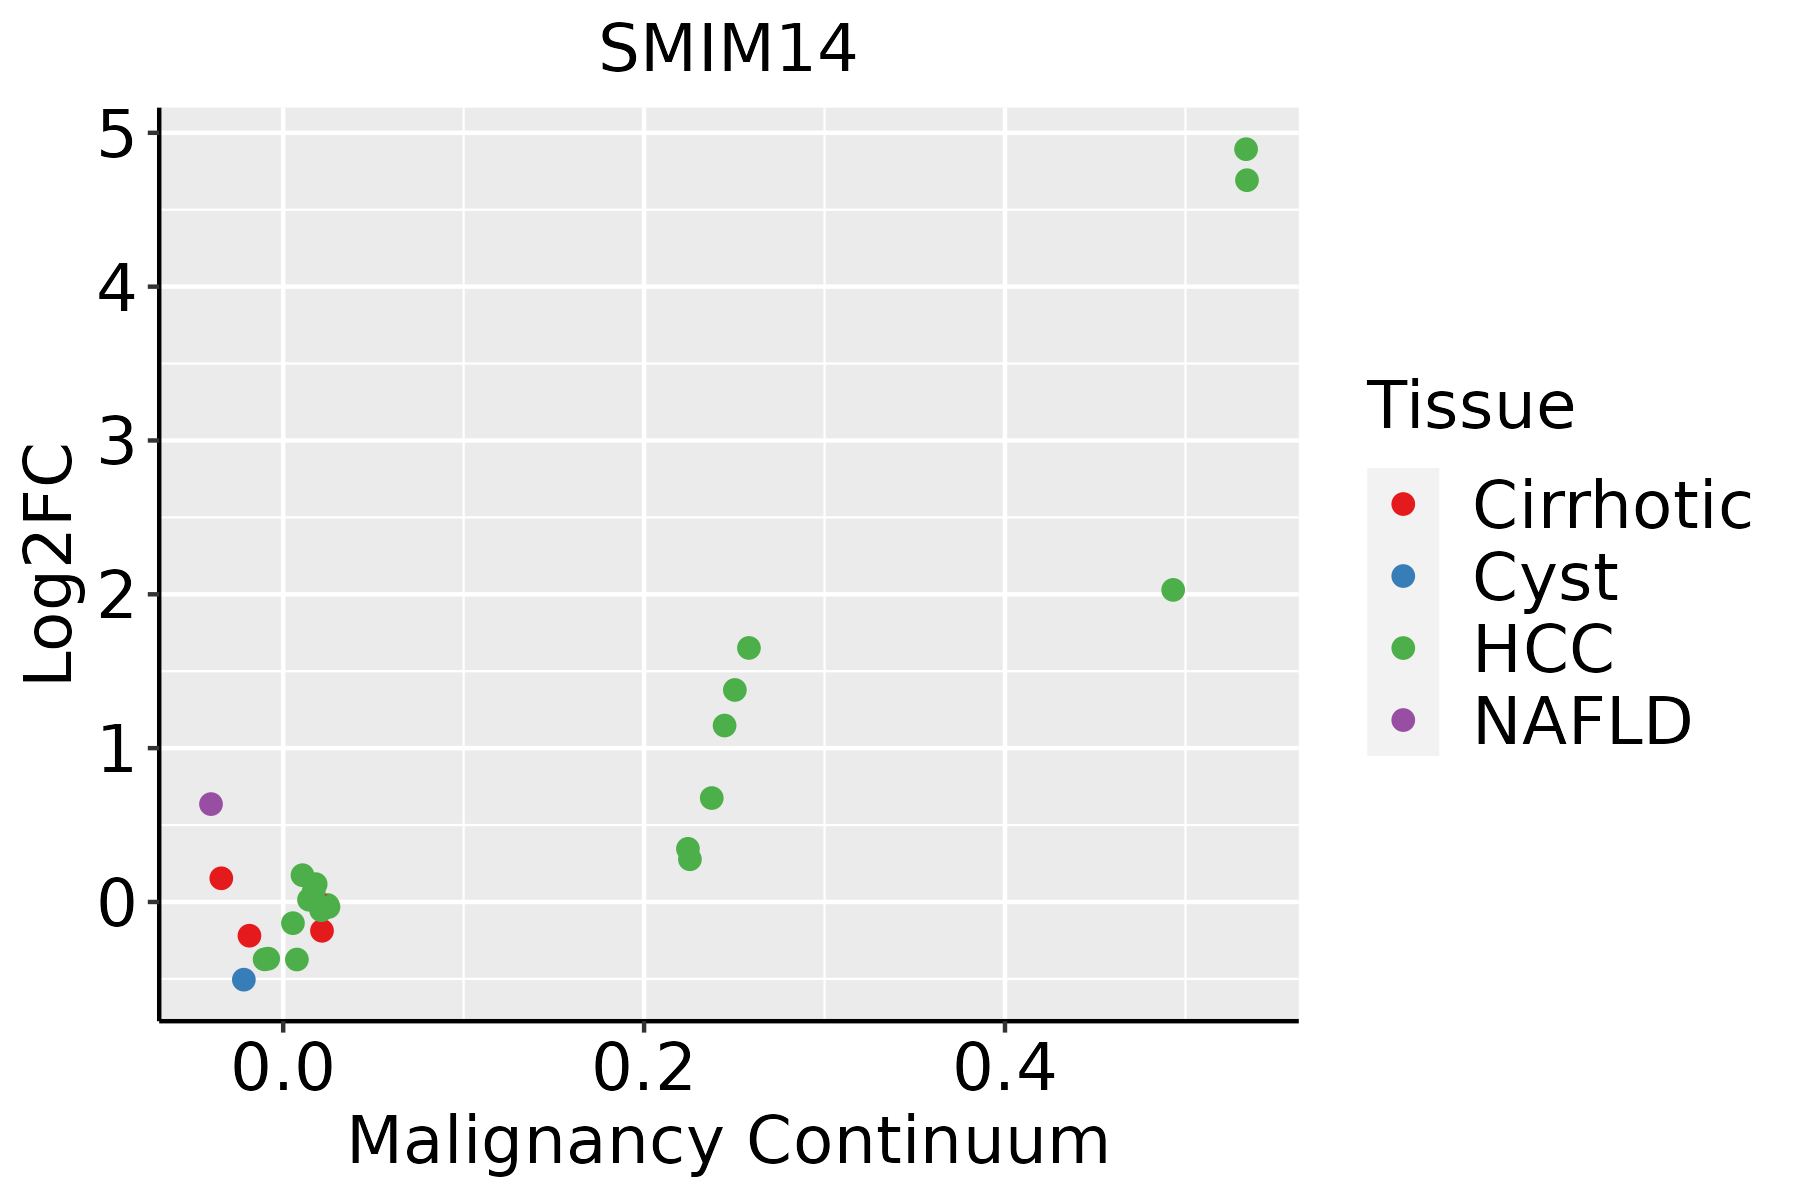 | HCC: Hepatocellular carcinoma |
| NAFLD: Non-alcoholic fatty liver disease | ||
| Lung | 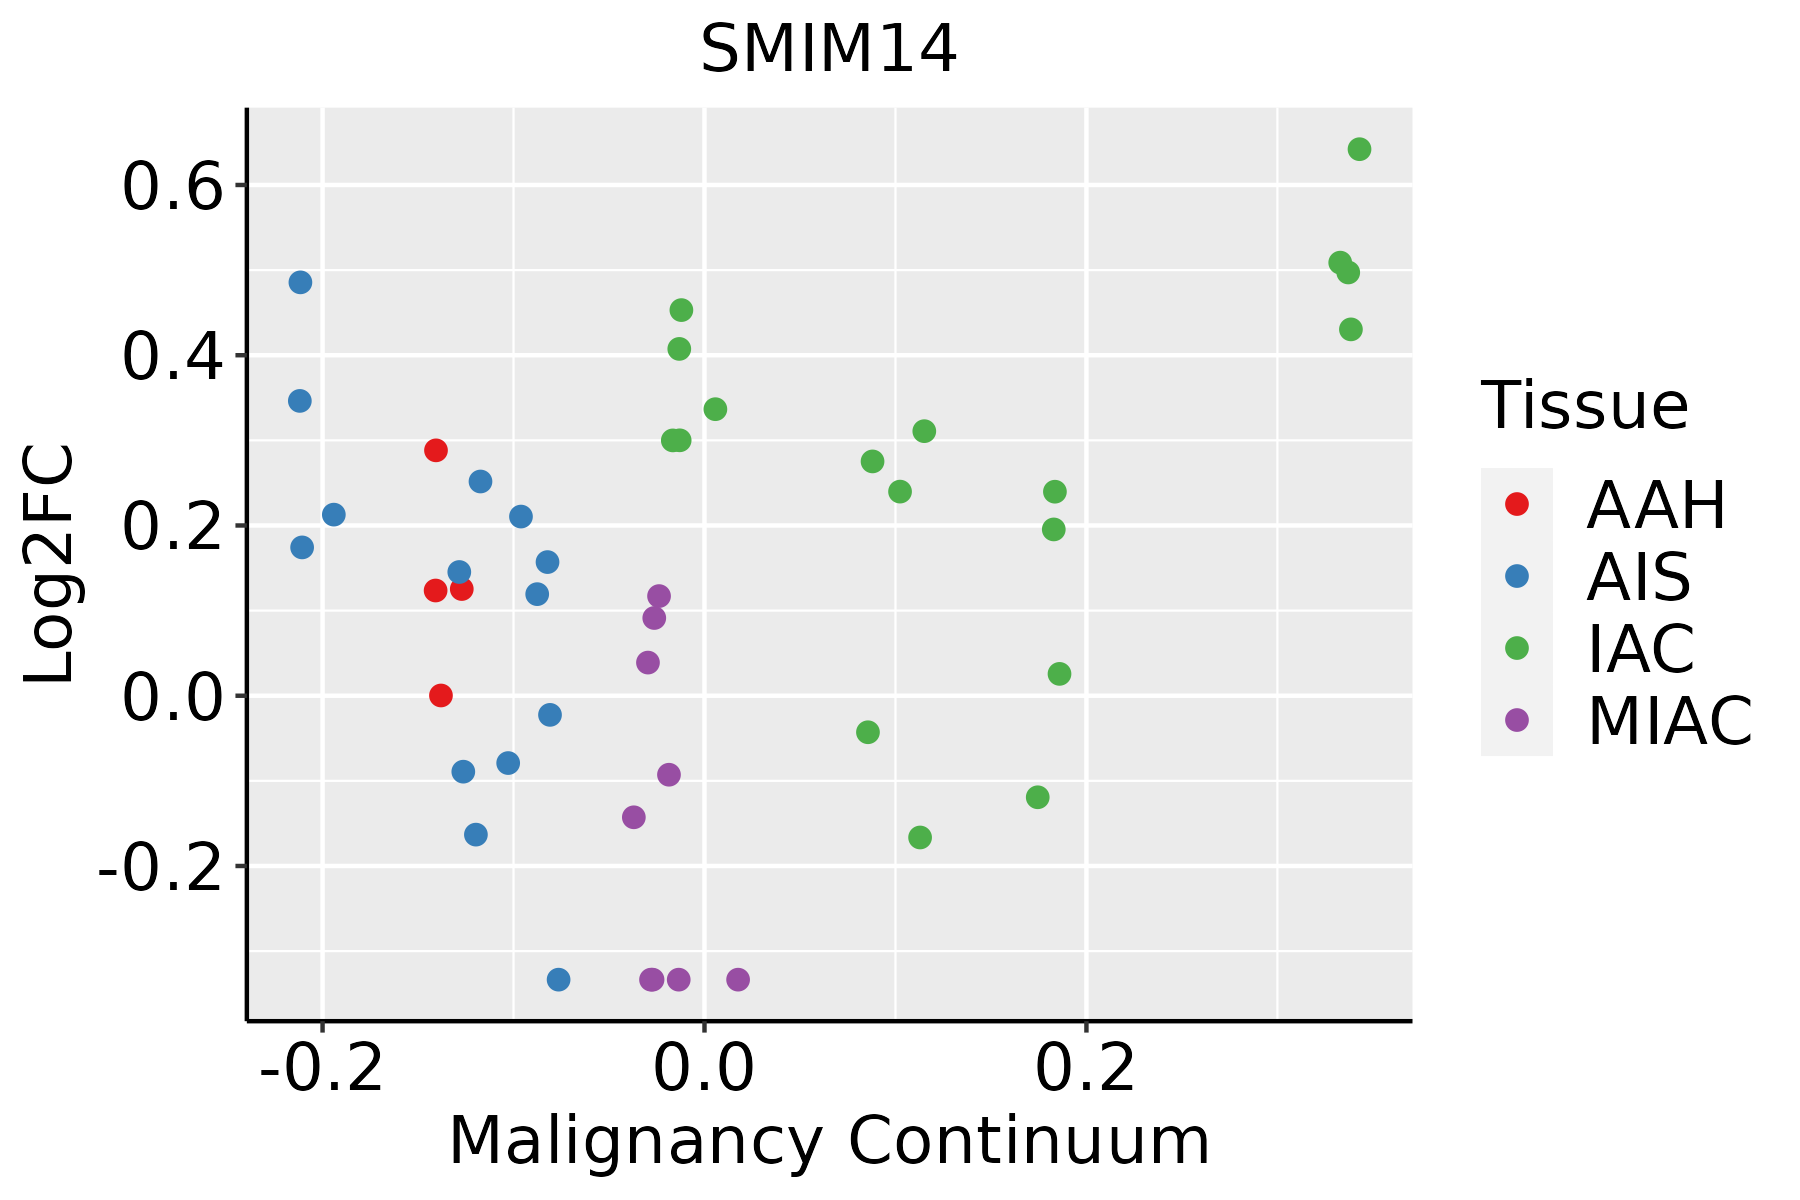 | AAH: Atypical adenomatous hyperplasia |
| AIS: Adenocarcinoma in situ | ||
| IAC: Invasive lung adenocarcinoma | ||
| MIA: Minimally invasive adenocarcinoma | ||
| Oral Cavity | 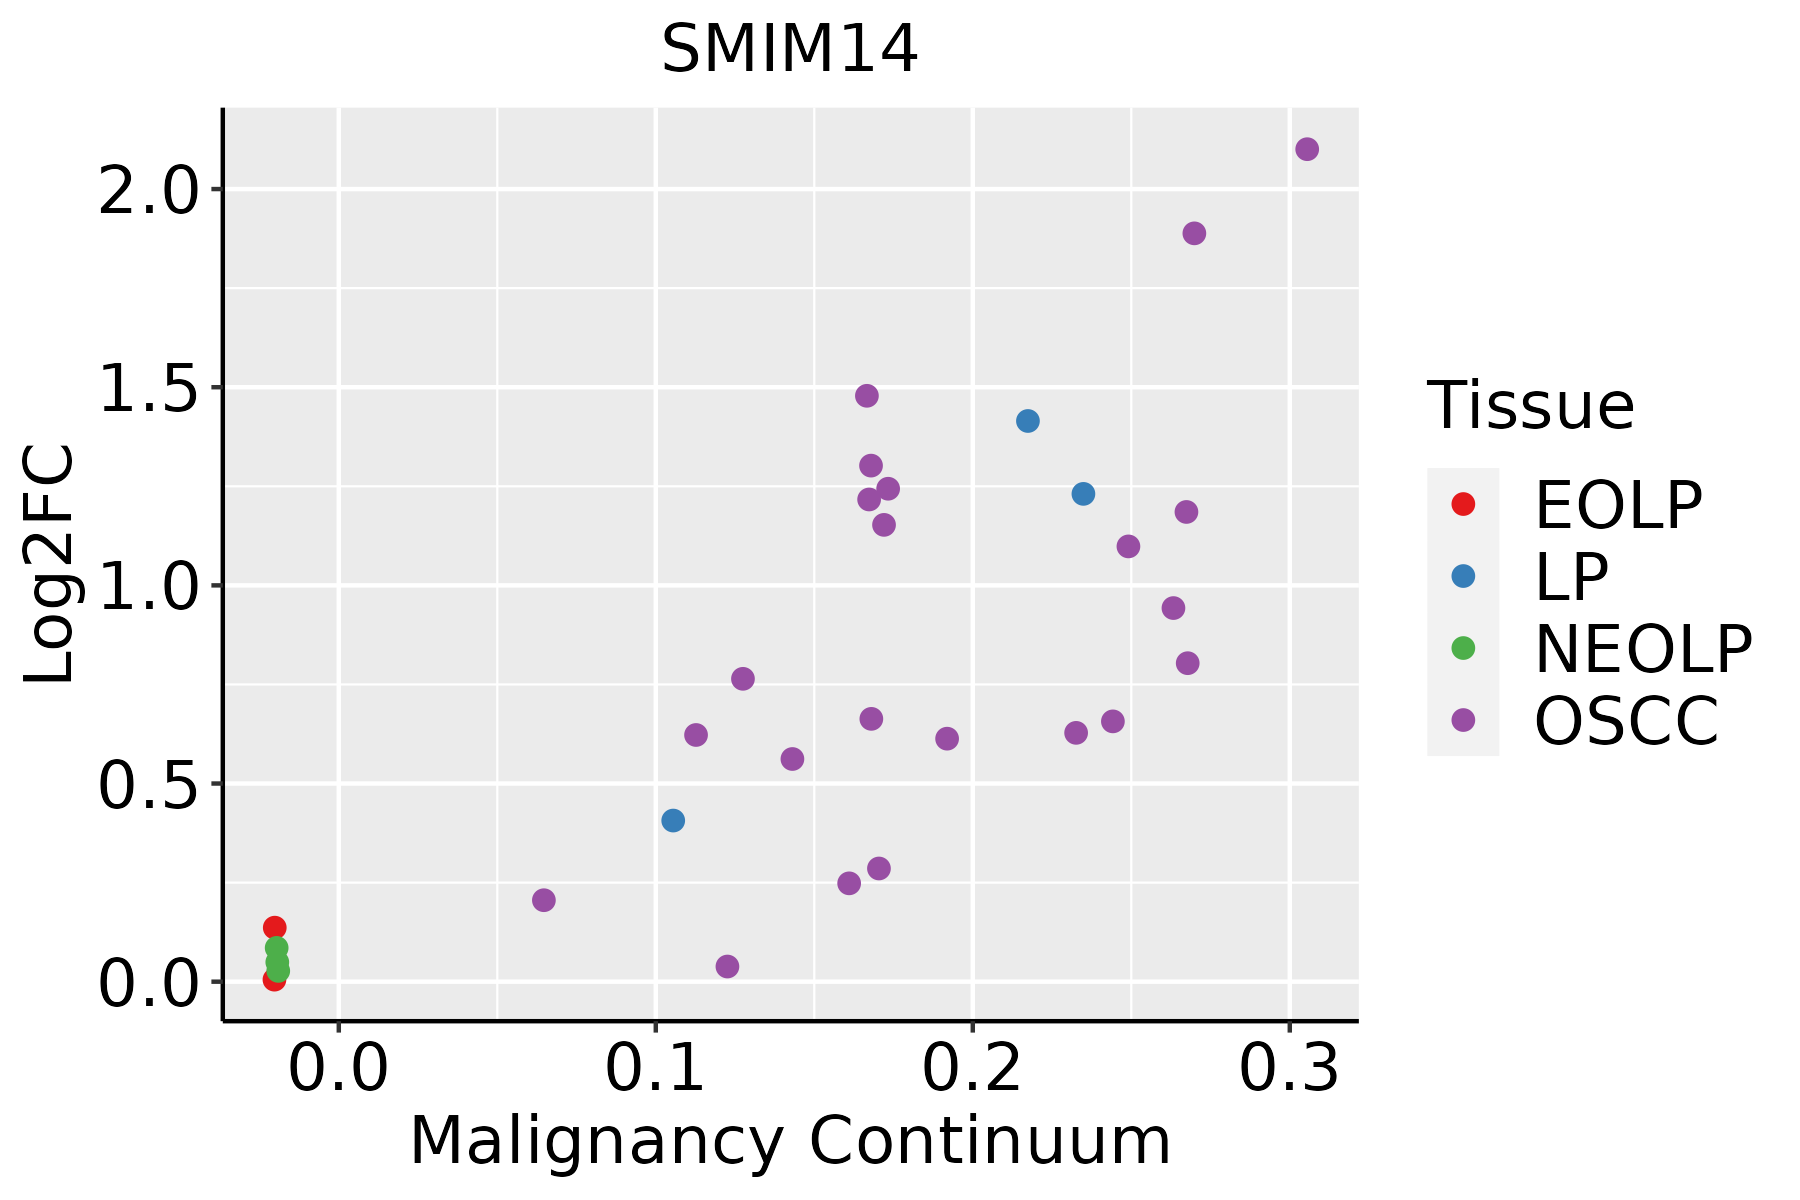 | EOLP: Erosive Oral lichen planus |
| LP: leukoplakia | ||
| NEOLP: Non-erosive oral lichen planus | ||
| OSCC: Oral squamous cell carcinoma | ||
| Prostate |  | BPH: Benign Prostatic Hyperplasia |
| Skin | 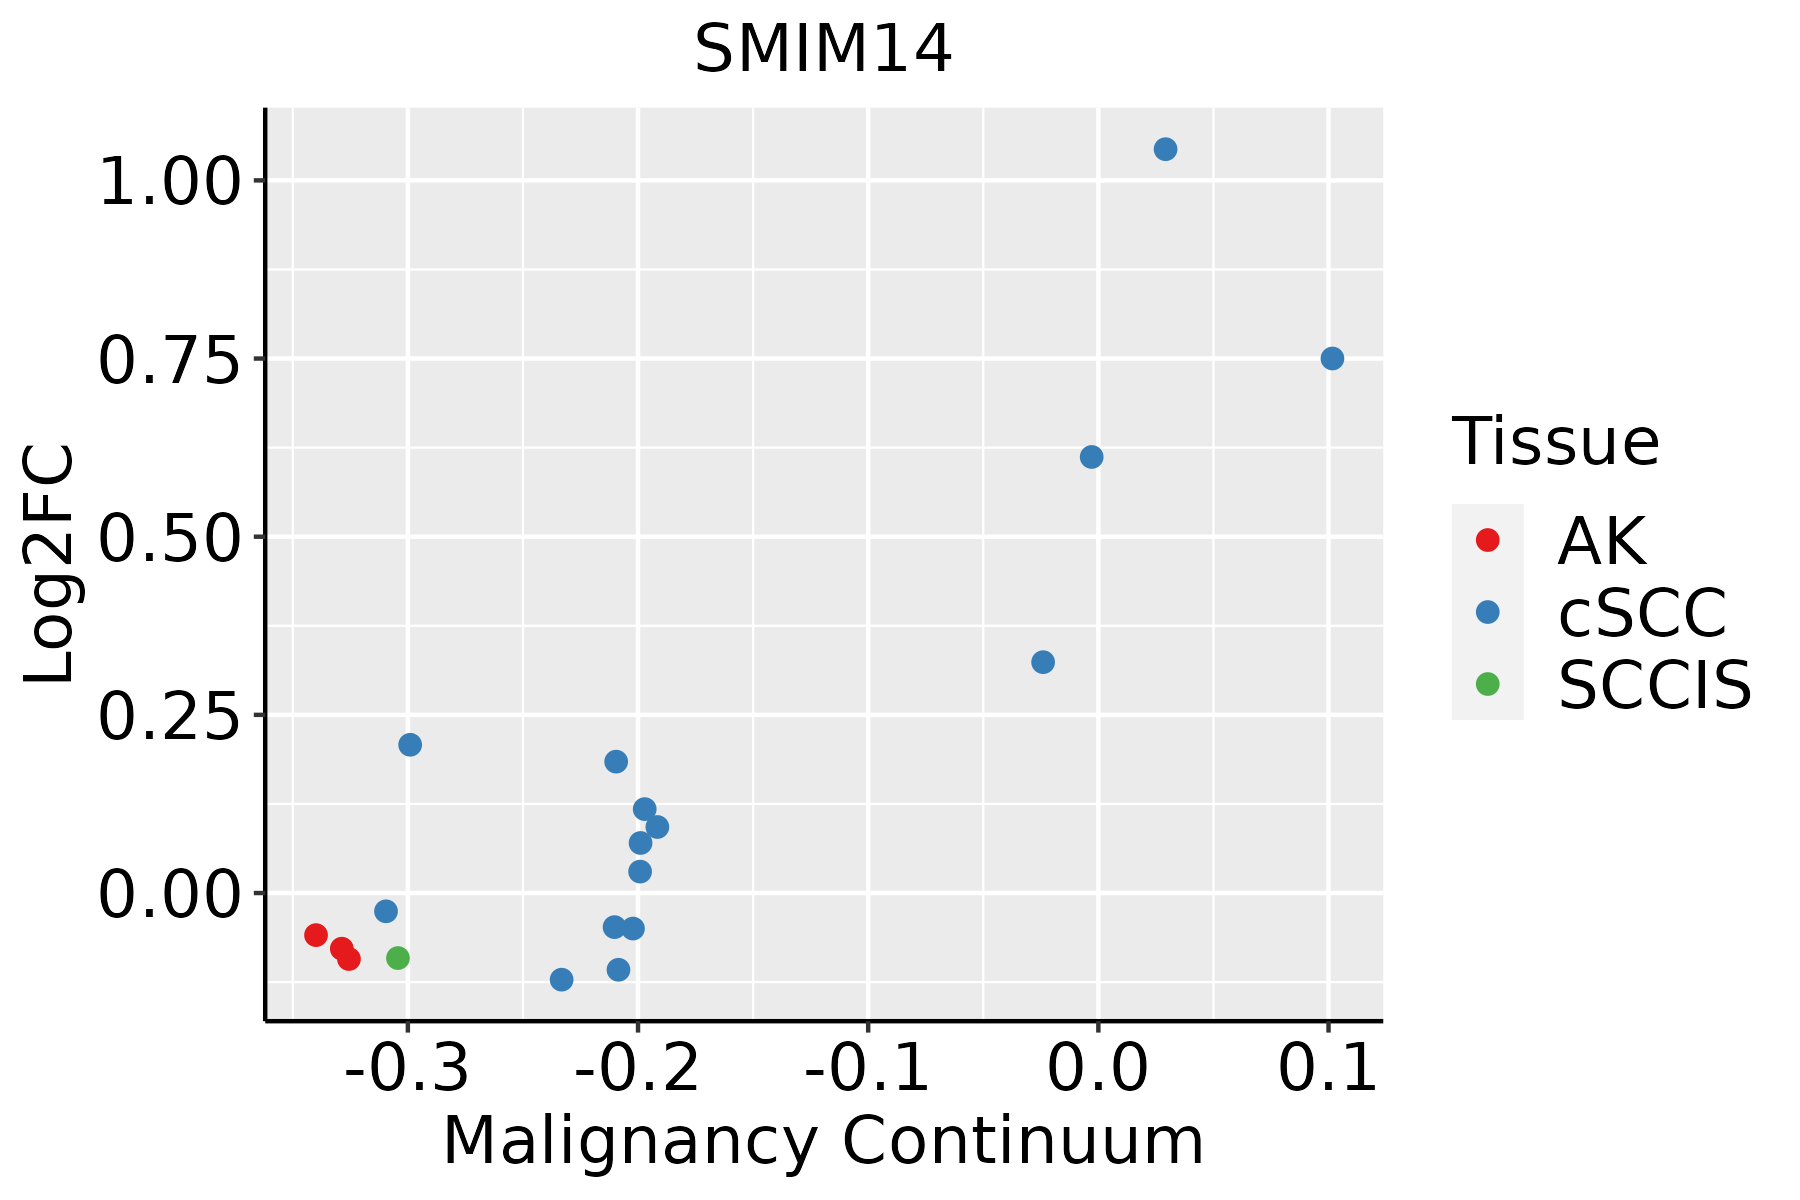 | AK: Actinic keratosis |
| cSCC: Cutaneous squamous cell carcinoma | ||
| SCCIS:squamous cell carcinoma in situ | ||
| Thyroid | 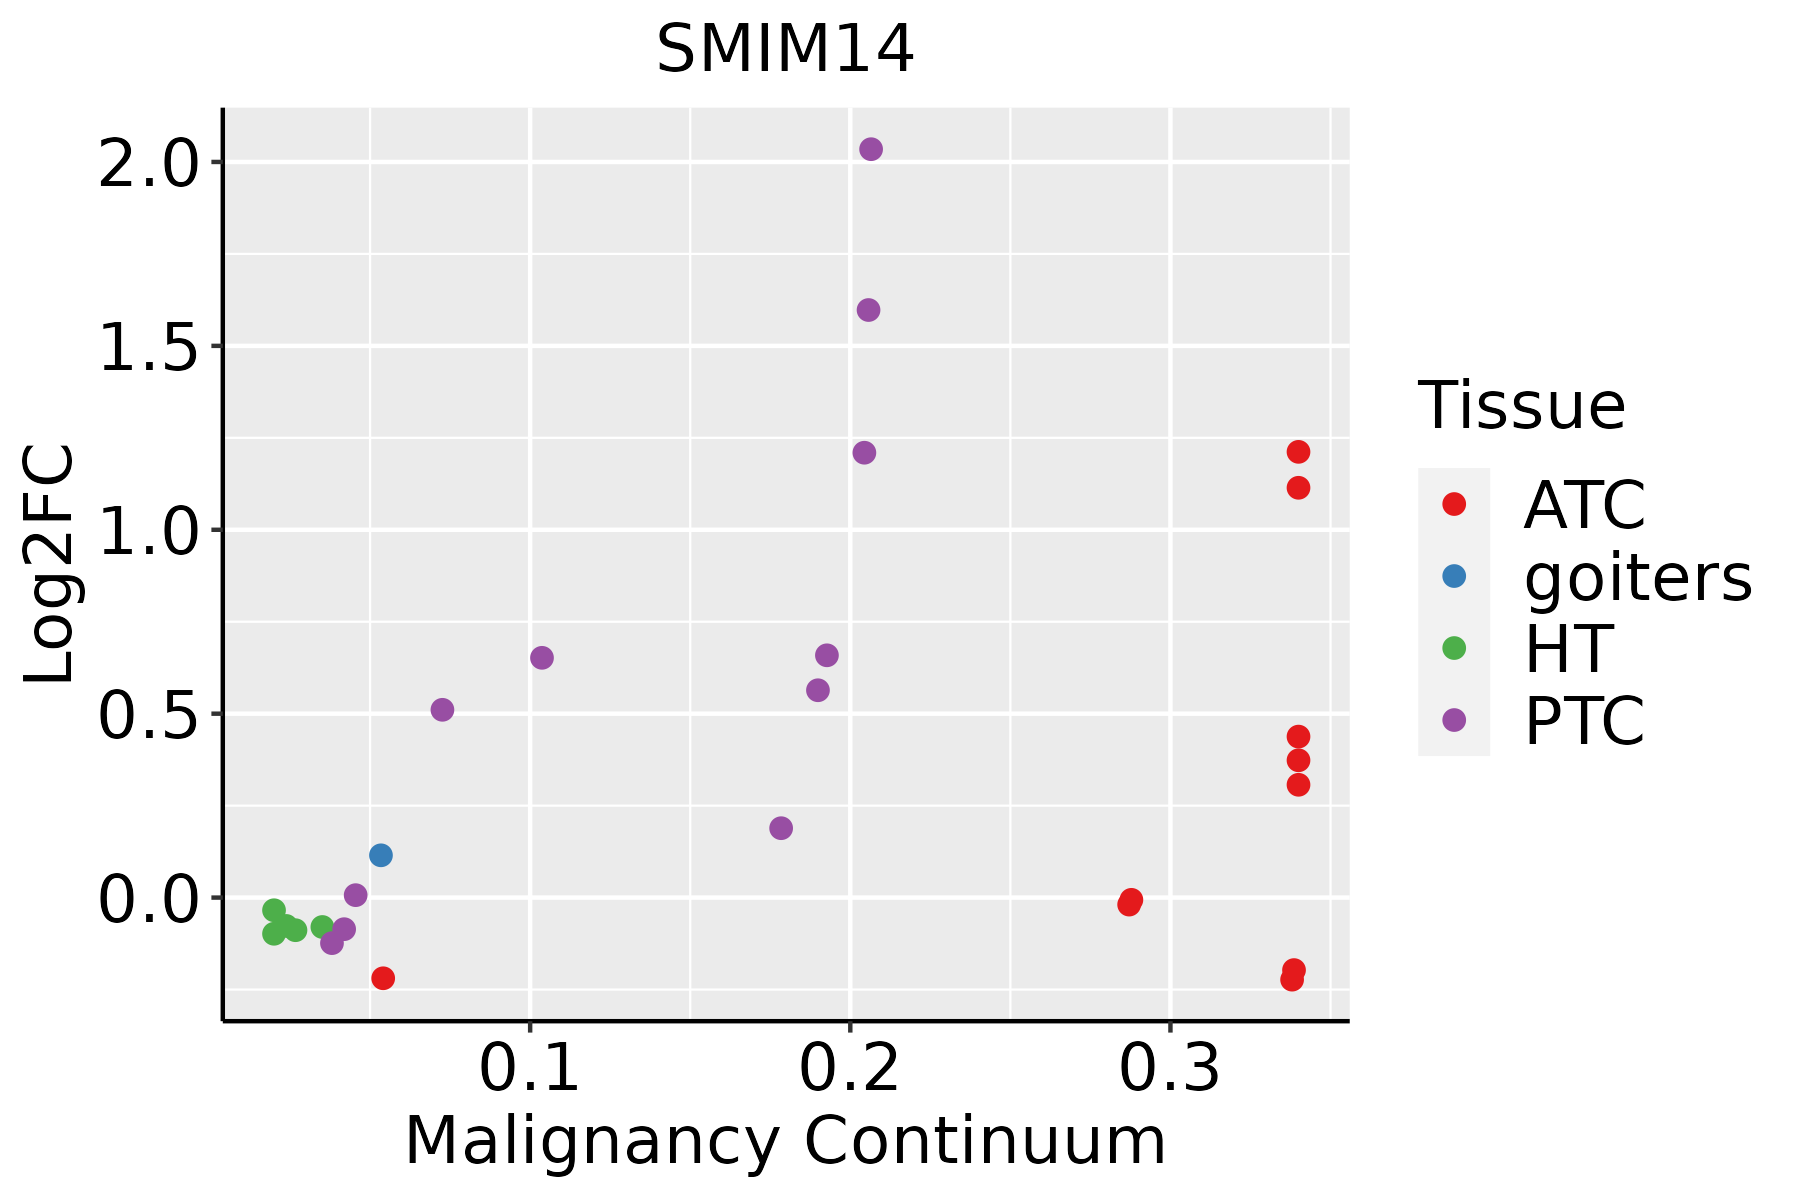 | ATC: Anaplastic thyroid cancer |
| HT: Hashimoto's thyroiditis | ||
| PTC: Papillary thyroid cancer |
| ∗log2FC in expression of this searched gene in stem-like cells from each diseased tissue sample relative to stem-like cells in normal samples in each tissue plotted against the malignancy continuum. Samples are colored based on if they are from different disease stage. |
Top |
Malignant transformation related pathway analysis |
| Find out the enriched GO biological processes and KEGG pathways involved in transition from healthy to precancer to cancer |
| Tissue | Disease Stage | Enriched GO biological Processes |
| Colorectum | AD |  |
| Colorectum | SER |  |
| Colorectum | MSS |  |
| Colorectum | MSI-H |  |
| Colorectum | FAP |  |
| ∗Top 15 enriched GO BP terms are showed in the bar plot of each disease state in each tissue. Each row represents a significant GO biological process which is colored according to the -log10(p.adjust). |
| Page: 1 2 3 4 5 6 7 8 9 |
| GO ID | Tissue | Disease Stage | Description | Gene Ratio | Bg Ratio | pvalue | p.adjust | Count |
| GO:00017017 | Breast | Precancer | in utero embryonic development | 35/1080 | 367/18723 | 2.47e-03 | 2.27e-02 | 35 |
| GO:000170113 | Breast | IDC | in utero embryonic development | 42/1434 | 367/18723 | 5.85e-03 | 4.24e-02 | 42 |
| GO:000170122 | Breast | DCIS | in utero embryonic development | 41/1390 | 367/18723 | 5.74e-03 | 4.13e-02 | 41 |
| GO:0001701 | Colorectum | AD | in utero embryonic development | 110/3918 | 367/18723 | 2.36e-05 | 4.62e-04 | 110 |
| GO:00017011 | Colorectum | SER | in utero embryonic development | 77/2897 | 367/18723 | 2.77e-03 | 2.48e-02 | 77 |
| GO:00017012 | Colorectum | MSS | in utero embryonic development | 99/3467 | 367/18723 | 3.71e-05 | 7.10e-04 | 99 |
| GO:00017013 | Colorectum | FAP | in utero embryonic development | 81/2622 | 367/18723 | 1.58e-05 | 4.10e-04 | 81 |
| GO:00017014 | Colorectum | CRC | in utero embryonic development | 57/2078 | 367/18723 | 5.54e-03 | 4.19e-02 | 57 |
| GO:000170119 | Esophagus | ESCC | in utero embryonic development | 243/8552 | 367/18723 | 1.00e-15 | 6.86e-14 | 243 |
| GO:000182412 | Esophagus | ESCC | blastocyst development | 73/8552 | 106/18723 | 1.13e-06 | 1.40e-05 | 73 |
| GO:00017015 | Liver | Cirrhotic | in utero embryonic development | 134/4634 | 367/18723 | 2.78e-07 | 6.86e-06 | 134 |
| GO:000170111 | Liver | HCC | in utero embryonic development | 204/7958 | 367/18723 | 2.44e-07 | 4.30e-06 | 204 |
| GO:00017016 | Lung | IAC | in utero embryonic development | 68/2061 | 367/18723 | 1.12e-05 | 3.45e-04 | 68 |
| GO:000170112 | Lung | AIS | in utero embryonic development | 59/1849 | 367/18723 | 1.20e-04 | 2.75e-03 | 59 |
| GO:000170116 | Oral cavity | OSCC | in utero embryonic development | 207/7305 | 367/18723 | 7.92e-12 | 2.95e-10 | 207 |
| GO:00018243 | Oral cavity | OSCC | blastocyst development | 66/7305 | 106/18723 | 1.04e-06 | 1.40e-05 | 66 |
| GO:000170117 | Oral cavity | LP | in utero embryonic development | 142/4623 | 367/18723 | 1.48e-09 | 6.75e-08 | 142 |
| GO:000182411 | Oral cavity | LP | blastocyst development | 46/4623 | 106/18723 | 1.86e-05 | 3.15e-04 | 46 |
| GO:000170123 | Oral cavity | EOLP | in utero embryonic development | 72/2218 | 367/18723 | 1.02e-05 | 1.83e-04 | 72 |
| GO:000170110 | Prostate | BPH | in utero embryonic development | 104/3107 | 367/18723 | 9.17e-09 | 3.10e-07 | 104 |
| Page: 1 2 |
| Pathway ID | Tissue | Disease Stage | Description | Gene Ratio | Bg Ratio | pvalue | p.adjust | qvalue | Count |
| Page: 1 |
Top |
Cell-cell communication analysis |
| Identification of potential cell-cell interactions between two cell types and their ligand-receptor pairs for different disease states |
| Ligand | Receptor | LRpair | Pathway | Tissue | Disease Stage |
| Page: 1 |
Top |
Single-cell gene regulatory network inference analysis |
| Find out the significant the regulons (TFs) and the target genes of each regulon across cell types for different disease states |
| TF | Cell Type | Tissue | Disease Stage | Target Gene | RSS | Regulon Activity |
| ∗The dot plots of a searched regulon are shown for all cell subpopulations in each disease state of each tissue based on the regulon specific score inferred using pySCENIC and by calculating the average expression. |
| Page: 1 |
Top |
Somatic mutation of malignant transformation related genes |
| Annotation of somatic variants for genes involved in malignant transformation |
| Hugo Symbol | Variant Class | Variant Classification | dbSNP RS | HGVSc | HGVSp | HGVSp Short | SWISSPROT | BIOTYPE | SIFT | PolyPhen | Tumor Sample Barcode | Tissue | Histology | Sex | Age | Stage | Therapy Types | Drugs | Outcome |
| SMIM14 | SNV | Missense_Mutation | novel | c.218N>T | p.Pro73Leu | p.P73L | Q96QK8 | protein_coding | tolerated(0.31) | benign(0.023) | TCGA-AR-A5QP-01 | Breast | breast invasive carcinoma | Female | <65 | I/II | Hormone Therapy | tamoxiphen | SD |
| SMIM14 | SNV | Missense_Mutation | c.153N>G | p.Ile51Met | p.I51M | Q96QK8 | protein_coding | tolerated(0.23) | benign(0.185) | TCGA-EK-A2H0-01 | Cervix | cervical & endocervical cancer | Female | <65 | I/II | Chemotherapy | cisplatin | CR | |
| SMIM14 | SNV | Missense_Mutation | c.153N>G | p.Ile51Met | p.I51M | Q96QK8 | protein_coding | tolerated(0.23) | benign(0.185) | TCGA-ZJ-A8QQ-01 | Cervix | cervical & endocervical cancer | Female | <65 | I/II | Chemotherapy | cisplatin | SD | |
| SMIM14 | SNV | Missense_Mutation | novel | c.103N>A | p.Asp35Asn | p.D35N | Q96QK8 | protein_coding | deleterious(0) | benign(0.137) | TCGA-A5-A1OF-01 | Endometrium | uterine corpus endometrioid carcinoma | Female | <65 | I/II | Unknown | Unknown | SD |
| SMIM14 | SNV | Missense_Mutation | c.281N>T | p.Pro94Leu | p.P94L | Q96QK8 | protein_coding | deleterious(0) | possibly_damaging(0.566) | TCGA-EP-A26S-01 | Liver | liver hepatocellular carcinoma | Male | >=65 | I/II | Unknown | Unknown | SD | |
| SMIM14 | SNV | Missense_Mutation | c.65T>C | p.Leu22Pro | p.L22P | Q96QK8 | protein_coding | deleterious(0) | probably_damaging(0.985) | TCGA-BR-8591-01 | Stomach | stomach adenocarcinoma | Male | >=65 | III/IV | Unknown | Unknown | SD |
| Page: 1 |
Top |
Related drugs of malignant transformation related genes |
| Identification of chemicals and drugs interact with genes involved in malignant transfromation |
| (DGIdb 4.0) |
| Entrez ID | Symbol | Category | Interaction Types | Drug Claim Name | Drug Name | PMIDs |
| Page: 1 |

Copyright 2023-Present -The University of Texas Health Science Center at Houston |