
|
|||||
|
 | |
| |
| |
| |
| |
| |
|
Gene: SMIM1 |
Gene summary for SMIM1 |
| Gene information | Species | Human | Gene symbol | SMIM1 | Gene ID | 388588 |
| Gene name | small integral membrane protein 1 (Vel blood group) | |
| Gene Alias | Vel | |
| Cytomap | 1p36.32 | |
| Gene Type | protein-coding | GO ID | GO:0005575 | UniProtAcc | B2RUZ4 |
Top |
Malignant transformation analysis |
| Identification of the aberrant gene expression in precancerous and cancerous lesions by comparing the gene expression of stem-like cells in diseased tissues with normal stem cells |
| Entrez ID | Symbol | Replicates | Species | Organ | Tissue | Adj P-value | Log2FC | Malignancy |
| 388588 | SMIM1 | LZE24T | Human | Esophagus | ESCC | 1.79e-04 | 1.06e-01 | 0.0596 |
| 388588 | SMIM1 | P2T-E | Human | Esophagus | ESCC | 7.91e-07 | 1.17e-01 | 0.1177 |
| 388588 | SMIM1 | P4T-E | Human | Esophagus | ESCC | 3.27e-15 | 3.23e-01 | 0.1323 |
| 388588 | SMIM1 | P8T-E | Human | Esophagus | ESCC | 1.24e-06 | 1.43e-01 | 0.0889 |
| 388588 | SMIM1 | P9T-E | Human | Esophagus | ESCC | 2.24e-05 | 9.14e-02 | 0.1131 |
| 388588 | SMIM1 | P11T-E | Human | Esophagus | ESCC | 6.15e-05 | 1.79e-01 | 0.1426 |
| 388588 | SMIM1 | P16T-E | Human | Esophagus | ESCC | 3.74e-10 | 1.48e-01 | 0.1153 |
| 388588 | SMIM1 | P21T-E | Human | Esophagus | ESCC | 6.38e-09 | 1.73e-01 | 0.1617 |
| 388588 | SMIM1 | P22T-E | Human | Esophagus | ESCC | 1.82e-06 | 5.32e-02 | 0.1236 |
| 388588 | SMIM1 | P23T-E | Human | Esophagus | ESCC | 5.57e-03 | 1.06e-01 | 0.108 |
| 388588 | SMIM1 | P24T-E | Human | Esophagus | ESCC | 2.06e-03 | 4.48e-02 | 0.1287 |
| 388588 | SMIM1 | P26T-E | Human | Esophagus | ESCC | 1.00e-13 | 1.09e-01 | 0.1276 |
| 388588 | SMIM1 | P27T-E | Human | Esophagus | ESCC | 1.14e-02 | 3.23e-02 | 0.1055 |
| 388588 | SMIM1 | P37T-E | Human | Esophagus | ESCC | 2.03e-06 | 7.63e-02 | 0.1371 |
| 388588 | SMIM1 | P39T-E | Human | Esophagus | ESCC | 4.36e-03 | 6.23e-03 | 0.0894 |
| 388588 | SMIM1 | P40T-E | Human | Esophagus | ESCC | 2.88e-04 | 1.45e-01 | 0.109 |
| 388588 | SMIM1 | P42T-E | Human | Esophagus | ESCC | 3.56e-04 | 1.20e-01 | 0.1175 |
| 388588 | SMIM1 | P48T-E | Human | Esophagus | ESCC | 1.51e-04 | 6.64e-02 | 0.0959 |
| 388588 | SMIM1 | P49T-E | Human | Esophagus | ESCC | 1.84e-06 | 8.20e-01 | 0.1768 |
| 388588 | SMIM1 | P54T-E | Human | Esophagus | ESCC | 6.99e-11 | 1.53e-01 | 0.0975 |
| Page: 1 2 3 4 |
| Tissue | Expression Dynamics | Abbreviation |
| Esophagus | 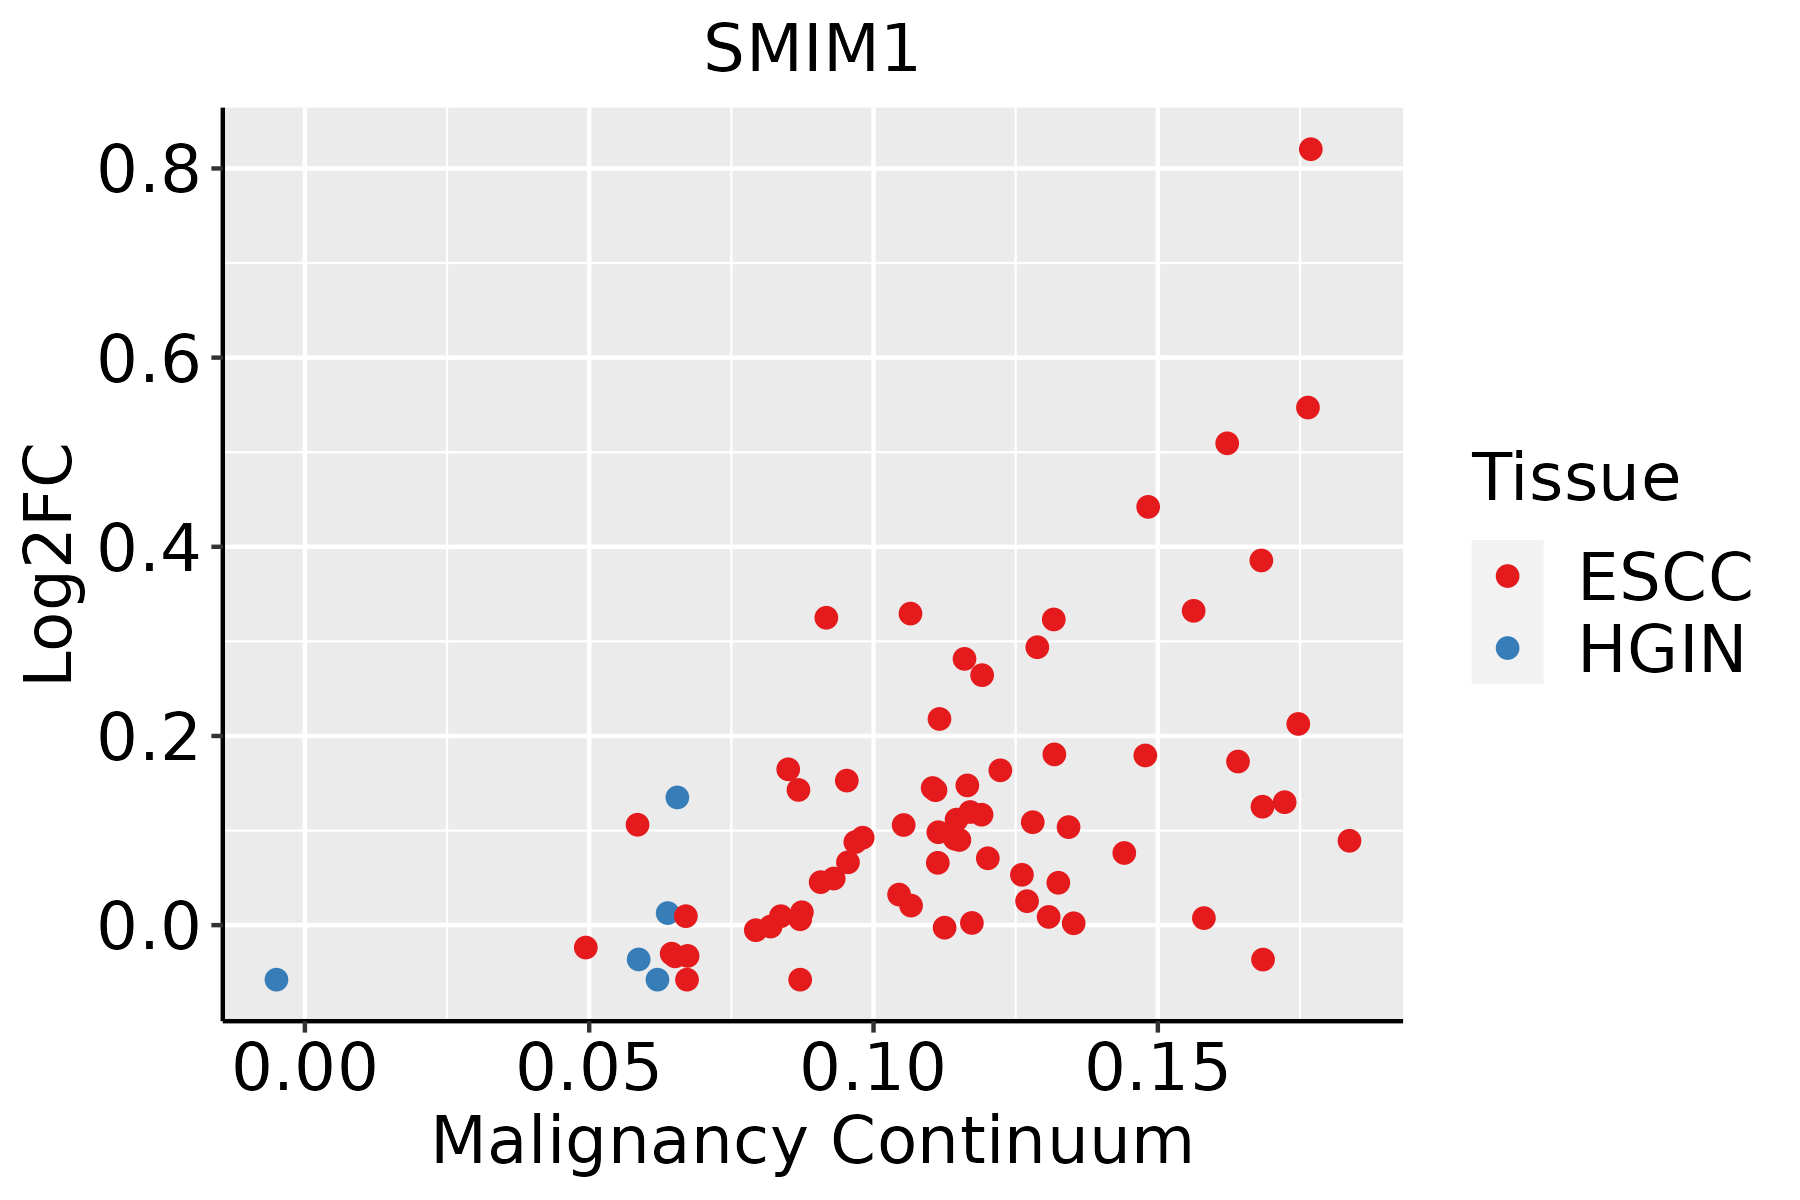 | ESCC: Esophageal squamous cell carcinoma |
| HGIN: High-grade intraepithelial neoplasias | ||
| LGIN: Low-grade intraepithelial neoplasias | ||
| Liver | 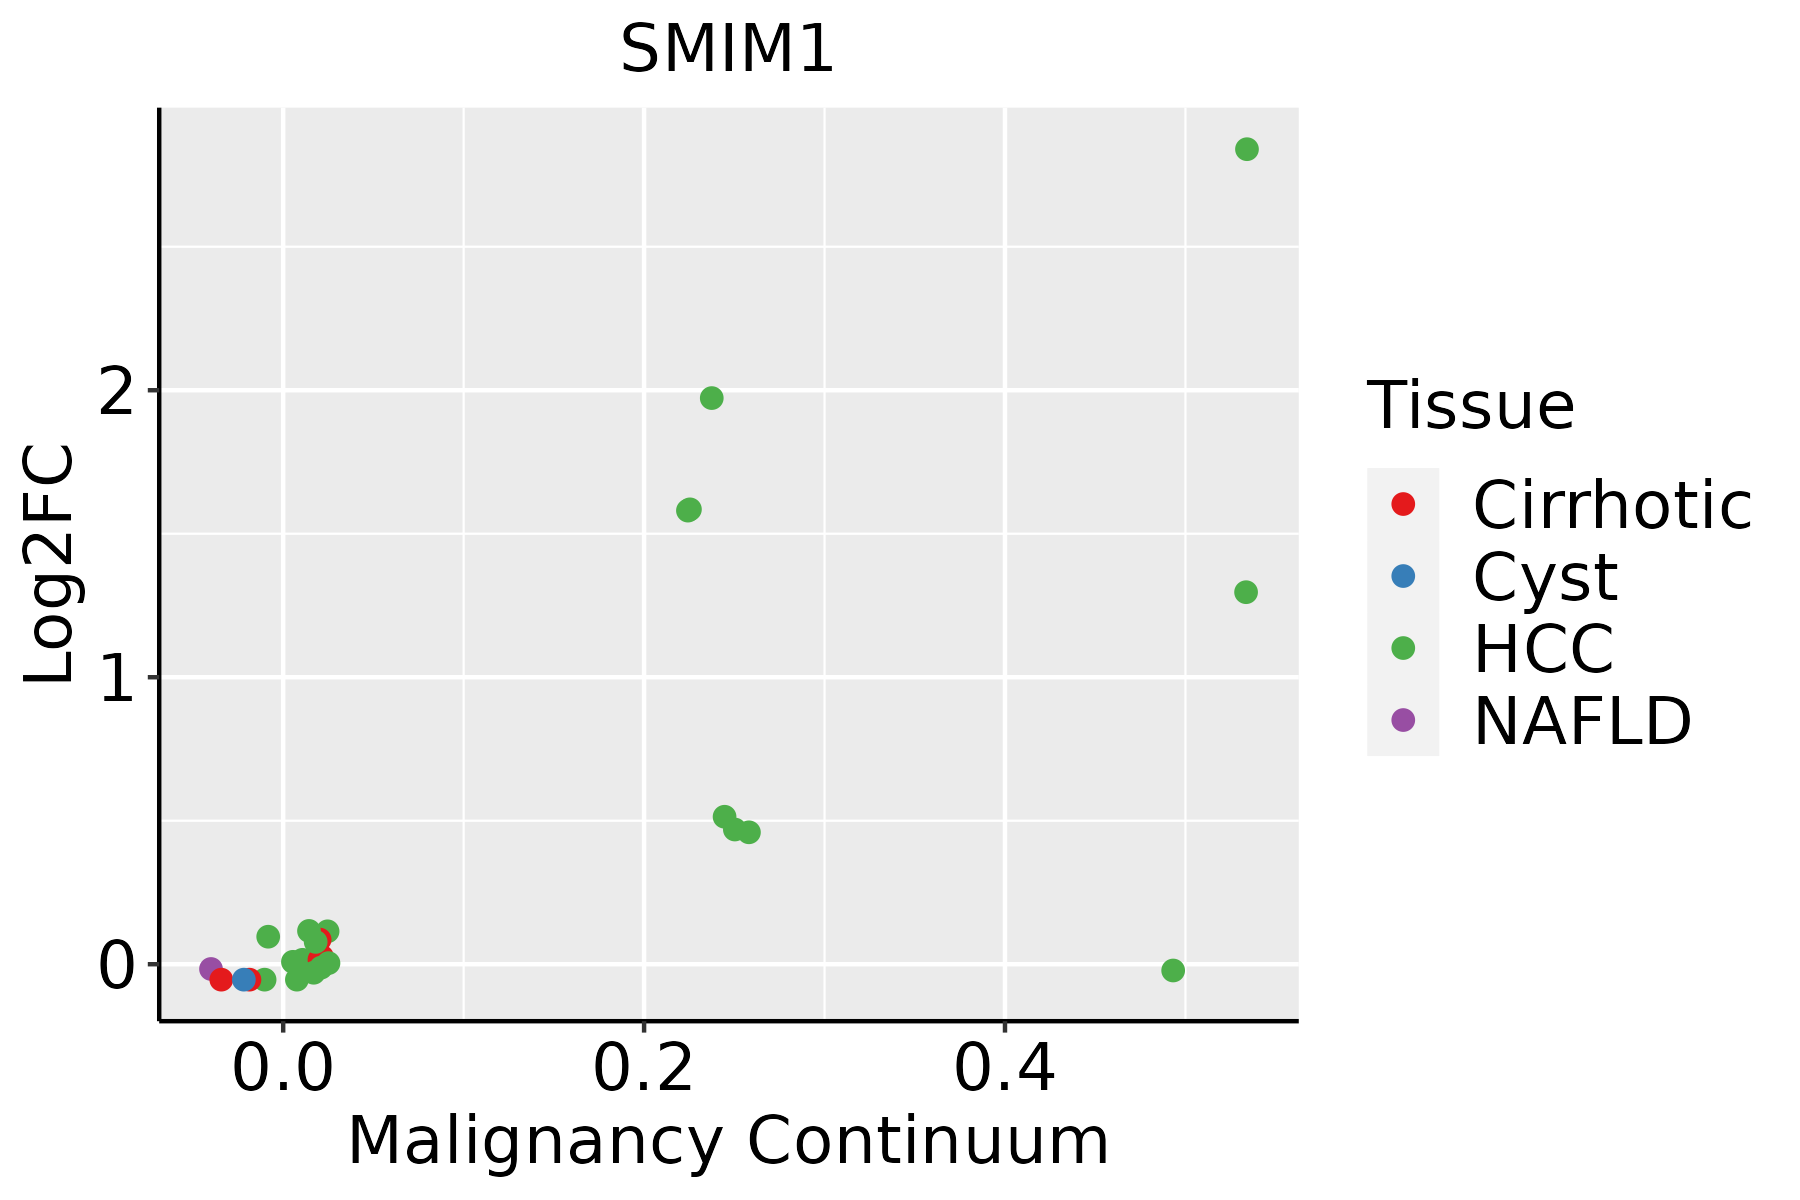 | HCC: Hepatocellular carcinoma |
| NAFLD: Non-alcoholic fatty liver disease | ||
| Oral Cavity |  | EOLP: Erosive Oral lichen planus |
| LP: leukoplakia | ||
| NEOLP: Non-erosive oral lichen planus | ||
| OSCC: Oral squamous cell carcinoma | ||
| Prostate | 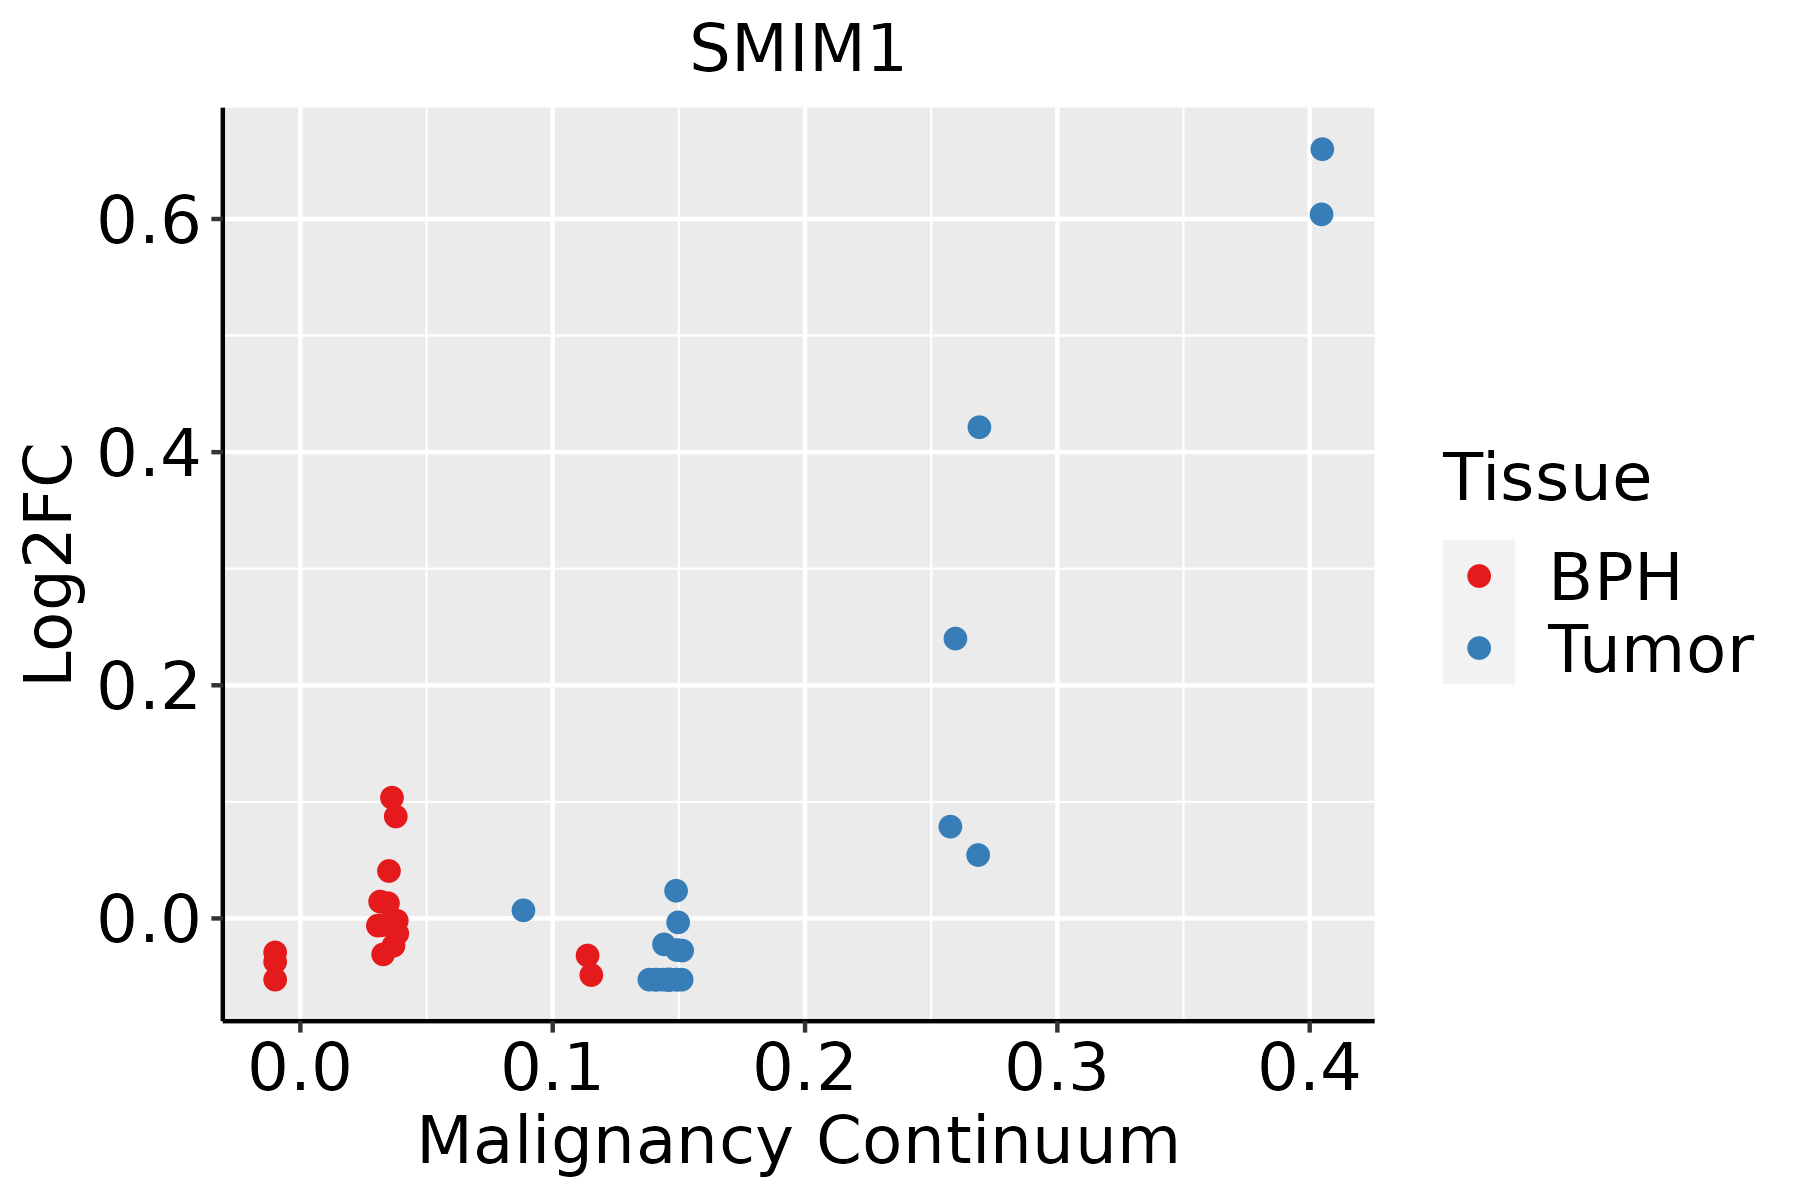 | BPH: Benign Prostatic Hyperplasia |
| Thyroid | 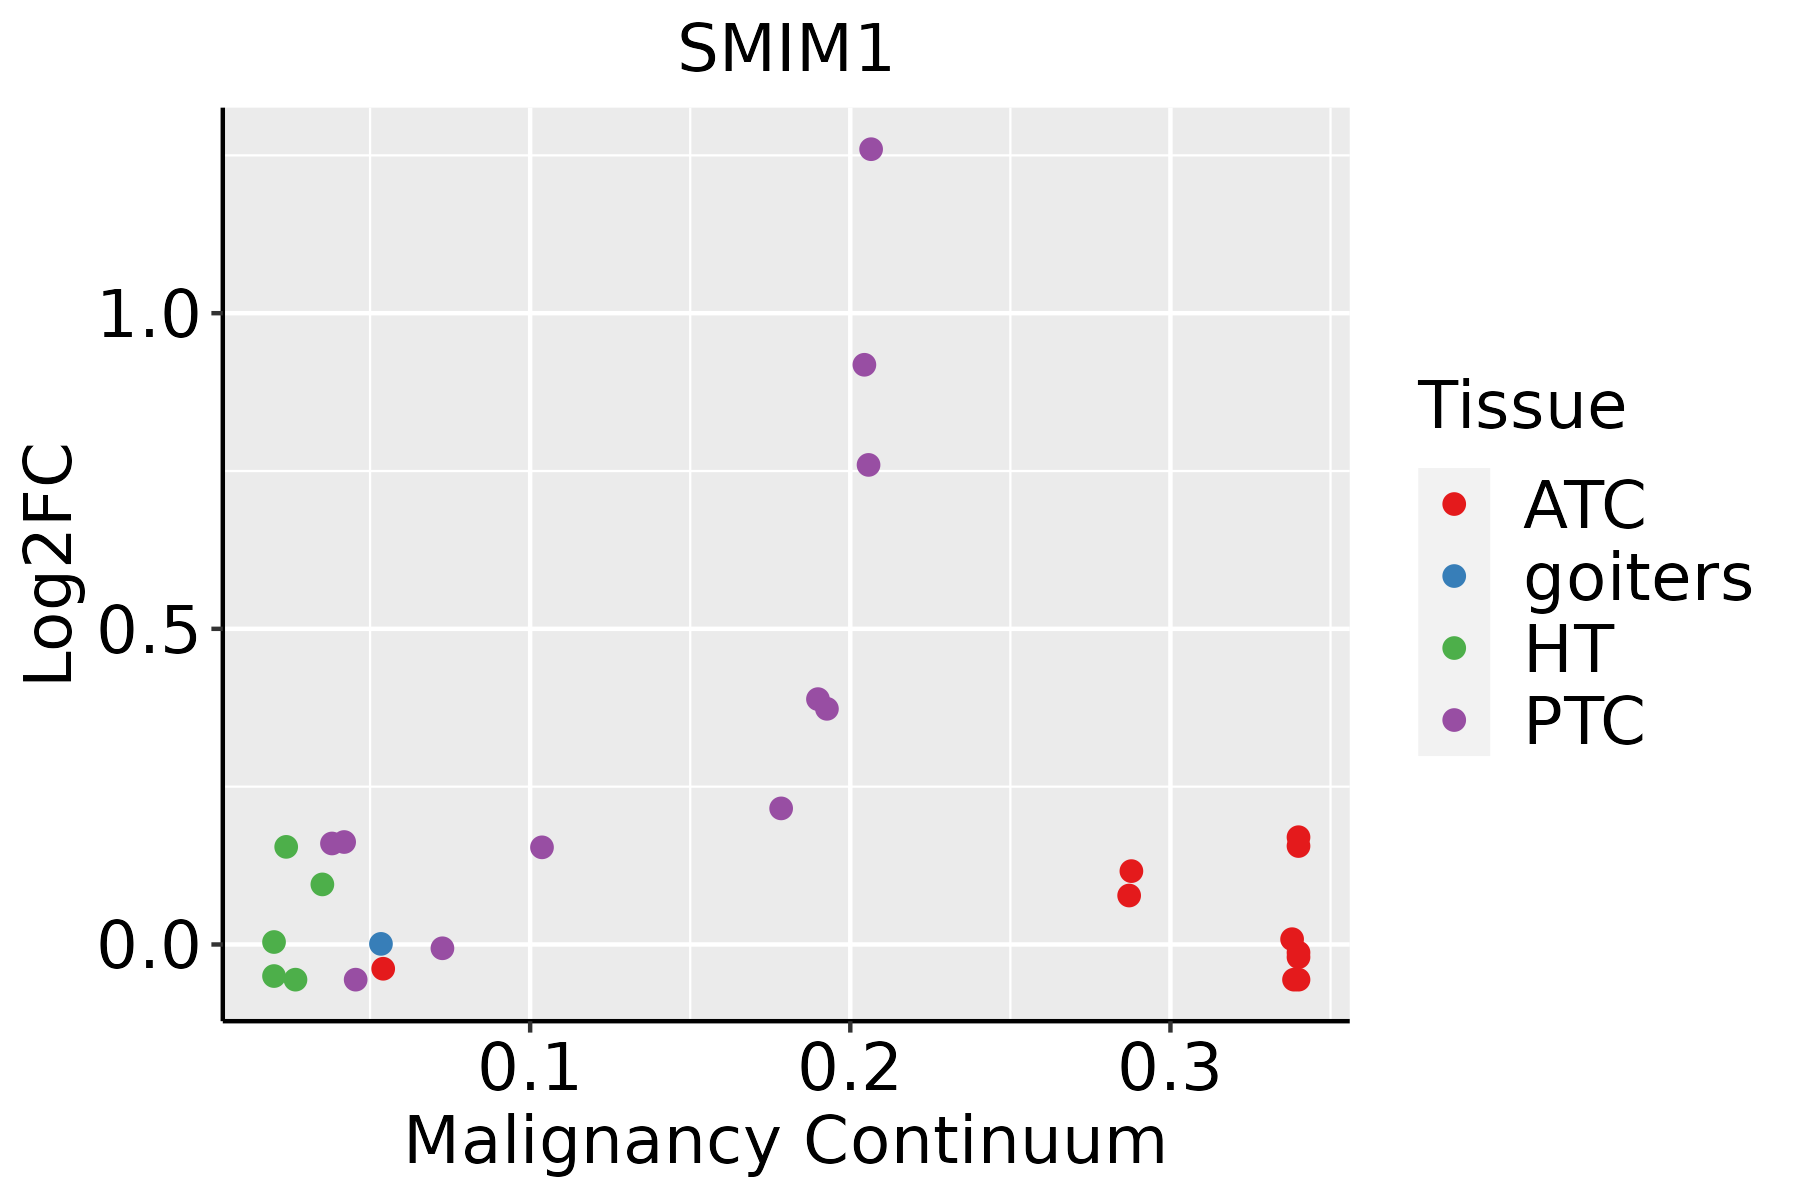 | ATC: Anaplastic thyroid cancer |
| HT: Hashimoto's thyroiditis | ||
| PTC: Papillary thyroid cancer |
| ∗log2FC in expression of this searched gene in stem-like cells from each diseased tissue sample relative to stem-like cells in normal samples in each tissue plotted against the malignancy continuum. Samples are colored based on if they are from different disease stage. |
Top |
Malignant transformation related pathway analysis |
| Find out the enriched GO biological processes and KEGG pathways involved in transition from healthy to precancer to cancer |
| Tissue | Disease Stage | Enriched GO biological Processes |
| Colorectum | AD |  |
| Colorectum | SER |  |
| Colorectum | MSS |  |
| Colorectum | MSI-H |  |
| Colorectum | FAP |  |
| ∗Top 15 enriched GO BP terms are showed in the bar plot of each disease state in each tissue. Each row represents a significant GO biological process which is colored according to the -log10(p.adjust). |
| Page: 1 2 3 4 5 6 7 8 9 |
| GO ID | Tissue | Disease Stage | Description | Gene Ratio | Bg Ratio | pvalue | p.adjust | Count |
| GO:00017017 | Breast | Precancer | in utero embryonic development | 35/1080 | 367/18723 | 2.47e-03 | 2.27e-02 | 35 |
| GO:000170113 | Breast | IDC | in utero embryonic development | 42/1434 | 367/18723 | 5.85e-03 | 4.24e-02 | 42 |
| GO:000170122 | Breast | DCIS | in utero embryonic development | 41/1390 | 367/18723 | 5.74e-03 | 4.13e-02 | 41 |
| GO:0001701 | Colorectum | AD | in utero embryonic development | 110/3918 | 367/18723 | 2.36e-05 | 4.62e-04 | 110 |
| GO:00017011 | Colorectum | SER | in utero embryonic development | 77/2897 | 367/18723 | 2.77e-03 | 2.48e-02 | 77 |
| GO:00017012 | Colorectum | MSS | in utero embryonic development | 99/3467 | 367/18723 | 3.71e-05 | 7.10e-04 | 99 |
| GO:00017013 | Colorectum | FAP | in utero embryonic development | 81/2622 | 367/18723 | 1.58e-05 | 4.10e-04 | 81 |
| GO:00017014 | Colorectum | CRC | in utero embryonic development | 57/2078 | 367/18723 | 5.54e-03 | 4.19e-02 | 57 |
| GO:000170119 | Esophagus | ESCC | in utero embryonic development | 243/8552 | 367/18723 | 1.00e-15 | 6.86e-14 | 243 |
| GO:000182412 | Esophagus | ESCC | blastocyst development | 73/8552 | 106/18723 | 1.13e-06 | 1.40e-05 | 73 |
| GO:00017015 | Liver | Cirrhotic | in utero embryonic development | 134/4634 | 367/18723 | 2.78e-07 | 6.86e-06 | 134 |
| GO:000170111 | Liver | HCC | in utero embryonic development | 204/7958 | 367/18723 | 2.44e-07 | 4.30e-06 | 204 |
| GO:00017016 | Lung | IAC | in utero embryonic development | 68/2061 | 367/18723 | 1.12e-05 | 3.45e-04 | 68 |
| GO:000170112 | Lung | AIS | in utero embryonic development | 59/1849 | 367/18723 | 1.20e-04 | 2.75e-03 | 59 |
| GO:000170116 | Oral cavity | OSCC | in utero embryonic development | 207/7305 | 367/18723 | 7.92e-12 | 2.95e-10 | 207 |
| GO:00018243 | Oral cavity | OSCC | blastocyst development | 66/7305 | 106/18723 | 1.04e-06 | 1.40e-05 | 66 |
| GO:000170117 | Oral cavity | LP | in utero embryonic development | 142/4623 | 367/18723 | 1.48e-09 | 6.75e-08 | 142 |
| GO:000182411 | Oral cavity | LP | blastocyst development | 46/4623 | 106/18723 | 1.86e-05 | 3.15e-04 | 46 |
| GO:000170123 | Oral cavity | EOLP | in utero embryonic development | 72/2218 | 367/18723 | 1.02e-05 | 1.83e-04 | 72 |
| GO:000170110 | Prostate | BPH | in utero embryonic development | 104/3107 | 367/18723 | 9.17e-09 | 3.10e-07 | 104 |
| Page: 1 2 |
| Pathway ID | Tissue | Disease Stage | Description | Gene Ratio | Bg Ratio | pvalue | p.adjust | qvalue | Count |
| Page: 1 |
Top |
Cell-cell communication analysis |
| Identification of potential cell-cell interactions between two cell types and their ligand-receptor pairs for different disease states |
| Ligand | Receptor | LRpair | Pathway | Tissue | Disease Stage |
| Page: 1 |
Top |
Single-cell gene regulatory network inference analysis |
| Find out the significant the regulons (TFs) and the target genes of each regulon across cell types for different disease states |
| TF | Cell Type | Tissue | Disease Stage | Target Gene | RSS | Regulon Activity |
| ∗The dot plots of a searched regulon are shown for all cell subpopulations in each disease state of each tissue based on the regulon specific score inferred using pySCENIC and by calculating the average expression. |
| Page: 1 |
Top |
Somatic mutation of malignant transformation related genes |
| Annotation of somatic variants for genes involved in malignant transformation |
| Hugo Symbol | Variant Class | Variant Classification | dbSNP RS | HGVSc | HGVSp | HGVSp Short | SWISSPROT | BIOTYPE | SIFT | PolyPhen | Tumor Sample Barcode | Tissue | Histology | Sex | Age | Stage | Therapy Types | Drugs | Outcome |
| SMIM1 | deletion | Frame_Shift_Del | novel | c.201delC | p.Tyr68ThrfsTer? | p.Y68Tfs*? | B2RUZ4 | protein_coding | TCGA-EW-A2FV-01 | Breast | breast invasive carcinoma | Female | <65 | III/IV | Chemotherapy | docetaxel | SD | ||
| SMIM1 | SNV | Missense_Mutation | novel | c.106C>T | p.Arg36Cys | p.R36C | B2RUZ4 | protein_coding | deleterious(0.03) | benign(0.339) | TCGA-2W-A8YY-01 | Cervix | cervical & endocervical cancer | Female | <65 | I/II | Chemotherapy | cisplatin | CR |
| SMIM1 | SNV | Missense_Mutation | rs758771367 | c.107N>A | p.Arg36His | p.R36H | B2RUZ4 | protein_coding | tolerated(0.09) | benign(0.11) | TCGA-EA-A556-01 | Cervix | cervical & endocervical cancer | Female | <65 | I/II | Unknown | Unknown | SD |
| SMIM1 | SNV | Missense_Mutation | rs543695662 | c.166G>A | p.Gly56Ser | p.G56S | B2RUZ4 | protein_coding | tolerated(0.17) | possibly_damaging(0.858) | TCGA-EI-6507-01 | Colorectum | rectum adenocarcinoma | Male | <65 | I/II | Unknown | Unknown | SD |
| SMIM1 | SNV | Missense_Mutation | novel | c.79T>C | p.Ser27Pro | p.S27P | B2RUZ4 | protein_coding | tolerated(0.29) | benign(0) | TCGA-FI-A2D5-01 | Endometrium | uterine corpus endometrioid carcinoma | Female | <65 | III/IV | Chemotherapy | carboplatinum | PD |
| Page: 1 |
Top |
Related drugs of malignant transformation related genes |
| Identification of chemicals and drugs interact with genes involved in malignant transfromation |
| (DGIdb 4.0) |
| Entrez ID | Symbol | Category | Interaction Types | Drug Claim Name | Drug Name | PMIDs |
| Page: 1 |

Copyright 2023-Present -The University of Texas Health Science Center at Houston |