
|
|||||
|
 | |
| |
| |
| |
| |
| |
|
Gene: SMG5 |
Gene summary for SMG5 |
| Gene information | Species | Human | Gene symbol | SMG5 | Gene ID | 23381 |
| Gene name | SMG5 nonsense mediated mRNA decay factor | |
| Gene Alias | EST1B | |
| Cytomap | 1q22 | |
| Gene Type | protein-coding | GO ID | GO:0000184 | UniProtAcc | Q9UPR3 |
Top |
Malignant transformation analysis |
| Identification of the aberrant gene expression in precancerous and cancerous lesions by comparing the gene expression of stem-like cells in diseased tissues with normal stem cells |
| Entrez ID | Symbol | Replicates | Species | Organ | Tissue | Adj P-value | Log2FC | Malignancy |
| 23381 | SMG5 | LZE2T | Human | Esophagus | ESCC | 6.09e-05 | 4.44e-01 | 0.082 |
| 23381 | SMG5 | LZE4T | Human | Esophagus | ESCC | 5.04e-04 | 1.32e-01 | 0.0811 |
| 23381 | SMG5 | LZE7T | Human | Esophagus | ESCC | 7.03e-12 | 5.35e-01 | 0.0667 |
| 23381 | SMG5 | LZE8T | Human | Esophagus | ESCC | 1.25e-03 | 1.08e-01 | 0.067 |
| 23381 | SMG5 | LZE20T | Human | Esophagus | ESCC | 1.01e-03 | 1.27e-01 | 0.0662 |
| 23381 | SMG5 | LZE22T | Human | Esophagus | ESCC | 2.19e-04 | 4.20e-01 | 0.068 |
| 23381 | SMG5 | LZE24T | Human | Esophagus | ESCC | 1.04e-17 | 4.25e-01 | 0.0596 |
| 23381 | SMG5 | LZE21T | Human | Esophagus | ESCC | 1.17e-07 | 3.38e-01 | 0.0655 |
| 23381 | SMG5 | LZE6T | Human | Esophagus | ESCC | 1.12e-03 | 1.18e-01 | 0.0845 |
| 23381 | SMG5 | P1T-E | Human | Esophagus | ESCC | 1.87e-09 | 4.24e-01 | 0.0875 |
| 23381 | SMG5 | P2T-E | Human | Esophagus | ESCC | 4.29e-28 | 4.14e-01 | 0.1177 |
| 23381 | SMG5 | P4T-E | Human | Esophagus | ESCC | 1.51e-09 | 2.46e-01 | 0.1323 |
| 23381 | SMG5 | P5T-E | Human | Esophagus | ESCC | 3.25e-27 | 4.35e-01 | 0.1327 |
| 23381 | SMG5 | P8T-E | Human | Esophagus | ESCC | 3.30e-20 | 3.25e-01 | 0.0889 |
| 23381 | SMG5 | P9T-E | Human | Esophagus | ESCC | 4.69e-22 | 4.46e-01 | 0.1131 |
| 23381 | SMG5 | P10T-E | Human | Esophagus | ESCC | 2.15e-31 | 5.31e-01 | 0.116 |
| 23381 | SMG5 | P11T-E | Human | Esophagus | ESCC | 1.04e-14 | 5.15e-01 | 0.1426 |
| 23381 | SMG5 | P12T-E | Human | Esophagus | ESCC | 4.27e-27 | 2.61e-01 | 0.1122 |
| 23381 | SMG5 | P15T-E | Human | Esophagus | ESCC | 5.01e-30 | 5.04e-01 | 0.1149 |
| 23381 | SMG5 | P16T-E | Human | Esophagus | ESCC | 3.36e-19 | 3.40e-01 | 0.1153 |
| Page: 1 2 3 4 5 |
| Tissue | Expression Dynamics | Abbreviation |
| Esophagus | 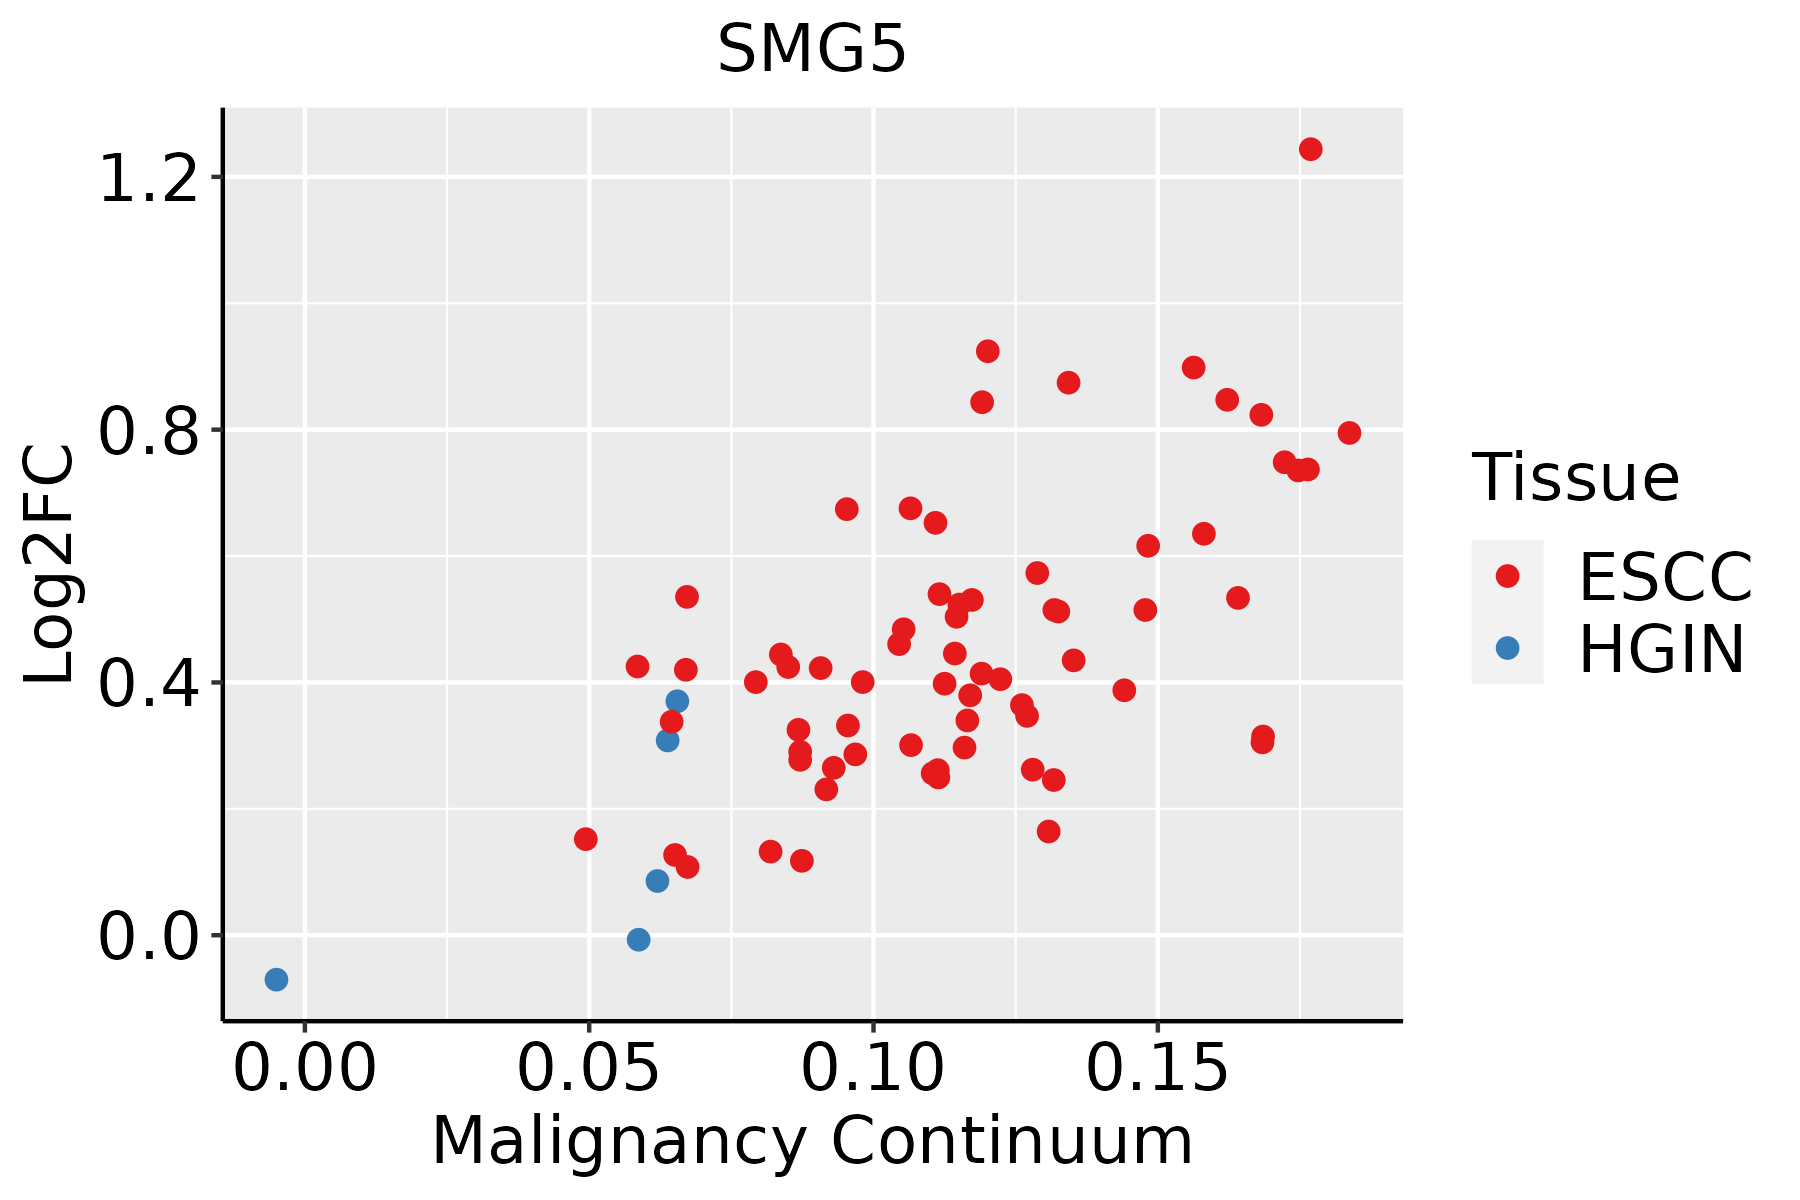 | ESCC: Esophageal squamous cell carcinoma |
| HGIN: High-grade intraepithelial neoplasias | ||
| LGIN: Low-grade intraepithelial neoplasias | ||
| Liver | 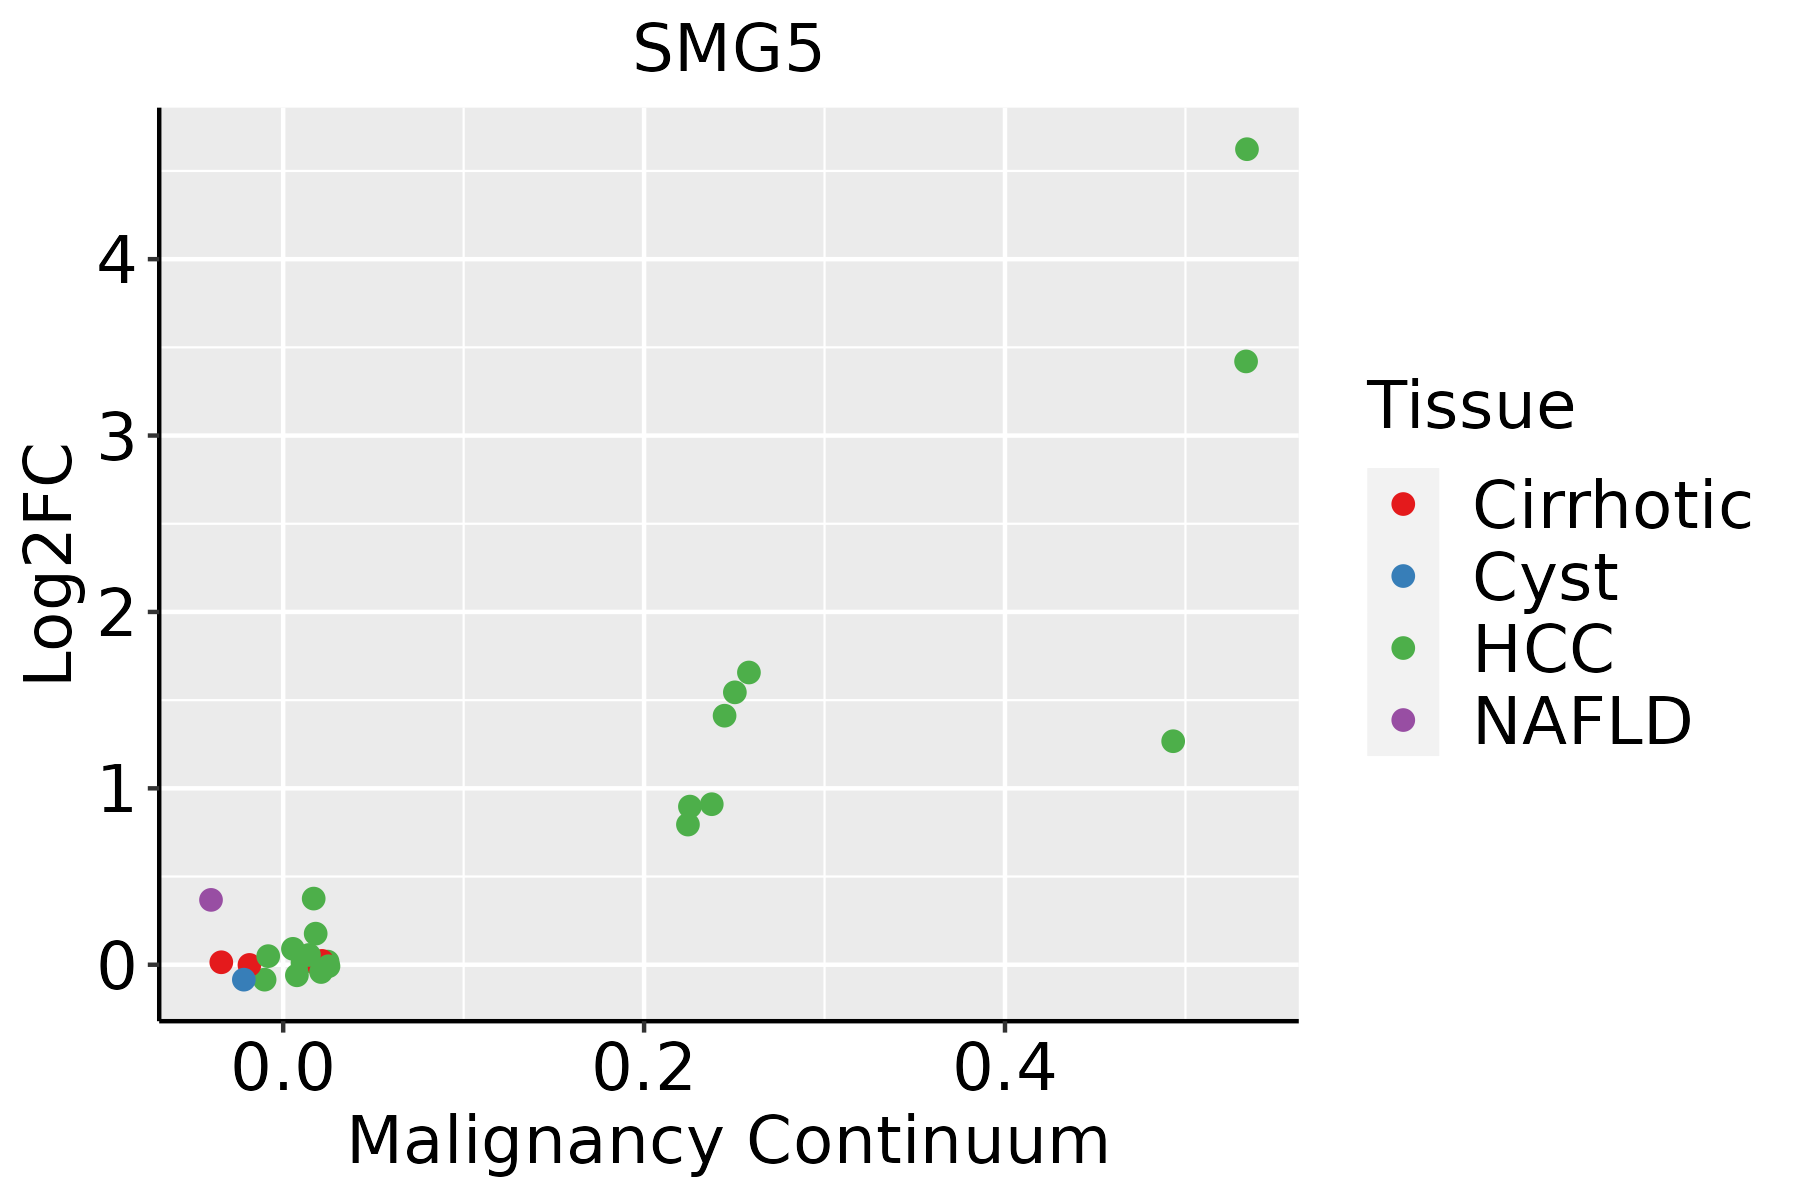 | HCC: Hepatocellular carcinoma |
| NAFLD: Non-alcoholic fatty liver disease | ||
| Oral Cavity |  | EOLP: Erosive Oral lichen planus |
| LP: leukoplakia | ||
| NEOLP: Non-erosive oral lichen planus | ||
| OSCC: Oral squamous cell carcinoma |
| ∗log2FC in expression of this searched gene in stem-like cells from each diseased tissue sample relative to stem-like cells in normal samples in each tissue plotted against the malignancy continuum. Samples are colored based on if they are from different disease stage. |
Top |
Malignant transformation related pathway analysis |
| Find out the enriched GO biological processes and KEGG pathways involved in transition from healthy to precancer to cancer |
| Tissue | Disease Stage | Enriched GO biological Processes |
| Colorectum | AD |  |
| Colorectum | SER |  |
| Colorectum | MSS |  |
| Colorectum | MSI-H |  |
| Colorectum | FAP |  |
| ∗Top 15 enriched GO BP terms are showed in the bar plot of each disease state in each tissue. Each row represents a significant GO biological process which is colored according to the -log10(p.adjust). |
| Page: 1 2 3 4 5 6 7 8 9 |
| GO ID | Tissue | Disease Stage | Description | Gene Ratio | Bg Ratio | pvalue | p.adjust | Count |
| GO:0006913110 | Esophagus | ESCC | nucleocytoplasmic transport | 230/8552 | 301/18723 | 6.04e-28 | 2.02e-25 | 230 |
| GO:0051169110 | Esophagus | ESCC | nuclear transport | 230/8552 | 301/18723 | 6.04e-28 | 2.02e-25 | 230 |
| GO:0006403110 | Esophagus | ESCC | RNA localization | 166/8552 | 201/18723 | 1.95e-27 | 6.18e-25 | 166 |
| GO:0006401110 | Esophagus | ESCC | RNA catabolic process | 204/8552 | 278/18723 | 3.39e-21 | 5.66e-19 | 204 |
| GO:005123617 | Esophagus | ESCC | establishment of RNA localization | 134/8552 | 166/18723 | 1.23e-20 | 1.81e-18 | 134 |
| GO:0051168110 | Esophagus | ESCC | nuclear export | 126/8552 | 154/18723 | 1.88e-20 | 2.65e-18 | 126 |
| GO:005102815 | Esophagus | ESCC | mRNA transport | 110/8552 | 130/18723 | 2.76e-20 | 3.80e-18 | 110 |
| GO:005065717 | Esophagus | ESCC | nucleic acid transport | 131/8552 | 163/18723 | 6.94e-20 | 8.46e-18 | 131 |
| GO:005065817 | Esophagus | ESCC | RNA transport | 131/8552 | 163/18723 | 6.94e-20 | 8.46e-18 | 131 |
| GO:003304416 | Esophagus | ESCC | regulation of chromosome organization | 145/8552 | 187/18723 | 3.80e-19 | 4.31e-17 | 145 |
| GO:0034655110 | Esophagus | ESCC | nucleobase-containing compound catabolic process | 272/8552 | 407/18723 | 2.92e-18 | 2.90e-16 | 272 |
| GO:0006402110 | Esophagus | ESCC | mRNA catabolic process | 170/8552 | 232/18723 | 8.70e-18 | 8.00e-16 | 170 |
| GO:001593117 | Esophagus | ESCC | nucleobase-containing compound transport | 162/8552 | 222/18723 | 9.87e-17 | 7.93e-15 | 162 |
| GO:004670018 | Esophagus | ESCC | heterocycle catabolic process | 286/8552 | 445/18723 | 1.12e-15 | 7.47e-14 | 286 |
| GO:004427019 | Esophagus | ESCC | cellular nitrogen compound catabolic process | 288/8552 | 451/18723 | 3.03e-15 | 1.79e-13 | 288 |
| GO:001943918 | Esophagus | ESCC | aromatic compound catabolic process | 295/8552 | 467/18723 | 1.09e-14 | 5.98e-13 | 295 |
| GO:190136118 | Esophagus | ESCC | organic cyclic compound catabolic process | 307/8552 | 495/18723 | 9.99e-14 | 4.80e-12 | 307 |
| GO:005105215 | Esophagus | ESCC | regulation of DNA metabolic process | 232/8552 | 359/18723 | 2.40e-13 | 1.13e-11 | 232 |
| GO:007116612 | Esophagus | ESCC | ribonucleoprotein complex localization | 66/8552 | 77/18723 | 2.94e-13 | 1.38e-11 | 66 |
| GO:007142612 | Esophagus | ESCC | ribonucleoprotein complex export from nucleus | 65/8552 | 76/18723 | 5.56e-13 | 2.50e-11 | 65 |
| Page: 1 2 3 4 5 6 7 8 |
| Pathway ID | Tissue | Disease Stage | Description | Gene Ratio | Bg Ratio | pvalue | p.adjust | qvalue | Count |
| hsa0301524 | Esophagus | ESCC | mRNA surveillance pathway | 72/4205 | 97/8465 | 6.12e-07 | 4.10e-06 | 2.10e-06 | 72 |
| hsa0301534 | Esophagus | ESCC | mRNA surveillance pathway | 72/4205 | 97/8465 | 6.12e-07 | 4.10e-06 | 2.10e-06 | 72 |
| hsa0301521 | Liver | HCC | mRNA surveillance pathway | 66/4020 | 97/8465 | 3.16e-05 | 1.88e-04 | 1.04e-04 | 66 |
| hsa0301531 | Liver | HCC | mRNA surveillance pathway | 66/4020 | 97/8465 | 3.16e-05 | 1.88e-04 | 1.04e-04 | 66 |
| hsa030158 | Oral cavity | OSCC | mRNA surveillance pathway | 75/3704 | 97/8465 | 1.30e-11 | 2.01e-10 | 1.02e-10 | 75 |
| hsa0301513 | Oral cavity | OSCC | mRNA surveillance pathway | 75/3704 | 97/8465 | 1.30e-11 | 2.01e-10 | 1.02e-10 | 75 |
| hsa0301523 | Oral cavity | LP | mRNA surveillance pathway | 50/2418 | 97/8465 | 1.39e-06 | 1.50e-05 | 9.66e-06 | 50 |
| hsa0301533 | Oral cavity | LP | mRNA surveillance pathway | 50/2418 | 97/8465 | 1.39e-06 | 1.50e-05 | 9.66e-06 | 50 |
| Page: 1 |
Top |
Cell-cell communication analysis |
| Identification of potential cell-cell interactions between two cell types and their ligand-receptor pairs for different disease states |
| Ligand | Receptor | LRpair | Pathway | Tissue | Disease Stage |
| Page: 1 |
Top |
Single-cell gene regulatory network inference analysis |
| Find out the significant the regulons (TFs) and the target genes of each regulon across cell types for different disease states |
| TF | Cell Type | Tissue | Disease Stage | Target Gene | RSS | Regulon Activity |
| ∗The dot plots of a searched regulon are shown for all cell subpopulations in each disease state of each tissue based on the regulon specific score inferred using pySCENIC and by calculating the average expression. |
| Page: 1 |
Top |
Somatic mutation of malignant transformation related genes |
| Annotation of somatic variants for genes involved in malignant transformation |
| Hugo Symbol | Variant Class | Variant Classification | dbSNP RS | HGVSc | HGVSp | HGVSp Short | SWISSPROT | BIOTYPE | SIFT | PolyPhen | Tumor Sample Barcode | Tissue | Histology | Sex | Age | Stage | Therapy Types | Drugs | Outcome |
| SMG5 | SNV | Missense_Mutation | c.235G>C | p.Glu79Gln | p.E79Q | Q9UPR3 | protein_coding | deleterious(0) | probably_damaging(1) | TCGA-AC-A23H-01 | Breast | breast invasive carcinoma | Female | >=65 | I/II | Unknown | Unknown | PD | |
| SMG5 | SNV | Missense_Mutation | novel | c.1798N>C | p.Thr600Pro | p.T600P | Q9UPR3 | protein_coding | tolerated(0.58) | benign(0) | TCGA-AR-A24O-01 | Breast | breast invasive carcinoma | Female | <65 | III/IV | Chemotherapy | cytoxan | PD |
| SMG5 | SNV | Missense_Mutation | novel | c.1291N>A | p.Glu431Lys | p.E431K | Q9UPR3 | protein_coding | tolerated(0.4) | benign(0) | TCGA-BH-A0HP-01 | Breast | breast invasive carcinoma | Female | >=65 | III/IV | Chemotherapy | doxorubicin | SD |
| SMG5 | SNV | Missense_Mutation | c.842N>A | p.Cys281Tyr | p.C281Y | Q9UPR3 | protein_coding | tolerated(0.08) | possibly_damaging(0.53) | TCGA-BH-A202-01 | Breast | breast invasive carcinoma | Female | <65 | I/II | Chemotherapy | carboplatin | CR | |
| SMG5 | SNV | Missense_Mutation | c.1225N>G | p.Pro409Ala | p.P409A | Q9UPR3 | protein_coding | tolerated(0.12) | benign(0.338) | TCGA-C8-A134-01 | Breast | breast invasive carcinoma | Female | <65 | I/II | Chemotherapy | 5-fluorouracil | CR | |
| SMG5 | SNV | Missense_Mutation | c.1310N>A | p.Pro437His | p.P437H | Q9UPR3 | protein_coding | tolerated(0.12) | possibly_damaging(0.541) | TCGA-C8-A27B-01 | Breast | breast invasive carcinoma | Female | <65 | I/II | Chemotherapy | 5-fluorouracil | CR | |
| SMG5 | SNV | Missense_Mutation | novel | c.665C>A | p.Ala222Glu | p.A222E | Q9UPR3 | protein_coding | deleterious(0.01) | possibly_damaging(0.9) | TCGA-D8-A27M-01 | Breast | breast invasive carcinoma | Female | <65 | I/II | Chemotherapy | methotrexate+5 | SD |
| SMG5 | SNV | Missense_Mutation | novel | c.1204N>C | p.Glu402Gln | p.E402Q | Q9UPR3 | protein_coding | deleterious(0.01) | possibly_damaging(0.905) | TCGA-D8-A73U-01 | Breast | breast invasive carcinoma | Female | >=65 | I/II | Hormone Therapy | tamoxiphen | SD |
| SMG5 | SNV | Missense_Mutation | rs866820693 | c.839N>A | p.Arg280Gln | p.R280Q | Q9UPR3 | protein_coding | tolerated(0.36) | benign(0.121) | TCGA-EW-A1IW-01 | Breast | breast invasive carcinoma | Female | >=65 | I/II | Hormone Therapy | aromasin | SD |
| SMG5 | insertion | Frame_Shift_Ins | novel | c.1356_1357insGCTAATTTTTGTATTTTTAGTAGAGA | p.Phe453AlafsTer31 | p.F453Afs*31 | Q9UPR3 | protein_coding | TCGA-BH-A0HF-01 | Breast | breast invasive carcinoma | Female | >=65 | I/II | Hormone Therapy | arimidex | SD |
| Page: 1 2 3 4 5 6 7 8 9 10 11 |
Top |
Related drugs of malignant transformation related genes |
| Identification of chemicals and drugs interact with genes involved in malignant transfromation |
| (DGIdb 4.0) |
| Entrez ID | Symbol | Category | Interaction Types | Drug Claim Name | Drug Name | PMIDs |
| Page: 1 |

Copyright 2023-Present -The University of Texas Health Science Center at Houston |