| Tissue | Expression Dynamics | Abbreviation |
| Cervix | 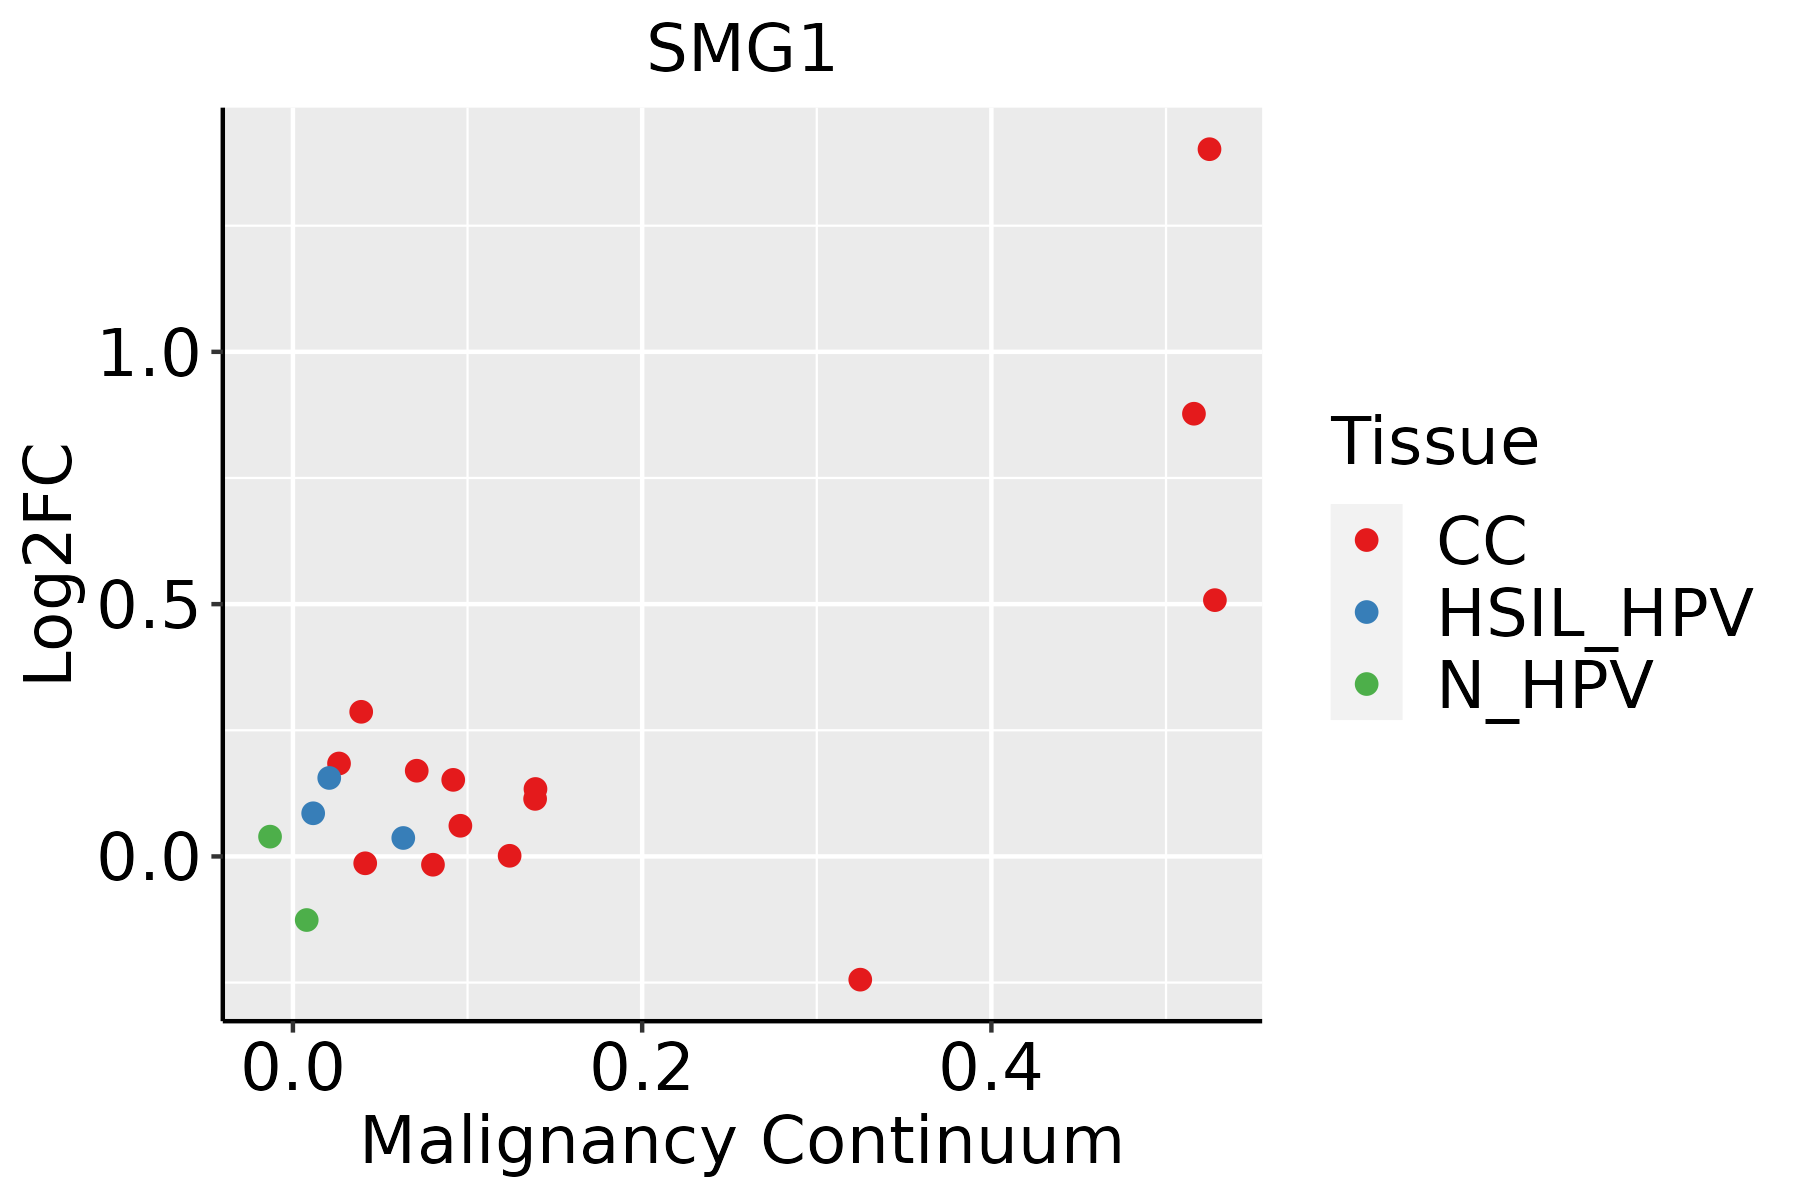 | CC: Cervix cancer |
| HSIL_HPV: HPV-infected high-grade squamous intraepithelial lesions |
| N_HPV: HPV-infected normal cervix |
| Colorectum (GSE201348) |  | FAP: Familial adenomatous polyposis |
| CRC: Colorectal cancer |
| Colorectum (HTA11) |  | AD: Adenomas |
| SER: Sessile serrated lesions |
| MSI-H: Microsatellite-high colorectal cancer |
| MSS: Microsatellite stable colorectal cancer |
| Esophagus | 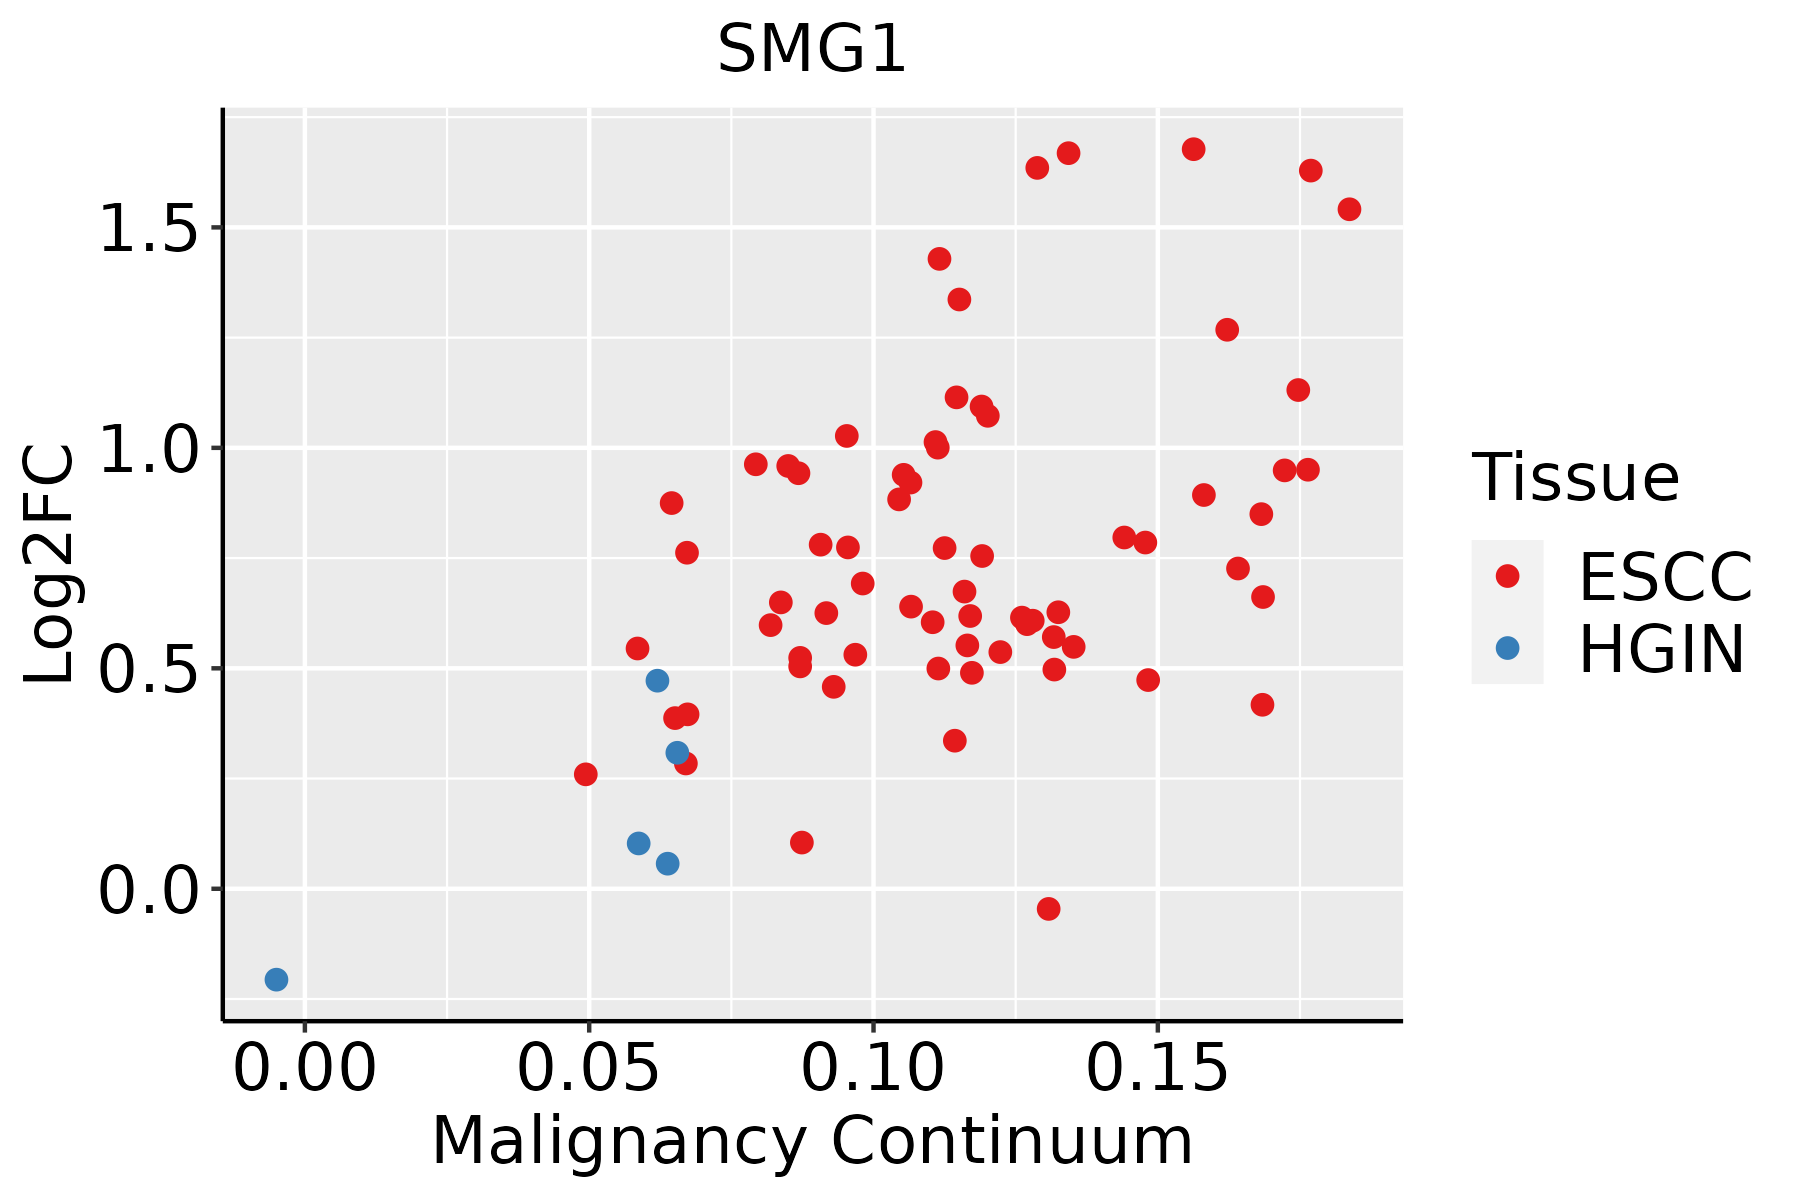 | ESCC: Esophageal squamous cell carcinoma |
| HGIN: High-grade intraepithelial neoplasias |
| LGIN: Low-grade intraepithelial neoplasias |
| Liver | 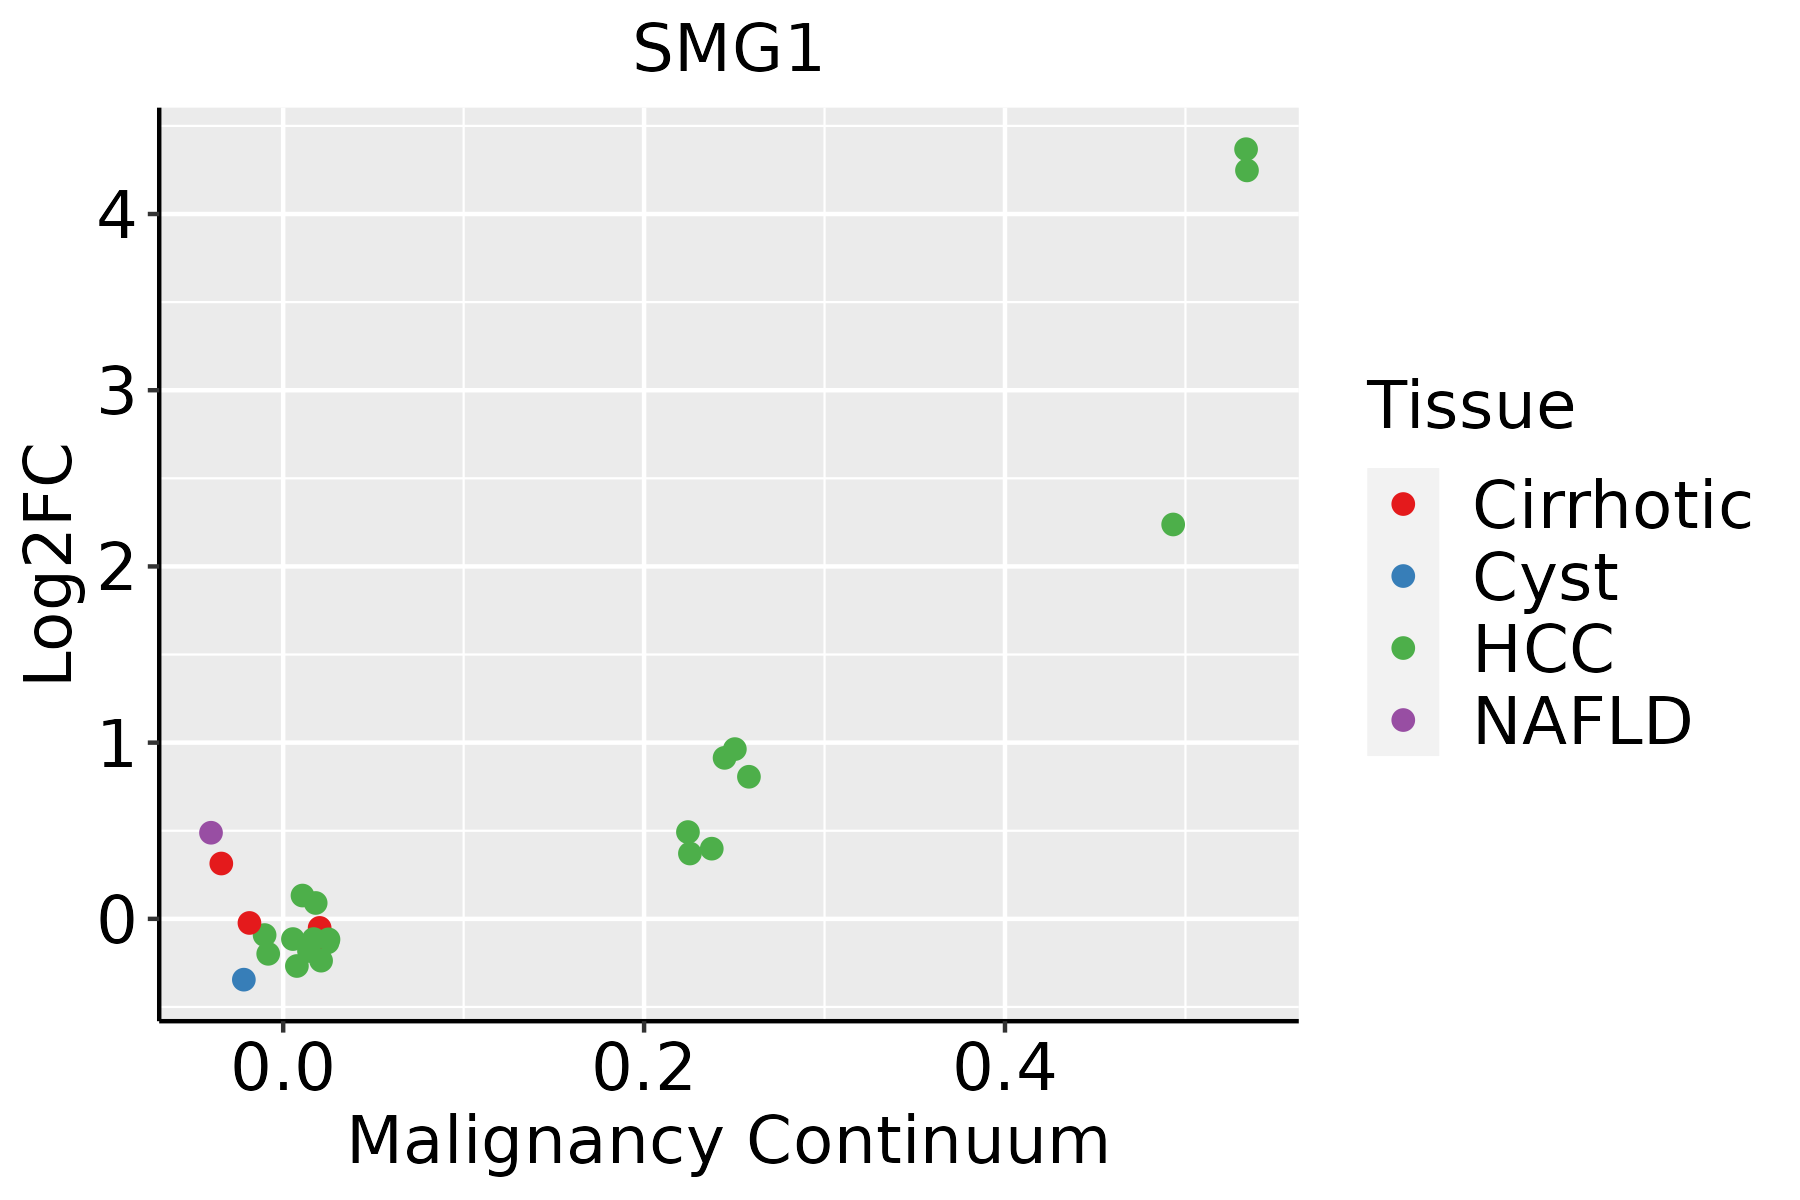 | HCC: Hepatocellular carcinoma |
| NAFLD: Non-alcoholic fatty liver disease |
| Oral Cavity | 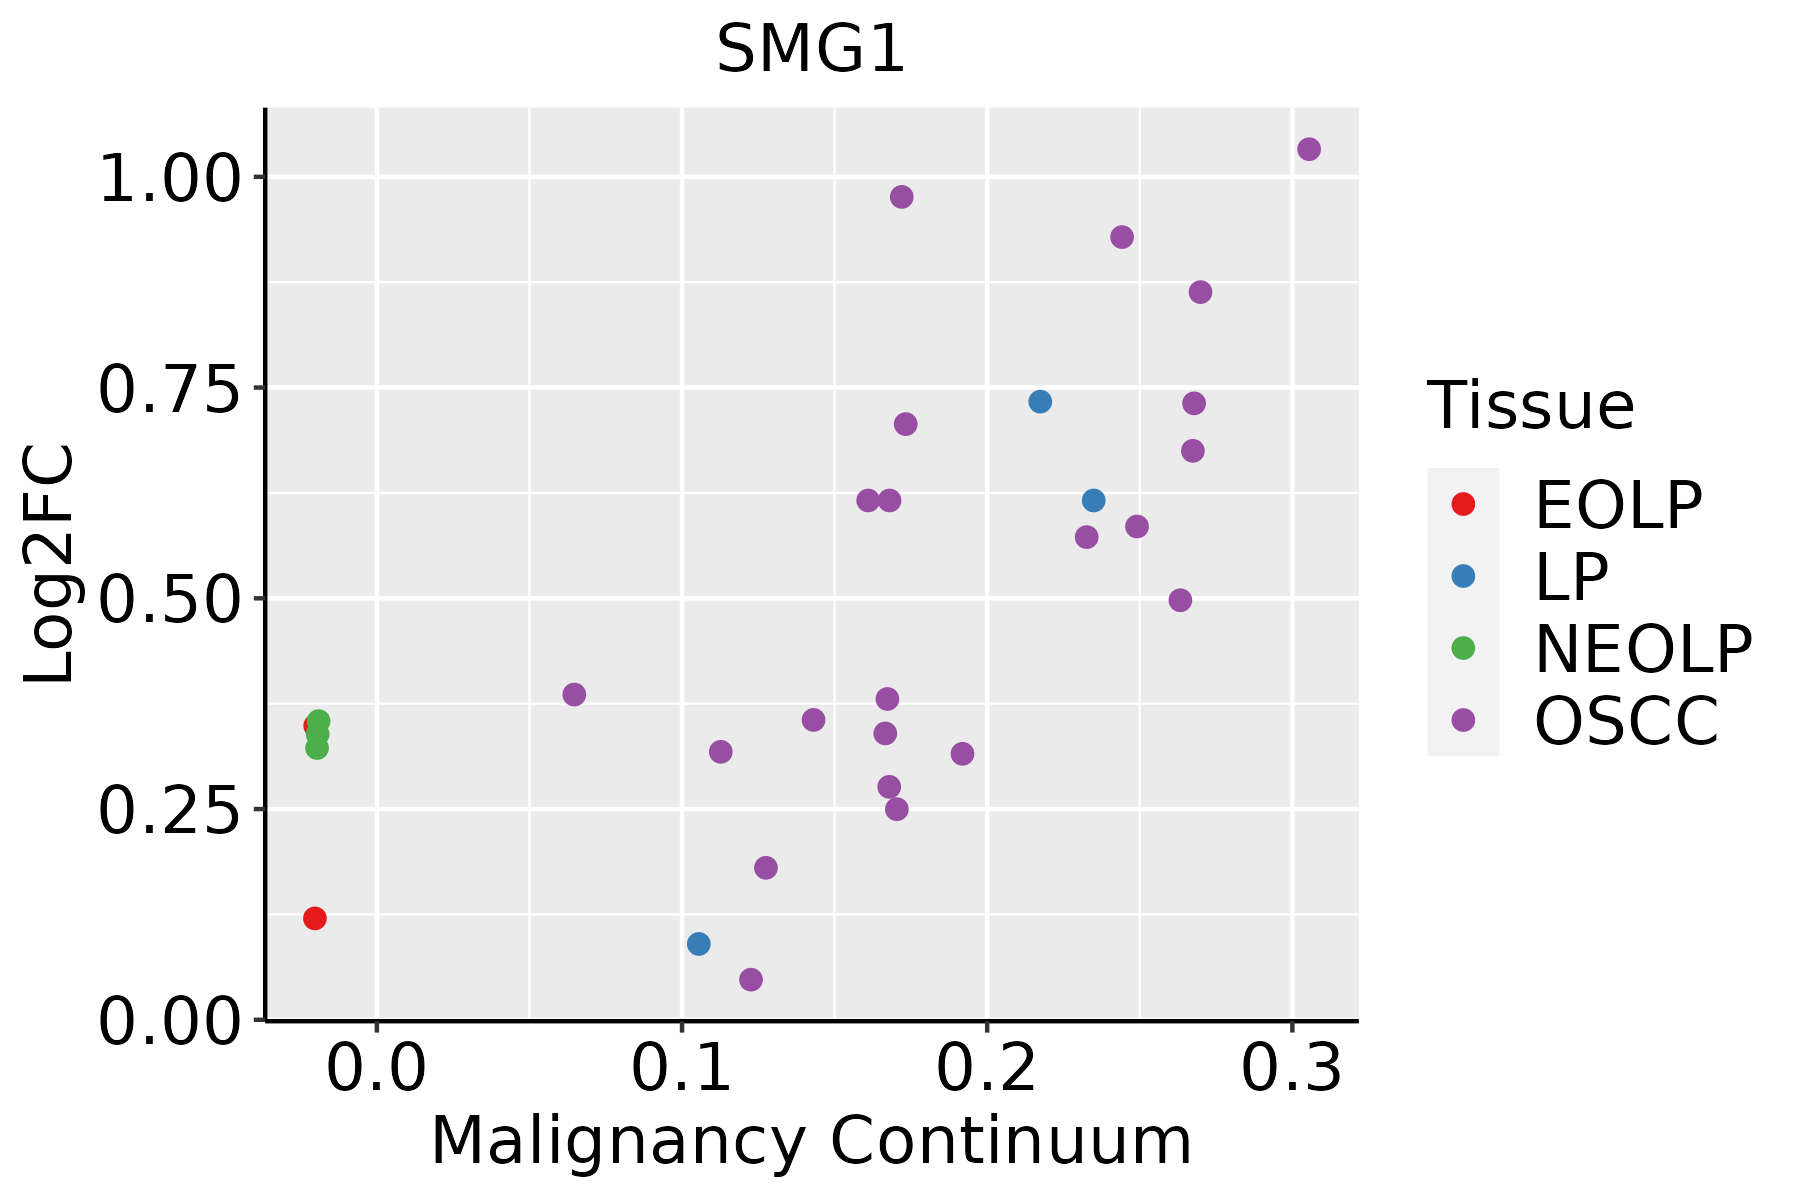 | EOLP: Erosive Oral lichen planus |
| LP: leukoplakia |
| NEOLP: Non-erosive oral lichen planus |
| OSCC: Oral squamous cell carcinoma |
| Prostate | 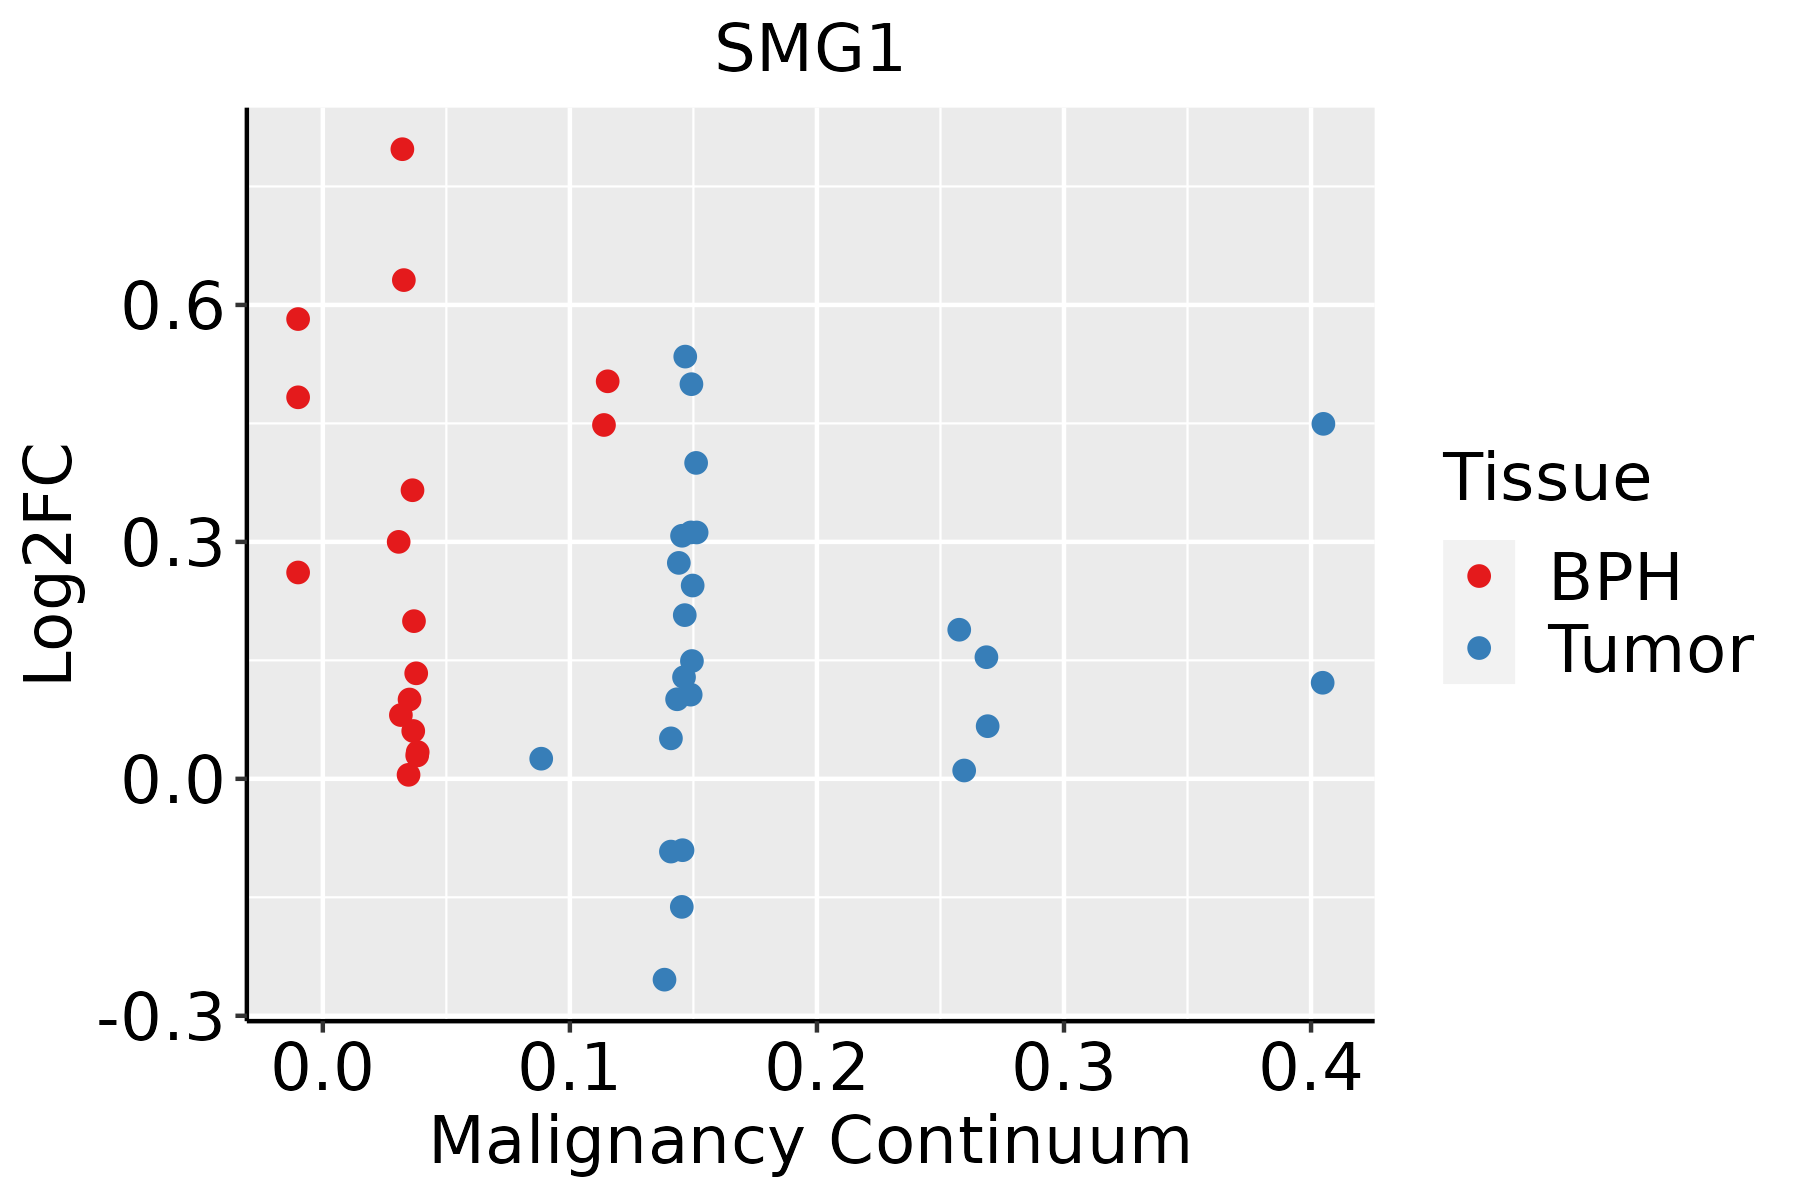 | BPH: Benign Prostatic Hyperplasia |
| Skin | 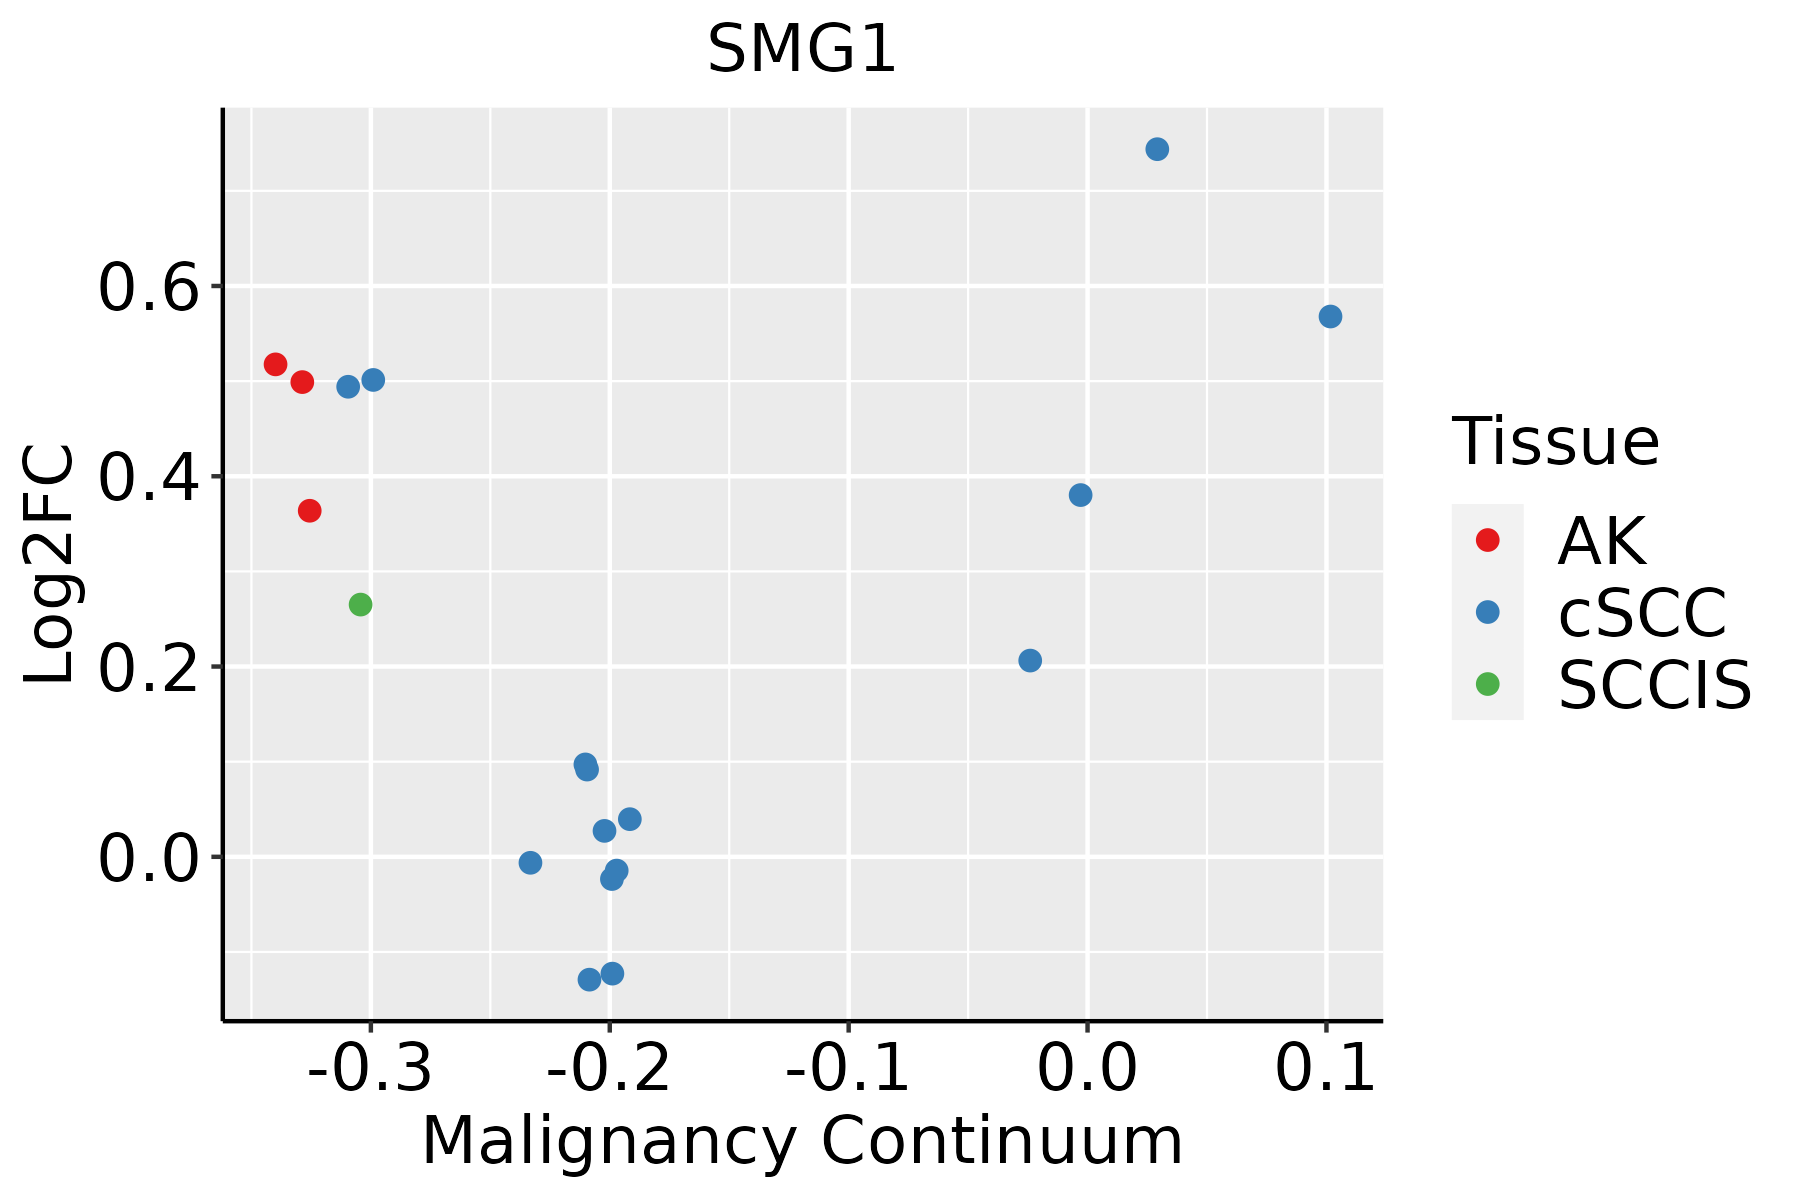 | AK: Actinic keratosis |
| cSCC: Cutaneous squamous cell carcinoma |
| SCCIS:squamous cell carcinoma in situ |
| Thyroid | 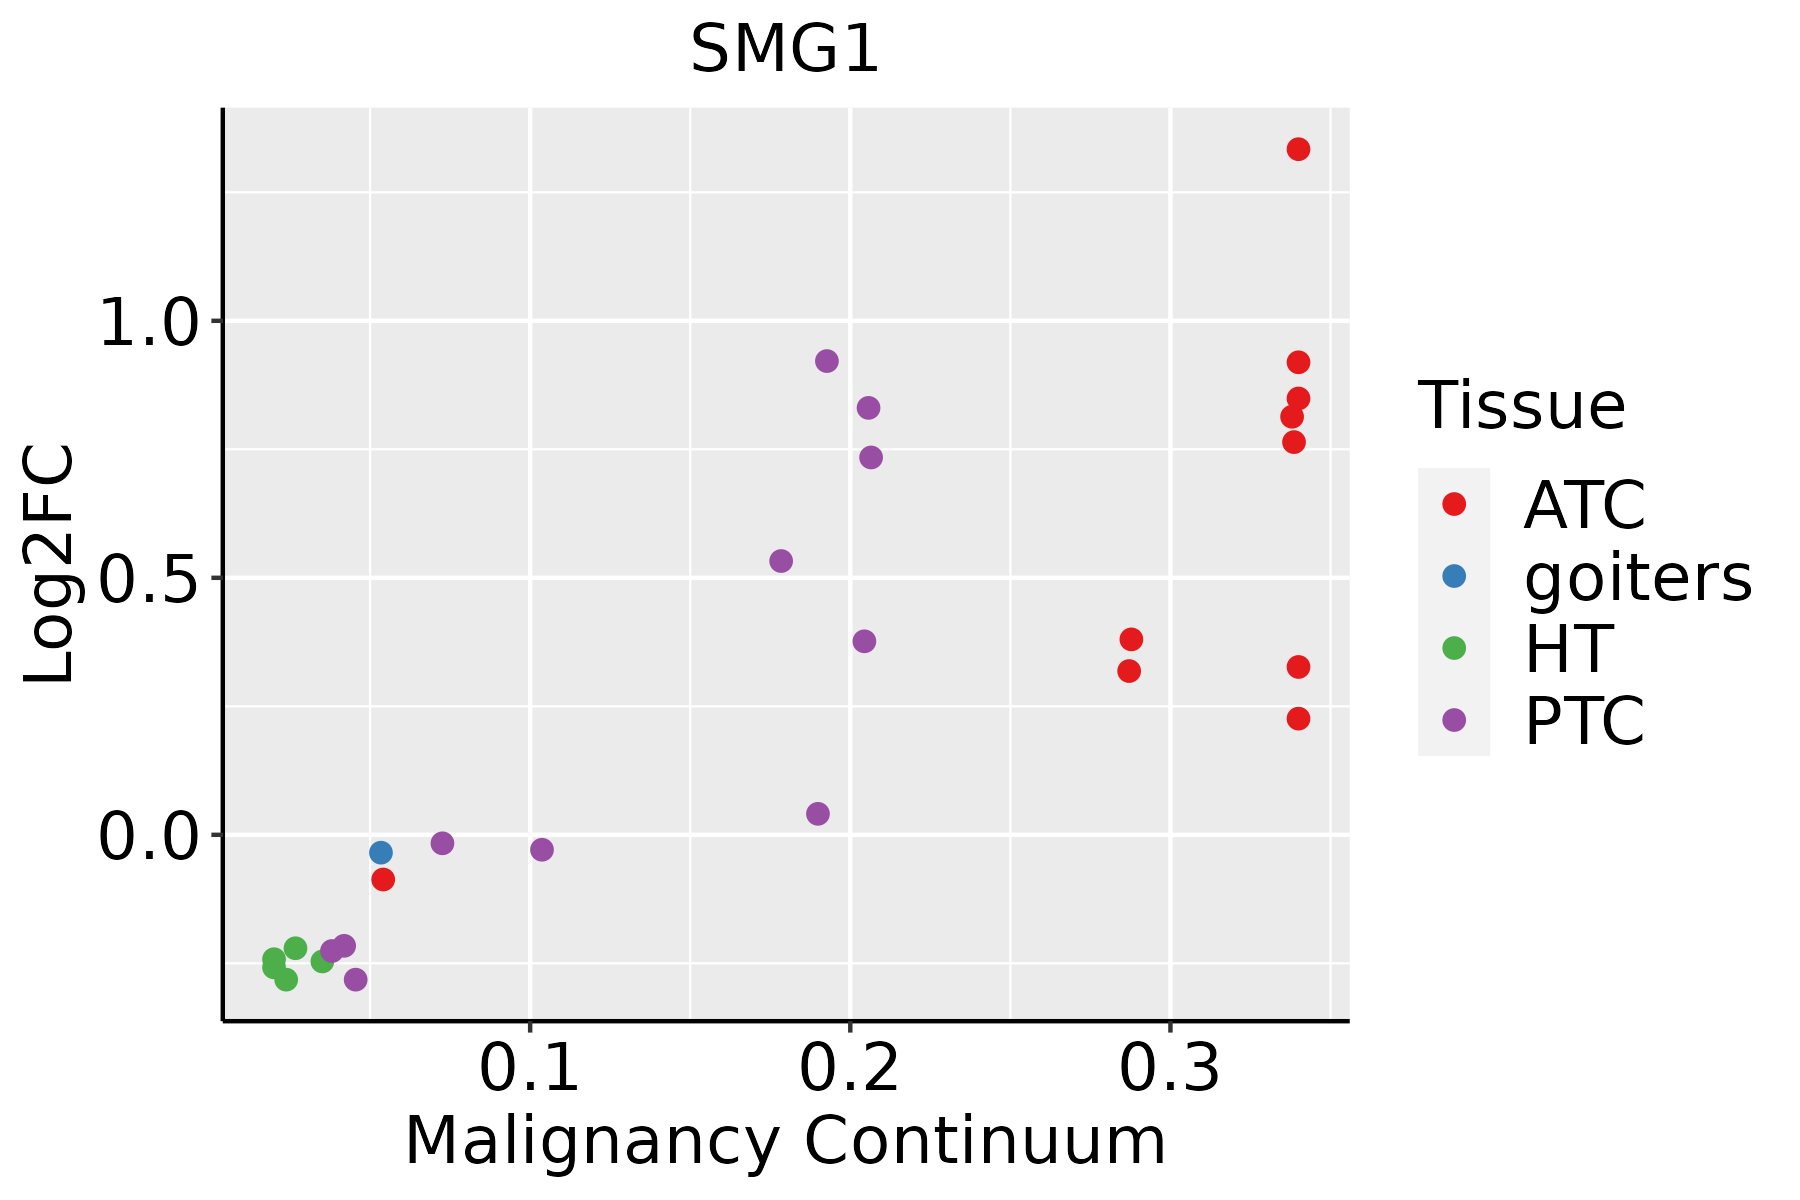 | ATC: Anaplastic thyroid cancer |
| HT: Hashimoto's thyroiditis |
| PTC: Papillary thyroid cancer |
| GO ID | Tissue | Disease Stage | Description | Gene Ratio | Bg Ratio | pvalue | p.adjust | Count |
| GO:00069139 | Cervix | CC | nucleocytoplasmic transport | 71/2311 | 301/18723 | 4.04e-08 | 2.54e-06 | 71 |
| GO:00511699 | Cervix | CC | nuclear transport | 71/2311 | 301/18723 | 4.04e-08 | 2.54e-06 | 71 |
| GO:003133010 | Cervix | CC | negative regulation of cellular catabolic process | 63/2311 | 262/18723 | 1.10e-07 | 5.68e-06 | 63 |
| GO:00064029 | Cervix | CC | mRNA catabolic process | 56/2311 | 232/18723 | 4.81e-07 | 1.83e-05 | 56 |
| GO:000989510 | Cervix | CC | negative regulation of catabolic process | 69/2311 | 320/18723 | 2.15e-06 | 6.55e-05 | 69 |
| GO:00064019 | Cervix | CC | RNA catabolic process | 62/2311 | 278/18723 | 2.18e-06 | 6.56e-05 | 62 |
| GO:00511689 | Cervix | CC | nuclear export | 38/2311 | 154/18723 | 1.86e-05 | 3.46e-04 | 38 |
| GO:00009567 | Cervix | CC | nuclear-transcribed mRNA catabolic process | 30/2311 | 112/18723 | 2.60e-05 | 4.37e-04 | 30 |
| GO:00512368 | Cervix | CC | establishment of RNA localization | 39/2311 | 166/18723 | 4.76e-05 | 7.25e-04 | 39 |
| GO:00181057 | Cervix | CC | peptidyl-serine phosphorylation | 63/2311 | 315/18723 | 6.65e-05 | 9.47e-04 | 63 |
| GO:00506578 | Cervix | CC | nucleic acid transport | 38/2311 | 163/18723 | 7.06e-05 | 9.85e-04 | 38 |
| GO:00506588 | Cervix | CC | RNA transport | 38/2311 | 163/18723 | 7.06e-05 | 9.85e-04 | 38 |
| GO:00182096 | Cervix | CC | peptidyl-serine modification | 66/2311 | 338/18723 | 9.58e-05 | 1.25e-03 | 66 |
| GO:00162367 | Cervix | CC | macroautophagy | 58/2311 | 291/18723 | 1.40e-04 | 1.70e-03 | 58 |
| GO:20010209 | Cervix | CC | regulation of response to DNA damage stimulus | 46/2311 | 219/18723 | 1.92e-04 | 2.23e-03 | 46 |
| GO:000640310 | Cervix | CC | RNA localization | 43/2311 | 201/18723 | 2.00e-04 | 2.29e-03 | 43 |
| GO:00510284 | Cervix | CC | mRNA transport | 31/2311 | 130/18723 | 2.05e-04 | 2.33e-03 | 31 |
| GO:00105067 | Cervix | CC | regulation of autophagy | 61/2311 | 317/18723 | 2.61e-04 | 2.87e-03 | 61 |
| GO:00467008 | Cervix | CC | heterocycle catabolic process | 80/2311 | 445/18723 | 3.23e-04 | 3.42e-03 | 80 |
| GO:00346559 | Cervix | CC | nucleobase-containing compound catabolic process | 74/2311 | 407/18723 | 3.77e-04 | 3.88e-03 | 74 |
| Pathway ID | Tissue | Disease Stage | Description | Gene Ratio | Bg Ratio | pvalue | p.adjust | qvalue | Count |
| hsa03015 | Colorectum | AD | mRNA surveillance pathway | 35/2092 | 97/8465 | 7.95e-03 | 3.13e-02 | 2.00e-02 | 35 |
| hsa030151 | Colorectum | AD | mRNA surveillance pathway | 35/2092 | 97/8465 | 7.95e-03 | 3.13e-02 | 2.00e-02 | 35 |
| hsa030152 | Colorectum | FAP | mRNA surveillance pathway | 26/1404 | 97/8465 | 7.11e-03 | 2.64e-02 | 1.60e-02 | 26 |
| hsa030153 | Colorectum | FAP | mRNA surveillance pathway | 26/1404 | 97/8465 | 7.11e-03 | 2.64e-02 | 1.60e-02 | 26 |
| hsa030159 | Esophagus | HGIN | mRNA surveillance pathway | 30/1383 | 97/8465 | 2.48e-04 | 2.69e-03 | 2.14e-03 | 30 |
| hsa0301514 | Esophagus | HGIN | mRNA surveillance pathway | 30/1383 | 97/8465 | 2.48e-04 | 2.69e-03 | 2.14e-03 | 30 |
| hsa0301524 | Esophagus | ESCC | mRNA surveillance pathway | 72/4205 | 97/8465 | 6.12e-07 | 4.10e-06 | 2.10e-06 | 72 |
| hsa0301534 | Esophagus | ESCC | mRNA surveillance pathway | 72/4205 | 97/8465 | 6.12e-07 | 4.10e-06 | 2.10e-06 | 72 |
| hsa030154 | Liver | Cirrhotic | mRNA surveillance pathway | 46/2530 | 97/8465 | 1.92e-04 | 1.30e-03 | 8.03e-04 | 46 |
| hsa0301511 | Liver | Cirrhotic | mRNA surveillance pathway | 46/2530 | 97/8465 | 1.92e-04 | 1.30e-03 | 8.03e-04 | 46 |
| hsa0301521 | Liver | HCC | mRNA surveillance pathway | 66/4020 | 97/8465 | 3.16e-05 | 1.88e-04 | 1.04e-04 | 66 |
| hsa0301531 | Liver | HCC | mRNA surveillance pathway | 66/4020 | 97/8465 | 3.16e-05 | 1.88e-04 | 1.04e-04 | 66 |
| hsa030158 | Oral cavity | OSCC | mRNA surveillance pathway | 75/3704 | 97/8465 | 1.30e-11 | 2.01e-10 | 1.02e-10 | 75 |
| hsa0301513 | Oral cavity | OSCC | mRNA surveillance pathway | 75/3704 | 97/8465 | 1.30e-11 | 2.01e-10 | 1.02e-10 | 75 |
| hsa0301541 | Oral cavity | EOLP | mRNA surveillance pathway | 30/1218 | 97/8465 | 2.26e-05 | 1.20e-04 | 7.07e-05 | 30 |
| hsa0301551 | Oral cavity | EOLP | mRNA surveillance pathway | 30/1218 | 97/8465 | 2.26e-05 | 1.20e-04 | 7.07e-05 | 30 |
| hsa030156 | Oral cavity | NEOLP | mRNA surveillance pathway | 25/1112 | 97/8465 | 5.70e-04 | 3.18e-03 | 2.00e-03 | 25 |
| hsa030157 | Oral cavity | NEOLP | mRNA surveillance pathway | 25/1112 | 97/8465 | 5.70e-04 | 3.18e-03 | 2.00e-03 | 25 |
| hsa030155 | Prostate | BPH | mRNA surveillance pathway | 32/1718 | 97/8465 | 2.20e-03 | 8.63e-03 | 5.34e-03 | 32 |
| hsa0301512 | Prostate | BPH | mRNA surveillance pathway | 32/1718 | 97/8465 | 2.20e-03 | 8.63e-03 | 5.34e-03 | 32 |
| Hugo Symbol | Variant Class | Variant Classification | dbSNP RS | HGVSc | HGVSp | HGVSp Short | SWISSPROT | BIOTYPE | SIFT | PolyPhen | Tumor Sample Barcode | Tissue | Histology | Sex | Age | Stage | Therapy Types | Drugs | Outcome |
| SMG1 | SNV | Missense_Mutation | rs765439624 | c.9530N>A | p.Arg3177Gln | p.R3177Q | Q96Q15 | protein_coding | deleterious(0.04) | probably_damaging(0.968) | TCGA-A2-A0CX-01 | Breast | breast invasive carcinoma | Female | <65 | I/II | Chemotherapy | adriamycin | SD |
| SMG1 | SNV | Missense_Mutation | | c.4179N>T | p.Trp1393Cys | p.W1393C | Q96Q15 | protein_coding | tolerated(0.13) | possibly_damaging(0.57) | TCGA-A2-A0T0-01 | Breast | breast invasive carcinoma | Female | <65 | I/II | Chemotherapy | taxotere | SD |
| SMG1 | SNV | Missense_Mutation | novel | c.1085G>T | p.Gly362Val | p.G362V | Q96Q15 | protein_coding | deleterious(0) | probably_damaging(0.998) | TCGA-A7-A0DB-01 | Breast | breast invasive carcinoma | Female | <65 | I/II | Hormone Therapy | arimidex | SD |
| SMG1 | SNV | Missense_Mutation | | c.8098N>C | p.Cys2700Arg | p.C2700R | Q96Q15 | protein_coding | deleterious(0.03) | probably_damaging(0.986) | TCGA-A8-A08R-01 | Breast | breast invasive carcinoma | Female | <65 | I/II | Unknown | Unknown | SD |
| SMG1 | SNV | Missense_Mutation | | c.10651N>G | p.Gln3551Glu | p.Q3551E | Q96Q15 | protein_coding | tolerated(0.63) | benign(0.351) | TCGA-AC-A23H-01 | Breast | breast invasive carcinoma | Female | >=65 | I/II | Unknown | Unknown | PD |
| SMG1 | SNV | Missense_Mutation | | c.8524N>A | p.Glu2842Lys | p.E2842K | Q96Q15 | protein_coding | tolerated(0.52) | benign(0.017) | TCGA-AC-A23H-01 | Breast | breast invasive carcinoma | Female | >=65 | I/II | Unknown | Unknown | PD |
| SMG1 | SNV | Missense_Mutation | novel | c.6106N>T | p.His2036Tyr | p.H2036Y | Q96Q15 | protein_coding | deleterious(0) | probably_damaging(0.954) | TCGA-AC-A6IW-01 | Breast | breast invasive carcinoma | Female | >=65 | I/II | Unknown | Unknown | SD |
| SMG1 | SNV | Missense_Mutation | novel | c.7979G>A | p.Arg2660Gln | p.R2660Q | Q96Q15 | protein_coding | deleterious(0) | probably_damaging(0.968) | TCGA-AN-A046-01 | Breast | breast invasive carcinoma | Female | >=65 | I/II | Unknown | Unknown | SD |
| SMG1 | SNV | Missense_Mutation | novel | c.4614G>T | p.Glu1538Asp | p.E1538D | Q96Q15 | protein_coding | tolerated(0.99) | benign(0) | TCGA-AN-A046-01 | Breast | breast invasive carcinoma | Female | >=65 | I/II | Unknown | Unknown | SD |
| SMG1 | SNV | Missense_Mutation | novel | c.5767N>A | p.Gln1923Lys | p.Q1923K | Q96Q15 | protein_coding | tolerated(0.1) | possibly_damaging(0.9) | TCGA-BH-A0BG-01 | Breast | breast invasive carcinoma | Female | >=65 | I/II | Unknown | Unknown | SD |
| Entrez ID | Symbol | Category | Interaction Types | Drug Claim Name | Drug Name | PMIDs |
| 23049 | SMG1 | DRUGGABLE GENOME, ENZYME, KINASE, SERINE THREONINE KINASE, PHOSPHATIDYLINOSITOL 3 KINASE, DNA REPAIR | | ApoC-III | | |
| 23049 | SMG1 | DRUGGABLE GENOME, ENZYME, KINASE, SERINE THREONINE KINASE, PHOSPHATIDYLINOSITOL 3 KINASE, DNA REPAIR | inhibitor | 252827484 | | |
| 23049 | SMG1 | DRUGGABLE GENOME, ENZYME, KINASE, SERINE THREONINE KINASE, PHOSPHATIDYLINOSITOL 3 KINASE, DNA REPAIR | | Bisquaternary salt | | |


