
|
|||||
|
 | |
| |
| |
| |
| |
| |
|
Gene: SMC1B |
Gene summary for SMC1B |
| Gene information | Species | Human | Gene symbol | SMC1B | Gene ID | 27127 |
| Gene name | structural maintenance of chromosomes 1B | |
| Gene Alias | SMC1BETA | |
| Cytomap | 22q13.31 | |
| Gene Type | protein-coding | GO ID | GO:0000003 | UniProtAcc | Q8NDV3 |
Top |
Malignant transformation analysis |
| Identification of the aberrant gene expression in precancerous and cancerous lesions by comparing the gene expression of stem-like cells in diseased tissues with normal stem cells |
| Entrez ID | Symbol | Replicates | Species | Organ | Tissue | Adj P-value | Log2FC | Malignancy |
| 27127 | SMC1B | CA_HPV_2 | Human | Cervix | CC | 6.70e-14 | 2.91e-01 | 0.0391 |
| 27127 | SMC1B | HSIL_HPV_2 | Human | Cervix | HSIL_HPV | 1.49e-13 | 3.21e-01 | 0.0208 |
| 27127 | SMC1B | CCI_3 | Human | Cervix | CC | 2.70e-19 | 7.50e-01 | 0.516 |
| 27127 | SMC1B | CCII_1 | Human | Cervix | CC | 1.26e-09 | 2.71e-01 | 0.3249 |
| 27127 | SMC1B | Tumor | Human | Cervix | CC | 3.83e-04 | 1.19e-01 | 0.1241 |
| 27127 | SMC1B | sample1 | Human | Cervix | CC | 3.25e-05 | 2.06e-01 | 0.0959 |
| 27127 | SMC1B | sample3 | Human | Cervix | CC | 4.15e-09 | 1.66e-01 | 0.1387 |
| 27127 | SMC1B | T1 | Human | Cervix | CC | 4.87e-09 | 2.25e-01 | 0.0918 |
| 27127 | SMC1B | T3 | Human | Cervix | CC | 1.91e-09 | 1.51e-01 | 0.1389 |
| 27127 | SMC1B | C43 | Human | Oral cavity | OSCC | 4.47e-27 | 4.52e-01 | 0.1704 |
| 27127 | SMC1B | C46 | Human | Oral cavity | OSCC | 2.67e-55 | 1.22e+00 | 0.1673 |
| 27127 | SMC1B | C57 | Human | Oral cavity | OSCC | 2.61e-18 | 6.29e-01 | 0.1679 |
| 27127 | SMC1B | LN22 | Human | Oral cavity | OSCC | 7.59e-07 | 8.01e-01 | 0.1733 |
| 27127 | SMC1B | LN46 | Human | Oral cavity | OSCC | 1.59e-40 | 1.12e+00 | 0.1666 |
| Page: 1 |
| Tissue | Expression Dynamics | Abbreviation |
| Cervix | 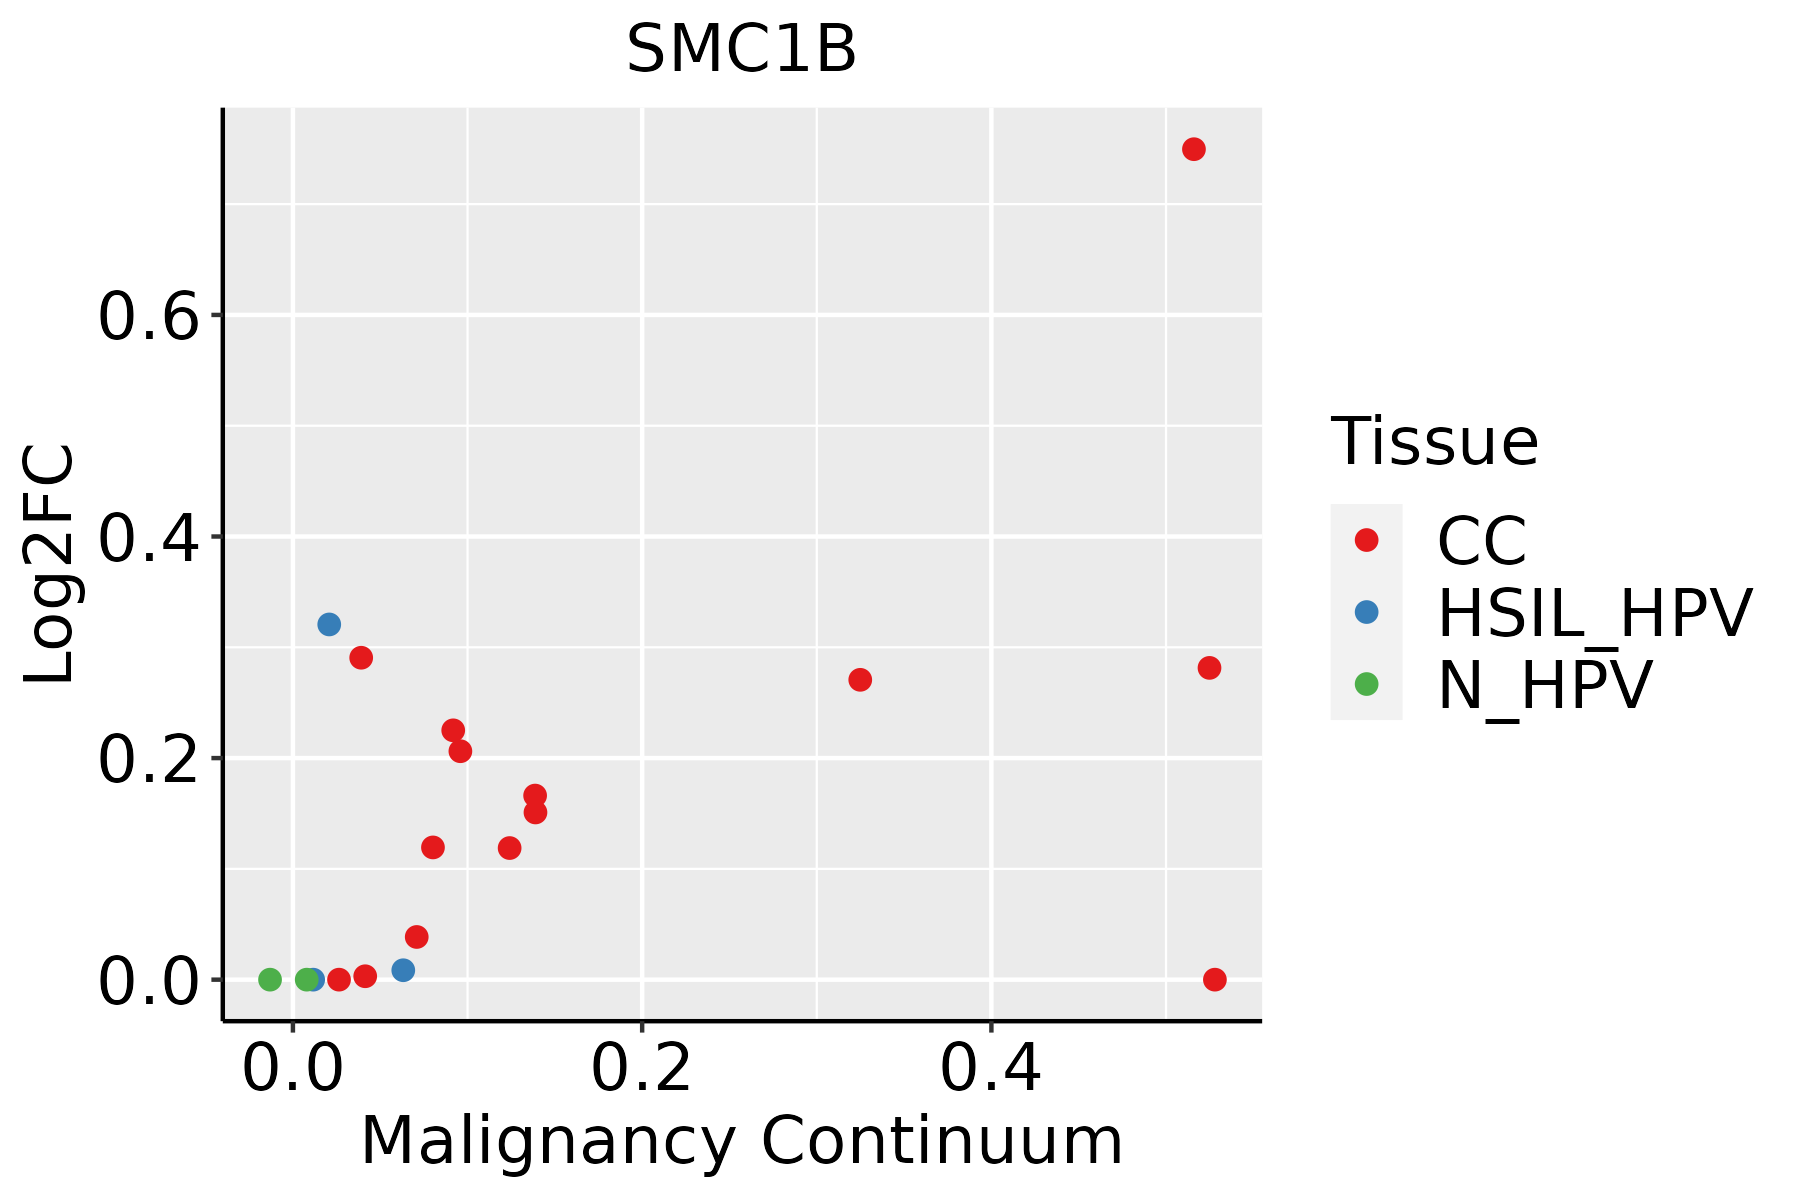 | CC: Cervix cancer |
| HSIL_HPV: HPV-infected high-grade squamous intraepithelial lesions | ||
| N_HPV: HPV-infected normal cervix | ||
| Oral Cavity |  | EOLP: Erosive Oral lichen planus |
| LP: leukoplakia | ||
| NEOLP: Non-erosive oral lichen planus | ||
| OSCC: Oral squamous cell carcinoma |
| ∗log2FC in expression of this searched gene in stem-like cells from each diseased tissue sample relative to stem-like cells in normal samples in each tissue plotted against the malignancy continuum. Samples are colored based on if they are from different disease stage. |
Top |
Malignant transformation related pathway analysis |
| Find out the enriched GO biological processes and KEGG pathways involved in transition from healthy to precancer to cancer |
| Tissue | Disease Stage | Enriched GO biological Processes |
| Colorectum | AD |  |
| Colorectum | SER |  |
| Colorectum | MSS |  |
| Colorectum | MSI-H |  |
| Colorectum | FAP |  |
| ∗Top 15 enriched GO BP terms are showed in the bar plot of each disease state in each tissue. Each row represents a significant GO biological process which is colored according to the -log10(p.adjust). |
| Page: 1 2 3 4 5 6 7 8 9 |
| GO ID | Tissue | Disease Stage | Description | Gene Ratio | Bg Ratio | pvalue | p.adjust | Count |
| GO:00070646 | Cervix | CC | mitotic sister chromatid cohesion | 12/2311 | 28/18723 | 5.47e-05 | 8.06e-04 | 12 |
| GO:01400143 | Cervix | CC | mitotic nuclear division | 50/2311 | 287/18723 | 7.27e-03 | 3.91e-02 | 50 |
| GO:00070625 | Cervix | CC | sister chromatid cohesion | 15/2311 | 62/18723 | 7.30e-03 | 3.92e-02 | 15 |
| GO:00482851 | Cervix | CC | organelle fission | 78/2311 | 488/18723 | 9.70e-03 | 4.79e-02 | 78 |
| GO:01400145 | Oral cavity | OSCC | mitotic nuclear division | 191/7305 | 287/18723 | 1.99e-21 | 3.70e-19 | 191 |
| GO:00000702 | Oral cavity | OSCC | mitotic sister chromatid segregation | 118/7305 | 168/18723 | 1.89e-16 | 1.48e-14 | 118 |
| GO:00008193 | Oral cavity | OSCC | sister chromatid segregation | 135/7305 | 202/18723 | 8.88e-16 | 6.52e-14 | 135 |
| GO:00070592 | Oral cavity | OSCC | chromosome segregation | 206/7305 | 346/18723 | 5.82e-15 | 3.76e-13 | 206 |
| GO:00482852 | Oral cavity | OSCC | organelle fission | 265/7305 | 488/18723 | 3.22e-12 | 1.27e-10 | 265 |
| GO:00002801 | Oral cavity | OSCC | nuclear division | 237/7305 | 439/18723 | 9.62e-11 | 2.90e-09 | 237 |
| GO:00988132 | Oral cavity | OSCC | nuclear chromosome segregation | 162/7305 | 281/18723 | 1.56e-10 | 4.56e-09 | 162 |
| GO:00070647 | Oral cavity | OSCC | mitotic sister chromatid cohesion | 21/7305 | 28/18723 | 1.19e-04 | 8.54e-04 | 21 |
| GO:00070626 | Oral cavity | OSCC | sister chromatid cohesion | 37/7305 | 62/18723 | 7.79e-04 | 4.23e-03 | 37 |
| Page: 1 |
| Pathway ID | Tissue | Disease Stage | Description | Gene Ratio | Bg Ratio | pvalue | p.adjust | qvalue | Count |
| hsa041106 | Cervix | CC | Cell cycle | 36/1267 | 157/8465 | 4.94e-03 | 1.67e-02 | 9.86e-03 | 36 |
| hsa0411013 | Cervix | CC | Cell cycle | 36/1267 | 157/8465 | 4.94e-03 | 1.67e-02 | 9.86e-03 | 36 |
| hsa04114 | Oral cavity | OSCC | Oocyte meiosis | 74/3704 | 131/8465 | 2.13e-03 | 5.75e-03 | 2.92e-03 | 74 |
| hsa041141 | Oral cavity | OSCC | Oocyte meiosis | 74/3704 | 131/8465 | 2.13e-03 | 5.75e-03 | 2.92e-03 | 74 |
| Page: 1 |
Top |
Cell-cell communication analysis |
| Identification of potential cell-cell interactions between two cell types and their ligand-receptor pairs for different disease states |
| Ligand | Receptor | LRpair | Pathway | Tissue | Disease Stage |
| Page: 1 |
Top |
Single-cell gene regulatory network inference analysis |
| Find out the significant the regulons (TFs) and the target genes of each regulon across cell types for different disease states |
| TF | Cell Type | Tissue | Disease Stage | Target Gene | RSS | Regulon Activity |
| ∗The dot plots of a searched regulon are shown for all cell subpopulations in each disease state of each tissue based on the regulon specific score inferred using pySCENIC and by calculating the average expression. |
| Page: 1 |
Top |
Somatic mutation of malignant transformation related genes |
| Annotation of somatic variants for genes involved in malignant transformation |
| Hugo Symbol | Variant Class | Variant Classification | dbSNP RS | HGVSc | HGVSp | HGVSp Short | SWISSPROT | BIOTYPE | SIFT | PolyPhen | Tumor Sample Barcode | Tissue | Histology | Sex | Age | Stage | Therapy Types | Drugs | Outcome |
| SMC1B | SNV | Missense_Mutation | rs750340580 | c.1781N>C | p.Val594Ala | p.V594A | Q8NDV3 | protein_coding | tolerated(0.08) | benign(0.007) | TCGA-A2-A0EQ-01 | Breast | breast invasive carcinoma | Female | <65 | I/II | Chemotherapy | adriamycin | SD |
| SMC1B | SNV | Missense_Mutation | c.3583N>C | p.Ala1195Pro | p.A1195P | Q8NDV3 | protein_coding | deleterious(0) | probably_damaging(1) | TCGA-A8-A099-01 | Breast | breast invasive carcinoma | Female | >=65 | III/IV | Hormone Therapy | exemestane | SD | |
| SMC1B | SNV | Missense_Mutation | rs772993600 | c.1618N>T | p.Arg540Trp | p.R540W | Q8NDV3 | protein_coding | deleterious(0) | possibly_damaging(0.814) | TCGA-A8-A09Q-01 | Breast | breast invasive carcinoma | Female | >=65 | III/IV | Hormone Therapy | anastrozole | SD |
| SMC1B | SNV | Missense_Mutation | novel | c.3592G>C | p.Gly1198Arg | p.G1198R | Q8NDV3 | protein_coding | deleterious(0) | probably_damaging(0.996) | TCGA-AC-A3BB-01 | Breast | breast invasive carcinoma | Female | <65 | III/IV | Chemotherapy | cytoxan | CR |
| SMC1B | SNV | Missense_Mutation | c.1390G>A | p.Glu464Lys | p.E464K | Q8NDV3 | protein_coding | tolerated(0.16) | benign(0.012) | TCGA-AN-A0XS-01 | Breast | breast invasive carcinoma | Female | <65 | III/IV | Unknown | Unknown | SD | |
| SMC1B | SNV | Missense_Mutation | c.1028N>C | p.Leu343Ser | p.L343S | Q8NDV3 | protein_coding | deleterious(0) | possibly_damaging(0.811) | TCGA-BH-A0WA-01 | Breast | breast invasive carcinoma | Female | >=65 | I/II | Unknown | Unknown | SD | |
| SMC1B | SNV | Missense_Mutation | c.2860N>A | p.Glu954Lys | p.E954K | Q8NDV3 | protein_coding | tolerated(0.05) | benign(0.015) | TCGA-C8-A275-01 | Breast | breast invasive carcinoma | Female | <65 | I/II | Unknown | Unknown | SD | |
| SMC1B | SNV | Missense_Mutation | c.1570N>A | p.His524Asn | p.H524N | Q8NDV3 | protein_coding | deleterious(0.02) | probably_damaging(0.939) | TCGA-D8-A1J9-01 | Breast | breast invasive carcinoma | Female | <65 | I/II | Unknown | Unknown | SD | |
| SMC1B | SNV | Missense_Mutation | novel | c.3142N>T | p.Ala1048Ser | p.A1048S | Q8NDV3 | protein_coding | tolerated(0.06) | benign(0.444) | TCGA-E9-A295-01 | Breast | breast invasive carcinoma | Female | >=65 | I/II | Hormone Therapy | tamoxiphen | SD |
| SMC1B | deletion | Frame_Shift_Del | rs748761052 | c.572delN | p.Asn191IlefsTer2 | p.N191Ifs*2 | Q8NDV3 | protein_coding | TCGA-AR-A0TV-01 | Breast | breast invasive carcinoma | Female | >=65 | I/II | Unknown | Unknown | SD |
| Page: 1 2 3 4 5 6 7 8 9 10 11 12 13 14 15 |
Top |
Related drugs of malignant transformation related genes |
| Identification of chemicals and drugs interact with genes involved in malignant transfromation |
| (DGIdb 4.0) |
| Entrez ID | Symbol | Category | Interaction Types | Drug Claim Name | Drug Name | PMIDs |
| Page: 1 |

Copyright 2023-Present -The University of Texas Health Science Center at Houston |