
|
|||||
|
 | |
| |
| |
| |
| |
| |
|
Gene: SMC1A |
Gene summary for SMC1A |
| Gene information | Species | Human | Gene symbol | SMC1A | Gene ID | 8243 |
| Gene name | structural maintenance of chromosomes 1A | |
| Gene Alias | CDLS2 | |
| Cytomap | Xp11.22 | |
| Gene Type | protein-coding | GO ID | GO:0000003 | UniProtAcc | G8JLG1 |
Top |
Malignant transformation analysis |
| Identification of the aberrant gene expression in precancerous and cancerous lesions by comparing the gene expression of stem-like cells in diseased tissues with normal stem cells |
| Entrez ID | Symbol | Replicates | Species | Organ | Tissue | Adj P-value | Log2FC | Malignancy |
| 8243 | SMC1A | HTA11_347_2000001011 | Human | Colorectum | AD | 8.17e-09 | 3.95e-01 | -0.1954 |
| 8243 | SMC1A | HTA11_99999965104_69814 | Human | Colorectum | MSS | 3.36e-07 | 4.79e-01 | 0.281 |
| 8243 | SMC1A | HTA11_99999971662_82457 | Human | Colorectum | MSS | 1.89e-05 | 3.58e-01 | 0.3859 |
| 8243 | SMC1A | A002-C-205 | Human | Colorectum | FAP | 4.14e-04 | 2.79e-01 | -0.1236 |
| 8243 | SMC1A | LZE2T | Human | Esophagus | ESCC | 1.53e-13 | 1.14e+00 | 0.082 |
| 8243 | SMC1A | LZE4T | Human | Esophagus | ESCC | 3.29e-05 | 2.30e-01 | 0.0811 |
| 8243 | SMC1A | LZE5T | Human | Esophagus | ESCC | 2.36e-03 | 6.58e-01 | 0.0514 |
| 8243 | SMC1A | LZE7T | Human | Esophagus | ESCC | 4.96e-11 | 7.67e-01 | 0.0667 |
| 8243 | SMC1A | LZE8T | Human | Esophagus | ESCC | 9.48e-07 | 3.55e-01 | 0.067 |
| 8243 | SMC1A | LZE20T | Human | Esophagus | ESCC | 3.21e-08 | 2.63e-01 | 0.0662 |
| 8243 | SMC1A | LZE22T | Human | Esophagus | ESCC | 2.41e-03 | 6.17e-01 | 0.068 |
| 8243 | SMC1A | LZE24T | Human | Esophagus | ESCC | 8.62e-30 | 7.72e-01 | 0.0596 |
| 8243 | SMC1A | LZE21T | Human | Esophagus | ESCC | 2.73e-02 | 4.69e-01 | 0.0655 |
| 8243 | SMC1A | LZE6T | Human | Esophagus | ESCC | 2.30e-04 | 2.90e-01 | 0.0845 |
| 8243 | SMC1A | P1T-E | Human | Esophagus | ESCC | 4.99e-07 | 4.01e-01 | 0.0875 |
| 8243 | SMC1A | P2T-E | Human | Esophagus | ESCC | 2.76e-101 | 1.97e+00 | 0.1177 |
| 8243 | SMC1A | P4T-E | Human | Esophagus | ESCC | 9.57e-24 | 6.26e-01 | 0.1323 |
| 8243 | SMC1A | P5T-E | Human | Esophagus | ESCC | 1.53e-21 | 5.19e-01 | 0.1327 |
| 8243 | SMC1A | P8T-E | Human | Esophagus | ESCC | 2.28e-36 | 8.10e-01 | 0.0889 |
| 8243 | SMC1A | P9T-E | Human | Esophagus | ESCC | 1.51e-18 | 4.68e-01 | 0.1131 |
| Page: 1 2 3 4 5 6 7 |
| Tissue | Expression Dynamics | Abbreviation |
| Colorectum (GSE201348) |  | FAP: Familial adenomatous polyposis |
| CRC: Colorectal cancer | ||
| Colorectum (HTA11) |  | AD: Adenomas |
| SER: Sessile serrated lesions | ||
| MSI-H: Microsatellite-high colorectal cancer | ||
| MSS: Microsatellite stable colorectal cancer | ||
| Esophagus | 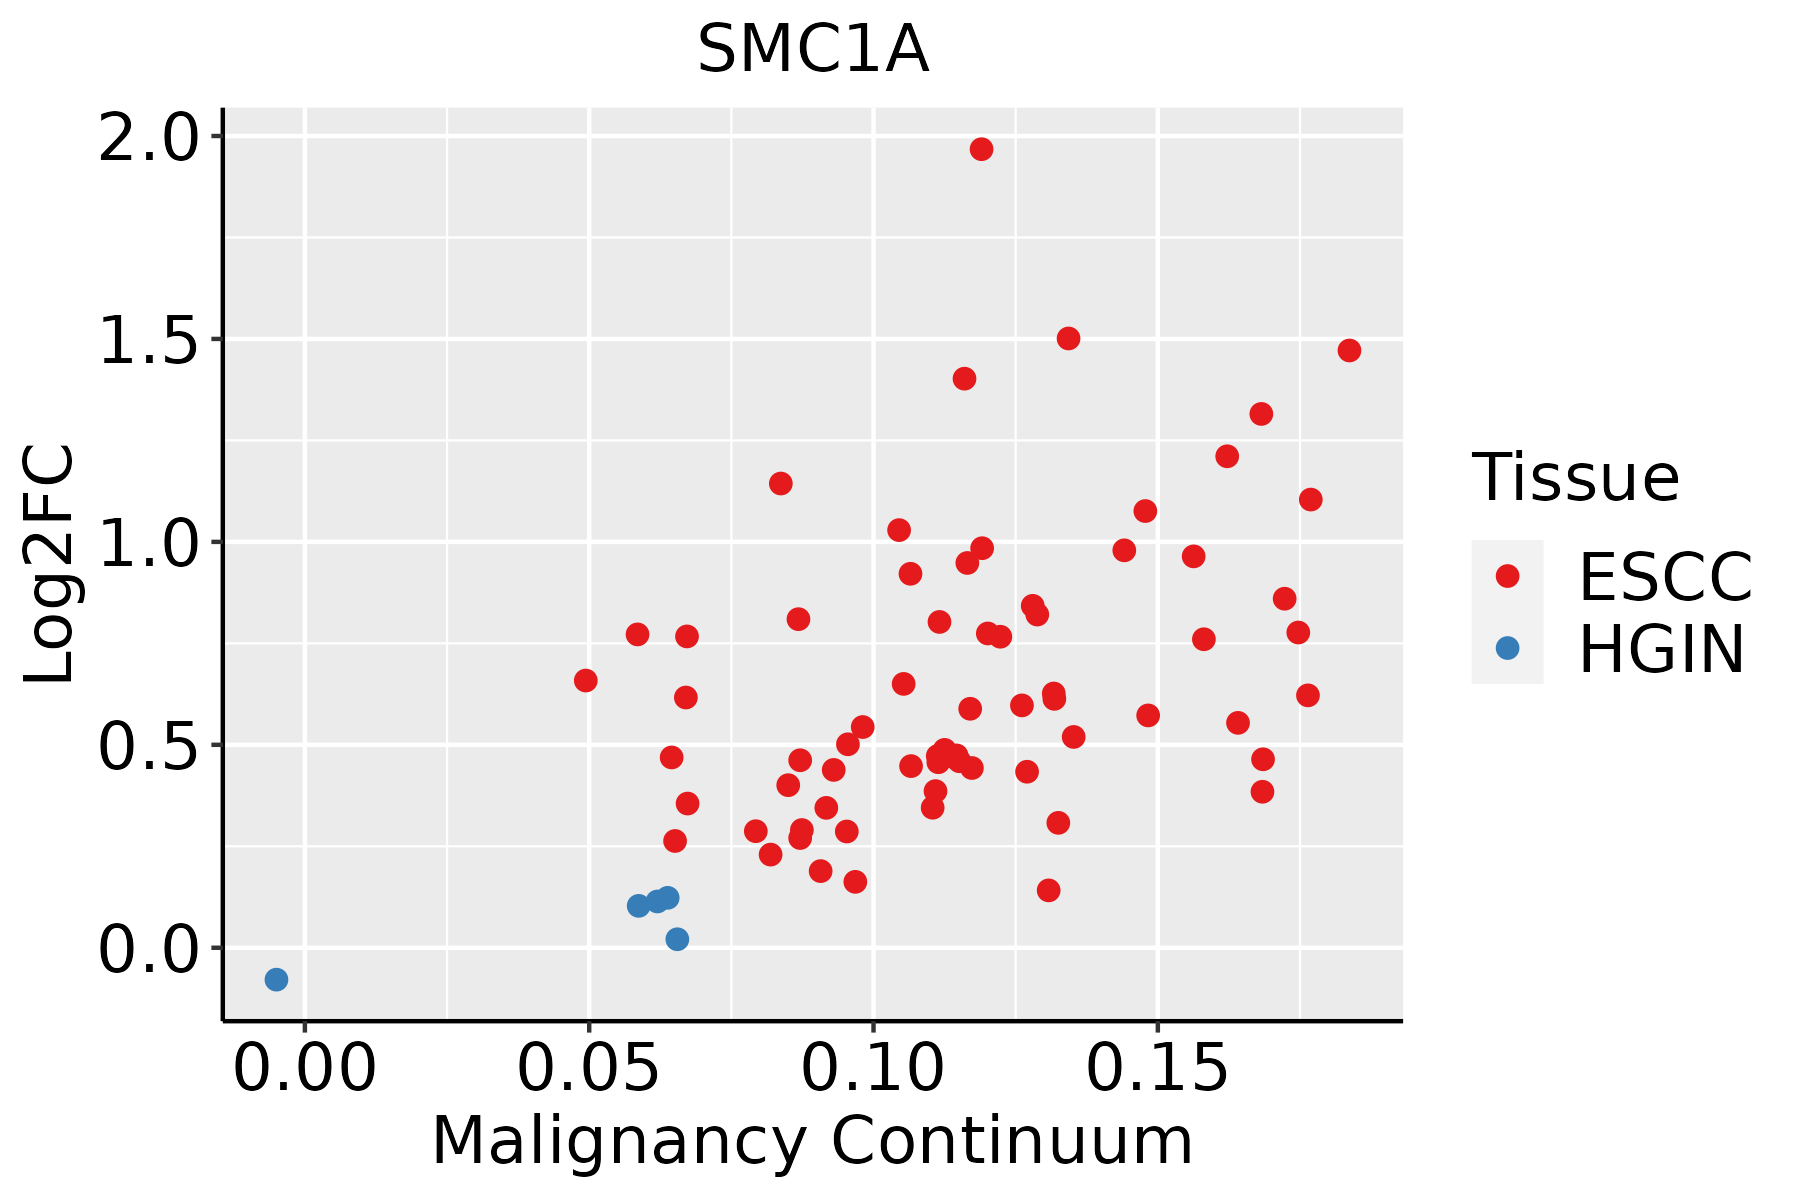 | ESCC: Esophageal squamous cell carcinoma |
| HGIN: High-grade intraepithelial neoplasias | ||
| LGIN: Low-grade intraepithelial neoplasias | ||
| Liver | 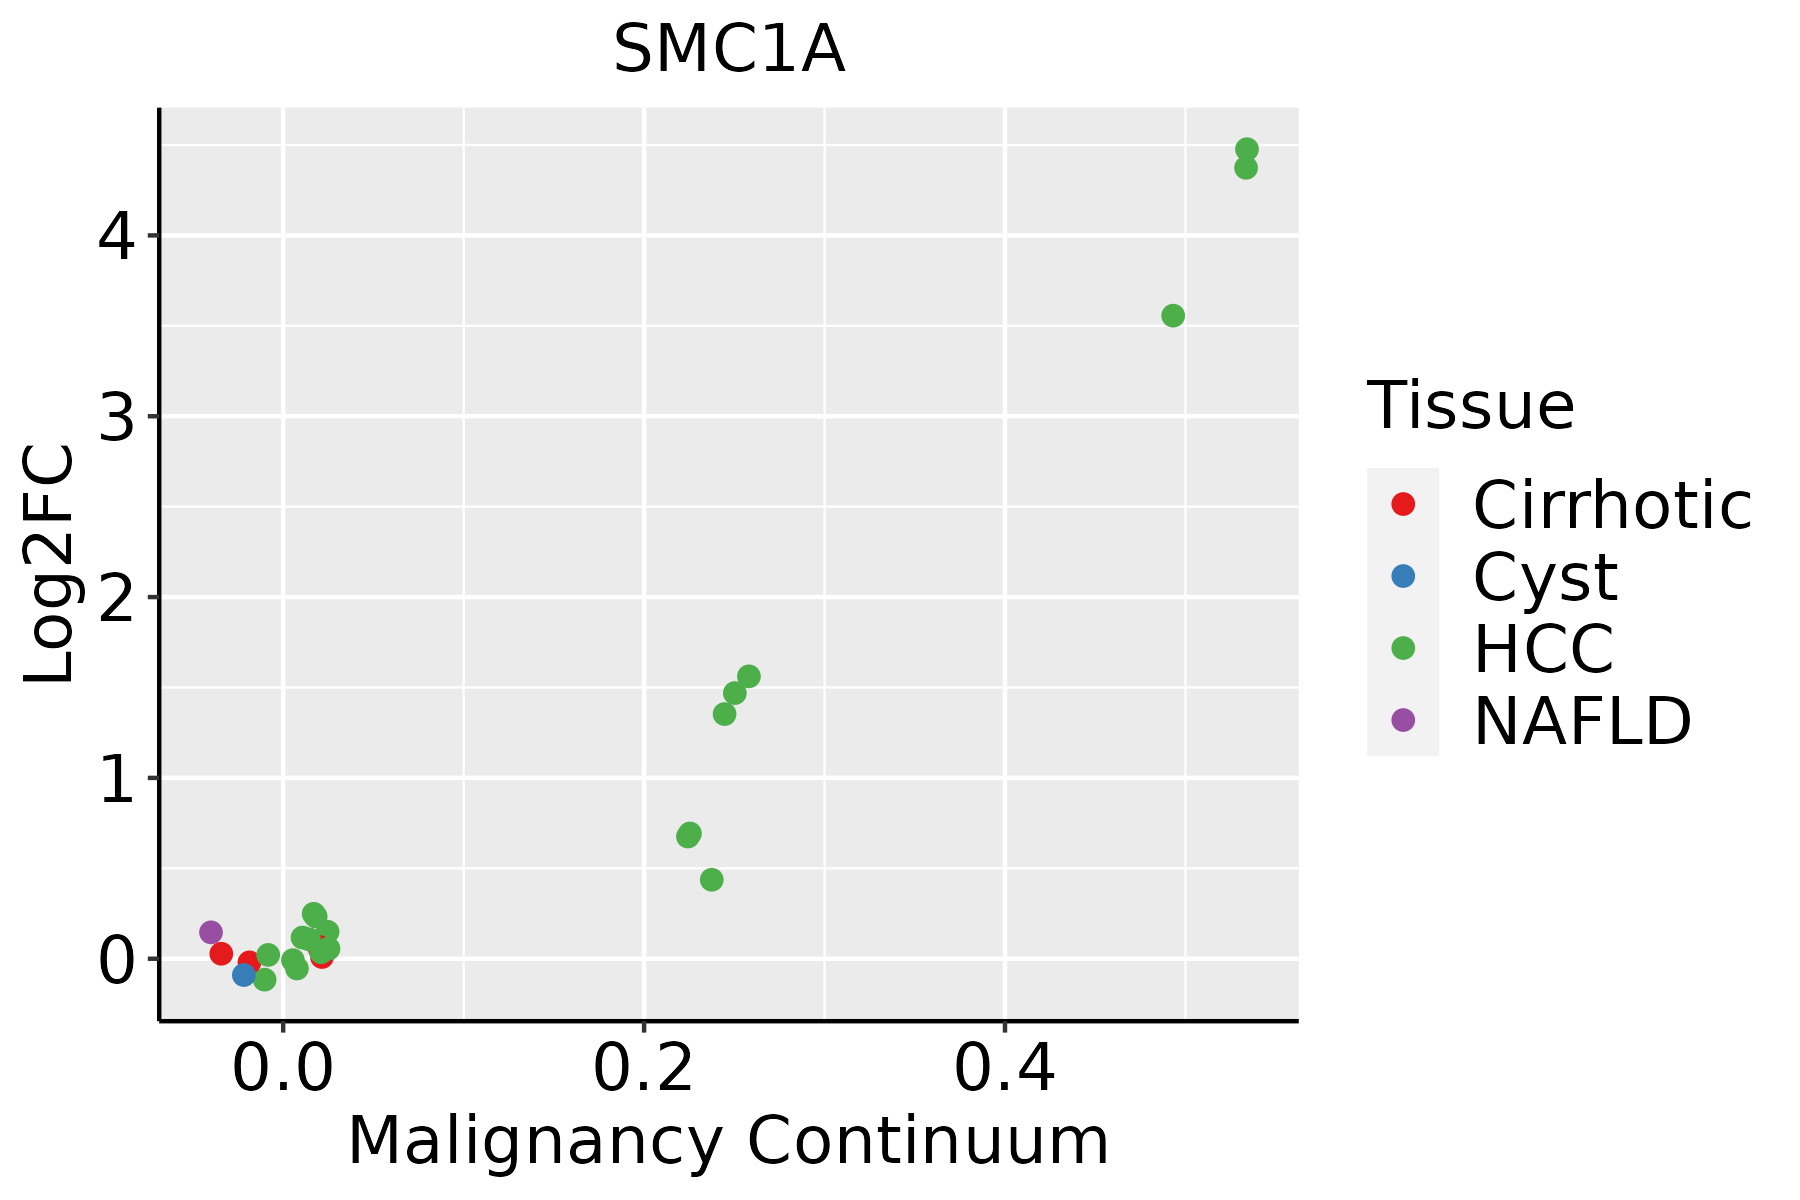 | HCC: Hepatocellular carcinoma |
| NAFLD: Non-alcoholic fatty liver disease | ||
| Oral Cavity | 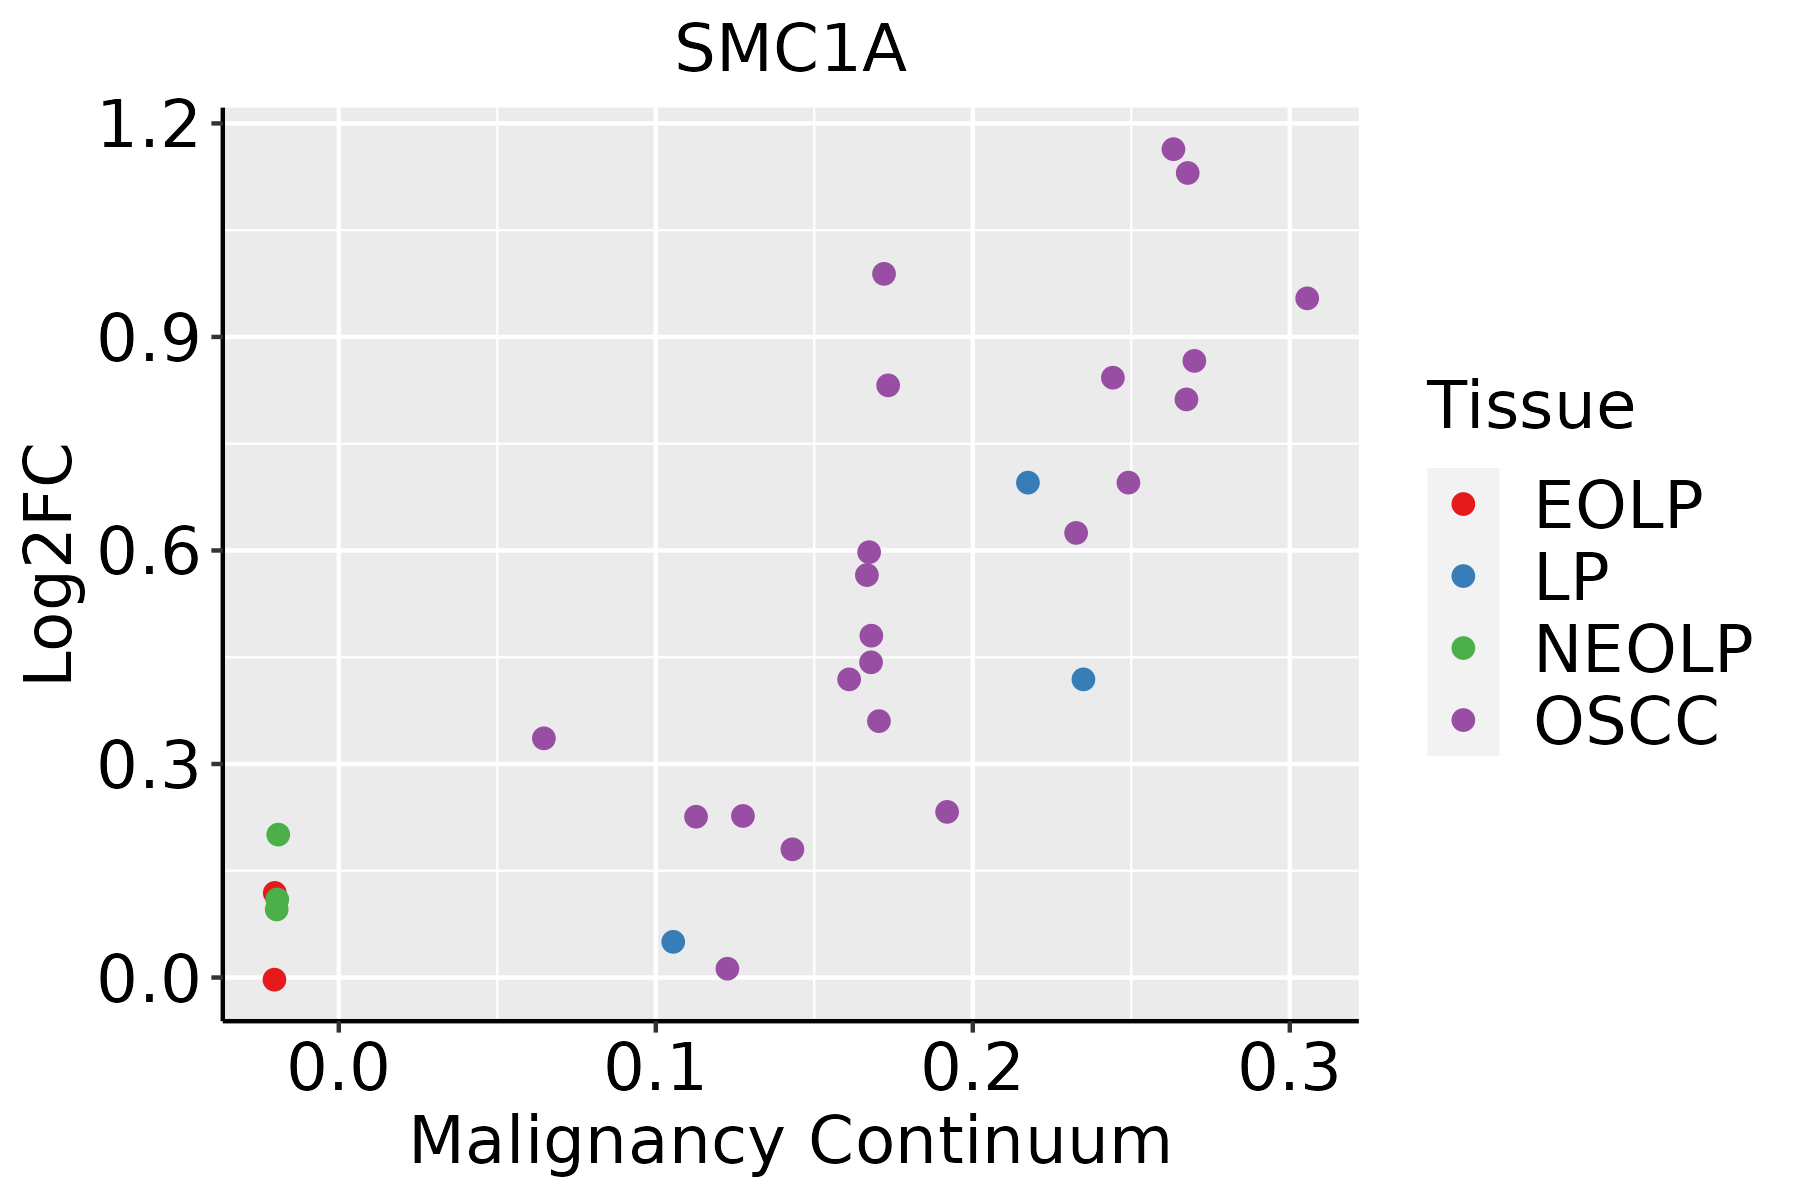 | EOLP: Erosive Oral lichen planus |
| LP: leukoplakia | ||
| NEOLP: Non-erosive oral lichen planus | ||
| OSCC: Oral squamous cell carcinoma | ||
| Skin |  | AK: Actinic keratosis |
| cSCC: Cutaneous squamous cell carcinoma | ||
| SCCIS:squamous cell carcinoma in situ | ||
| Thyroid | 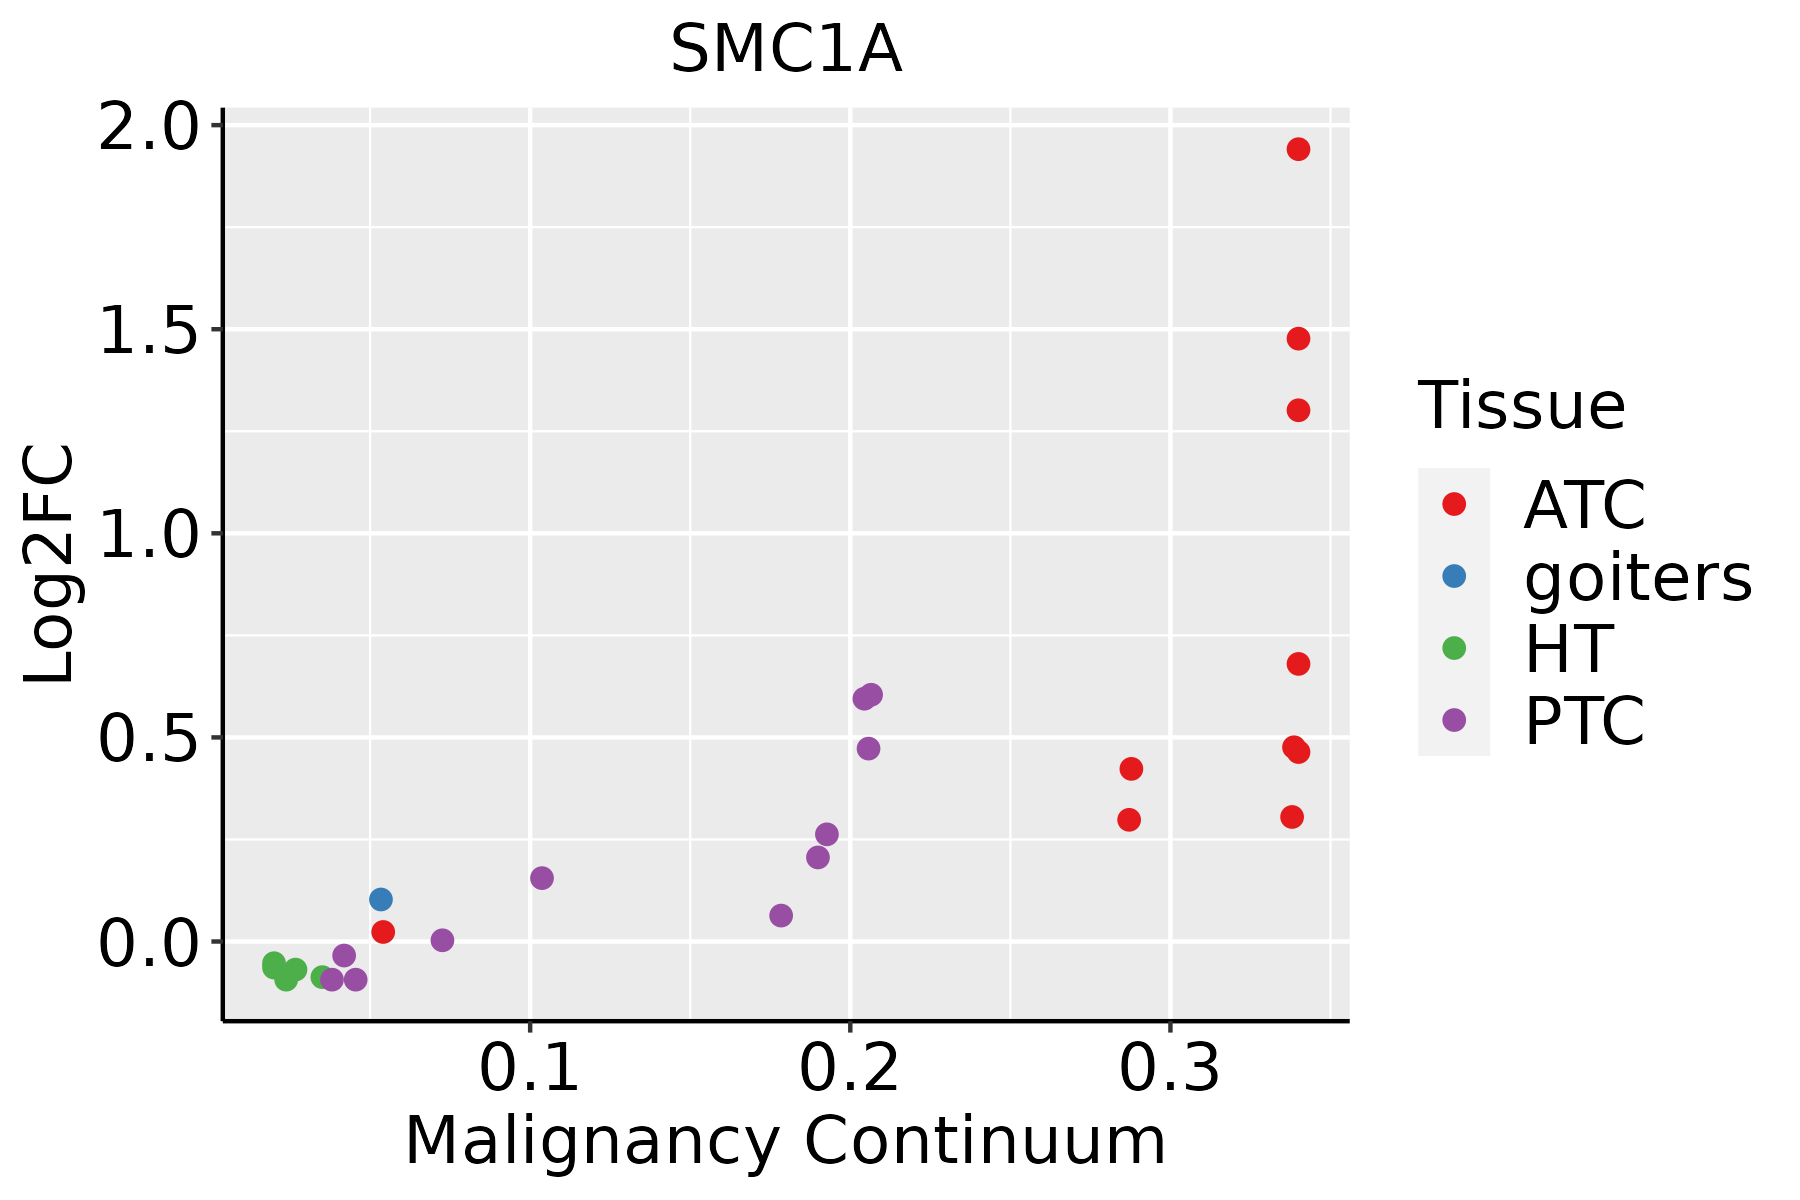 | ATC: Anaplastic thyroid cancer |
| HT: Hashimoto's thyroiditis | ||
| PTC: Papillary thyroid cancer |
| ∗log2FC in expression of this searched gene in stem-like cells from each diseased tissue sample relative to stem-like cells in normal samples in each tissue plotted against the malignancy continuum. Samples are colored based on if they are from different disease stage. |
Top |
Malignant transformation related pathway analysis |
| Find out the enriched GO biological processes and KEGG pathways involved in transition from healthy to precancer to cancer |
| Tissue | Disease Stage | Enriched GO biological Processes |
| Colorectum | AD |  |
| Colorectum | SER |  |
| Colorectum | MSS |  |
| Colorectum | MSI-H |  |
| Colorectum | FAP |  |
| ∗Top 15 enriched GO BP terms are showed in the bar plot of each disease state in each tissue. Each row represents a significant GO biological process which is colored according to the -log10(p.adjust). |
| Page: 1 2 3 4 5 6 7 8 9 |
| GO ID | Tissue | Disease Stage | Description | Gene Ratio | Bg Ratio | pvalue | p.adjust | Count |
| GO:0007051 | Colorectum | AD | spindle organization | 58/3918 | 184/18723 | 4.71e-04 | 5.20e-03 | 58 |
| GO:1902850 | Colorectum | AD | microtubule cytoskeleton organization involved in mitosis | 48/3918 | 147/18723 | 5.87e-04 | 6.21e-03 | 48 |
| GO:0090307 | Colorectum | AD | mitotic spindle assembly | 25/3918 | 65/18723 | 9.12e-04 | 8.71e-03 | 25 |
| GO:0007052 | Colorectum | AD | mitotic spindle organization | 40/3918 | 120/18723 | 1.03e-03 | 9.61e-03 | 40 |
| GO:0007064 | Colorectum | AD | mitotic sister chromatid cohesion | 13/3918 | 28/18723 | 2.22e-03 | 1.75e-02 | 13 |
| GO:0007062 | Colorectum | AD | sister chromatid cohesion | 23/3918 | 62/18723 | 2.51e-03 | 1.92e-02 | 23 |
| GO:0051225 | Colorectum | AD | spindle assembly | 37/3918 | 117/18723 | 4.32e-03 | 2.96e-02 | 37 |
| GO:0140014 | Colorectum | AD | mitotic nuclear division | 78/3918 | 287/18723 | 6.48e-03 | 4.05e-02 | 78 |
| GO:00070511 | Colorectum | MSS | spindle organization | 53/3467 | 184/18723 | 4.23e-04 | 5.19e-03 | 53 |
| GO:19028501 | Colorectum | MSS | microtubule cytoskeleton organization involved in mitosis | 44/3467 | 147/18723 | 5.17e-04 | 5.98e-03 | 44 |
| GO:00070521 | Colorectum | MSS | mitotic spindle organization | 36/3467 | 120/18723 | 1.52e-03 | 1.39e-02 | 36 |
| GO:00903071 | Colorectum | MSS | mitotic spindle assembly | 22/3467 | 65/18723 | 2.33e-03 | 1.90e-02 | 22 |
| GO:00070621 | Colorectum | MSS | sister chromatid cohesion | 20/3467 | 62/18723 | 6.63e-03 | 4.38e-02 | 20 |
| GO:00512251 | Colorectum | MSS | spindle assembly | 33/3467 | 117/18723 | 6.68e-03 | 4.38e-02 | 33 |
| GO:01400141 | Colorectum | MSS | mitotic nuclear division | 70/3467 | 287/18723 | 7.48e-03 | 4.72e-02 | 70 |
| GO:00070641 | Colorectum | MSS | mitotic sister chromatid cohesion | 11/3467 | 28/18723 | 8.30e-03 | 5.00e-02 | 11 |
| GO:0019827 | Colorectum | FAP | stem cell population maintenance | 33/2622 | 131/18723 | 4.61e-04 | 5.39e-03 | 33 |
| GO:0098727 | Colorectum | FAP | maintenance of cell number | 33/2622 | 134/18723 | 7.09e-04 | 7.64e-03 | 33 |
| GO:00070642 | Colorectum | FAP | mitotic sister chromatid cohesion | 11/2622 | 28/18723 | 8.55e-04 | 8.79e-03 | 11 |
| GO:00070512 | Colorectum | FAP | spindle organization | 41/2622 | 184/18723 | 1.50e-03 | 1.34e-02 | 41 |
| Page: 1 2 3 4 5 6 7 8 9 |
| Pathway ID | Tissue | Disease Stage | Description | Gene Ratio | Bg Ratio | pvalue | p.adjust | qvalue | Count |
| hsa04110 | Colorectum | FAP | Cell cycle | 37/1404 | 157/8465 | 1.44e-02 | 4.77e-02 | 2.90e-02 | 37 |
| hsa041101 | Colorectum | FAP | Cell cycle | 37/1404 | 157/8465 | 1.44e-02 | 4.77e-02 | 2.90e-02 | 37 |
| hsa0411023 | Esophagus | ESCC | Cell cycle | 126/4205 | 157/8465 | 1.34e-15 | 5.60e-14 | 2.87e-14 | 126 |
| hsa041146 | Esophagus | ESCC | Oocyte meiosis | 77/4205 | 131/8465 | 2.19e-02 | 4.80e-02 | 2.46e-02 | 77 |
| hsa0411033 | Esophagus | ESCC | Cell cycle | 126/4205 | 157/8465 | 1.34e-15 | 5.60e-14 | 2.87e-14 | 126 |
| hsa0411411 | Esophagus | ESCC | Oocyte meiosis | 77/4205 | 131/8465 | 2.19e-02 | 4.80e-02 | 2.46e-02 | 77 |
| hsa041102 | Liver | HCC | Cell cycle | 106/4020 | 157/8465 | 2.54e-07 | 3.04e-06 | 1.69e-06 | 106 |
| hsa041103 | Liver | HCC | Cell cycle | 106/4020 | 157/8465 | 2.54e-07 | 3.04e-06 | 1.69e-06 | 106 |
| hsa041108 | Oral cavity | OSCC | Cell cycle | 118/3704 | 157/8465 | 7.15e-16 | 2.66e-14 | 1.35e-14 | 118 |
| hsa04114 | Oral cavity | OSCC | Oocyte meiosis | 74/3704 | 131/8465 | 2.13e-03 | 5.75e-03 | 2.92e-03 | 74 |
| hsa0411015 | Oral cavity | OSCC | Cell cycle | 118/3704 | 157/8465 | 7.15e-16 | 2.66e-14 | 1.35e-14 | 118 |
| hsa041141 | Oral cavity | OSCC | Oocyte meiosis | 74/3704 | 131/8465 | 2.13e-03 | 5.75e-03 | 2.92e-03 | 74 |
| hsa0411022 | Oral cavity | LP | Cell cycle | 70/2418 | 157/8465 | 1.17e-05 | 8.27e-05 | 5.33e-05 | 70 |
| hsa0411032 | Oral cavity | LP | Cell cycle | 70/2418 | 157/8465 | 1.17e-05 | 8.27e-05 | 5.33e-05 | 70 |
| hsa0411041 | Oral cavity | EOLP | Cell cycle | 42/1218 | 157/8465 | 3.20e-05 | 1.61e-04 | 9.52e-05 | 42 |
| hsa041142 | Oral cavity | EOLP | Oocyte meiosis | 33/1218 | 131/8465 | 7.09e-04 | 2.69e-03 | 1.59e-03 | 33 |
| hsa0411051 | Oral cavity | EOLP | Cell cycle | 42/1218 | 157/8465 | 3.20e-05 | 1.61e-04 | 9.52e-05 | 42 |
| hsa041143 | Oral cavity | EOLP | Oocyte meiosis | 33/1218 | 131/8465 | 7.09e-04 | 2.69e-03 | 1.59e-03 | 33 |
| hsa0411061 | Oral cavity | NEOLP | Cell cycle | 37/1112 | 157/8465 | 2.29e-04 | 1.58e-03 | 9.95e-04 | 37 |
| hsa041144 | Oral cavity | NEOLP | Oocyte meiosis | 31/1112 | 131/8465 | 6.64e-04 | 3.52e-03 | 2.21e-03 | 31 |
| Page: 1 2 |
Top |
Cell-cell communication analysis |
| Identification of potential cell-cell interactions between two cell types and their ligand-receptor pairs for different disease states |
| Ligand | Receptor | LRpair | Pathway | Tissue | Disease Stage |
| Page: 1 |
Top |
Single-cell gene regulatory network inference analysis |
| Find out the significant the regulons (TFs) and the target genes of each regulon across cell types for different disease states |
| TF | Cell Type | Tissue | Disease Stage | Target Gene | RSS | Regulon Activity |
| ∗The dot plots of a searched regulon are shown for all cell subpopulations in each disease state of each tissue based on the regulon specific score inferred using pySCENIC and by calculating the average expression. |
| Page: 1 |
Top |
Somatic mutation of malignant transformation related genes |
| Annotation of somatic variants for genes involved in malignant transformation |
| Hugo Symbol | Variant Class | Variant Classification | dbSNP RS | HGVSc | HGVSp | HGVSp Short | SWISSPROT | BIOTYPE | SIFT | PolyPhen | Tumor Sample Barcode | Tissue | Histology | Sex | Age | Stage | Therapy Types | Drugs | Outcome |
| SMC1A | SNV | Missense_Mutation | c.868N>C | p.Glu290Gln | p.E290Q | Q14683 | protein_coding | tolerated(0.36) | possibly_damaging(0.796) | TCGA-A8-A0A9-01 | Breast | breast invasive carcinoma | Female | >=65 | I/II | Hormone Therapy | anastrozole | SD | |
| SMC1A | SNV | Missense_Mutation | novel | c.1260G>T | p.Lys420Asn | p.K420N | Q14683 | protein_coding | tolerated(0.94) | benign(0.247) | TCGA-AN-A046-01 | Breast | breast invasive carcinoma | Female | >=65 | I/II | Unknown | Unknown | SD |
| SMC1A | SNV | Missense_Mutation | novel | c.1142N>T | p.Glu381Val | p.E381V | Q14683 | protein_coding | tolerated(0.08) | benign(0.377) | TCGA-AN-A0FX-01 | Breast | breast invasive carcinoma | Female | <65 | I/II | Unknown | Unknown | SD |
| SMC1A | SNV | Missense_Mutation | c.2795N>A | p.Ala932Asp | p.A932D | Q14683 | protein_coding | tolerated(1) | benign(0.079) | TCGA-AR-A251-01 | Breast | breast invasive carcinoma | Female | <65 | III/IV | Chemotherapy | doxorubicin | SD | |
| SMC1A | SNV | Missense_Mutation | novel | c.2174G>A | p.Arg725Gln | p.R725Q | Q14683 | protein_coding | tolerated(0.12) | benign(0.024) | TCGA-C8-A8HQ-01 | Breast | breast invasive carcinoma | Female | <65 | I/II | Unknown | Unknown | SD |
| SMC1A | SNV | Missense_Mutation | c.2714T>A | p.Met905Lys | p.M905K | Q14683 | protein_coding | deleterious(0) | benign(0.03) | TCGA-D8-A1XQ-01 | Breast | breast invasive carcinoma | Female | >=65 | I/II | Unknown | Unknown | SD | |
| SMC1A | SNV | Missense_Mutation | c.884N>A | p.Arg295Gln | p.R295Q | Q14683 | protein_coding | deleterious(0.03) | benign(0.031) | TCGA-E2-A154-01 | Breast | breast invasive carcinoma | Female | >=65 | I/II | Hormone Therapy | arimidex | SD | |
| SMC1A | SNV | Missense_Mutation | rs782175064 | c.3592G>A | p.Glu1198Lys | p.E1198K | Q14683 | protein_coding | deleterious(0) | benign(0.022) | TCGA-PE-A5DE-01 | Breast | breast invasive carcinoma | Female | <65 | I/II | Chemotherapy | taxotere | CR |
| SMC1A | SNV | Missense_Mutation | novel | c.1248G>C | p.Glu416Asp | p.E416D | Q14683 | protein_coding | tolerated(0.1) | benign(0.166) | TCGA-PE-A5DE-01 | Breast | breast invasive carcinoma | Female | <65 | I/II | Chemotherapy | taxotere | CR |
| SMC1A | insertion | Nonsense_Mutation | novel | c.1339_1340insTCGGAGAGGTTTAAAAAAGCACCGCTTCTAAGAG | p.Gln447LeufsTer5 | p.Q447Lfs*5 | Q14683 | protein_coding | TCGA-A8-A08Z-01 | Breast | breast invasive carcinoma | Female | >=65 | III/IV | Unknown | Unknown | SD |
| Page: 1 2 3 4 5 6 7 8 9 10 11 12 13 14 15 16 |
Top |
Related drugs of malignant transformation related genes |
| Identification of chemicals and drugs interact with genes involved in malignant transfromation |
| (DGIdb 4.0) |
| Entrez ID | Symbol | Category | Interaction Types | Drug Claim Name | Drug Name | PMIDs |
| Page: 1 |

Copyright 2023-Present -The University of Texas Health Science Center at Houston |