
|
|||||
|
 | |
| |
| |
| |
| |
| |
|
Gene: SMARCE1 |
Gene summary for SMARCE1 |
| Gene information | Species | Human | Gene symbol | SMARCE1 | Gene ID | 6605 |
| Gene name | SWI/SNF related, matrix associated, actin dependent regulator of chromatin, subfamily e, member 1 | |
| Gene Alias | BAF57 | |
| Cytomap | 17q21.2 | |
| Gene Type | protein-coding | GO ID | GO:0006139 | UniProtAcc | A0A024R1S7 |
Top |
Malignant transformation analysis |
| Identification of the aberrant gene expression in precancerous and cancerous lesions by comparing the gene expression of stem-like cells in diseased tissues with normal stem cells |
| Entrez ID | Symbol | Replicates | Species | Organ | Tissue | Adj P-value | Log2FC | Malignancy |
| 6605 | SMARCE1 | GSM4909290 | Human | Breast | IDC | 7.96e-37 | 7.96e-01 | 0.2096 |
| 6605 | SMARCE1 | GSM4909311 | Human | Breast | IDC | 9.78e-08 | -1.22e-01 | 0.1534 |
| 6605 | SMARCE1 | GSM4909312 | Human | Breast | IDC | 5.16e-03 | -7.67e-02 | 0.1552 |
| 6605 | SMARCE1 | GSM4909319 | Human | Breast | IDC | 6.26e-11 | -8.26e-02 | 0.1563 |
| 6605 | SMARCE1 | GSM4909321 | Human | Breast | IDC | 1.28e-03 | -4.75e-02 | 0.1559 |
| 6605 | SMARCE1 | brca3 | Human | Breast | Precancer | 2.39e-04 | 2.36e-01 | -0.0263 |
| 6605 | SMARCE1 | M2 | Human | Breast | IDC | 6.66e-46 | 1.68e+00 | 0.21 |
| 6605 | SMARCE1 | NCCBC14 | Human | Breast | DCIS | 2.80e-23 | 7.82e-01 | 0.2021 |
| 6605 | SMARCE1 | P2 | Human | Breast | IDC | 3.65e-69 | 1.49e+00 | 0.21 |
| 6605 | SMARCE1 | DCIS2 | Human | Breast | DCIS | 2.22e-36 | 7.90e-02 | 0.0085 |
| 6605 | SMARCE1 | HTA11_3410_2000001011 | Human | Colorectum | AD | 4.20e-02 | 9.21e-02 | 0.0155 |
| 6605 | SMARCE1 | HTA11_1938_2000001011 | Human | Colorectum | AD | 1.67e-02 | 1.51e-01 | -0.0811 |
| 6605 | SMARCE1 | HTA11_78_2000001011 | Human | Colorectum | AD | 2.65e-10 | 2.70e-01 | -0.1088 |
| 6605 | SMARCE1 | HTA11_347_2000001011 | Human | Colorectum | AD | 1.02e-14 | 2.91e-01 | -0.1954 |
| 6605 | SMARCE1 | HTA11_3361_2000001011 | Human | Colorectum | AD | 1.91e-05 | 2.24e-01 | -0.1207 |
| 6605 | SMARCE1 | HTA11_83_2000001011 | Human | Colorectum | SER | 8.73e-04 | 1.63e-01 | -0.1526 |
| 6605 | SMARCE1 | HTA11_696_2000001011 | Human | Colorectum | AD | 1.86e-11 | 2.24e-01 | -0.1464 |
| 6605 | SMARCE1 | HTA11_866_2000001011 | Human | Colorectum | AD | 2.00e-05 | 1.44e-01 | -0.1001 |
| 6605 | SMARCE1 | HTA11_1391_2000001011 | Human | Colorectum | AD | 4.60e-11 | 2.80e-01 | -0.059 |
| 6605 | SMARCE1 | HTA11_546_2000001011 | Human | Colorectum | AD | 7.78e-03 | 1.99e-01 | -0.0842 |
| Page: 1 2 3 4 5 6 7 8 9 10 |
| Tissue | Expression Dynamics | Abbreviation |
| Breast | 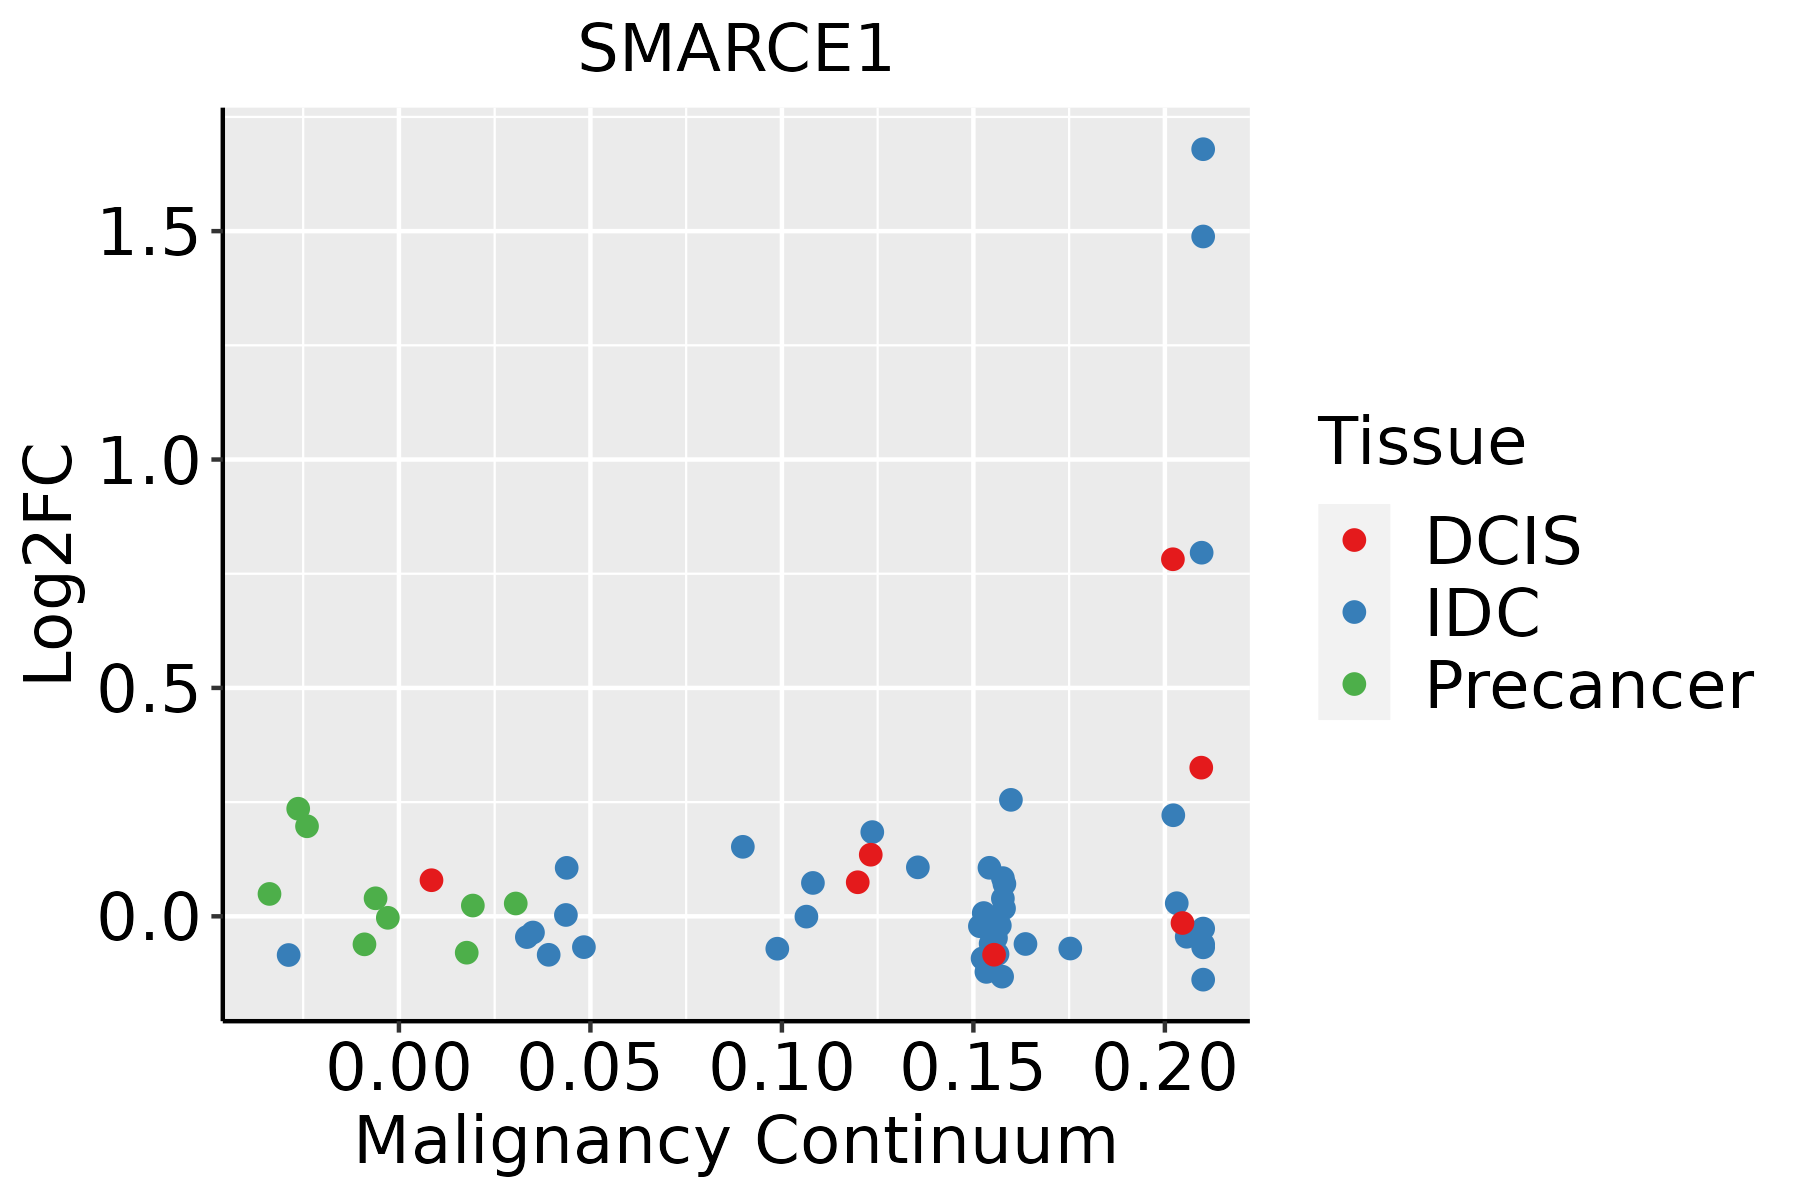 | IDC: Invasive ductal carcinoma |
| DCIS: Ductal carcinoma in situ | ||
| Precancer(BRCA1-mut): Precancerous lesion from BRCA1 mutation carriers | ||
| Colorectum (GSE201348) |  | FAP: Familial adenomatous polyposis |
| CRC: Colorectal cancer | ||
| Colorectum (HTA11) |  | AD: Adenomas |
| SER: Sessile serrated lesions | ||
| MSI-H: Microsatellite-high colorectal cancer | ||
| MSS: Microsatellite stable colorectal cancer | ||
| Endometrium |  | AEH: Atypical endometrial hyperplasia |
| EEC: Endometrioid Cancer | ||
| Esophagus | 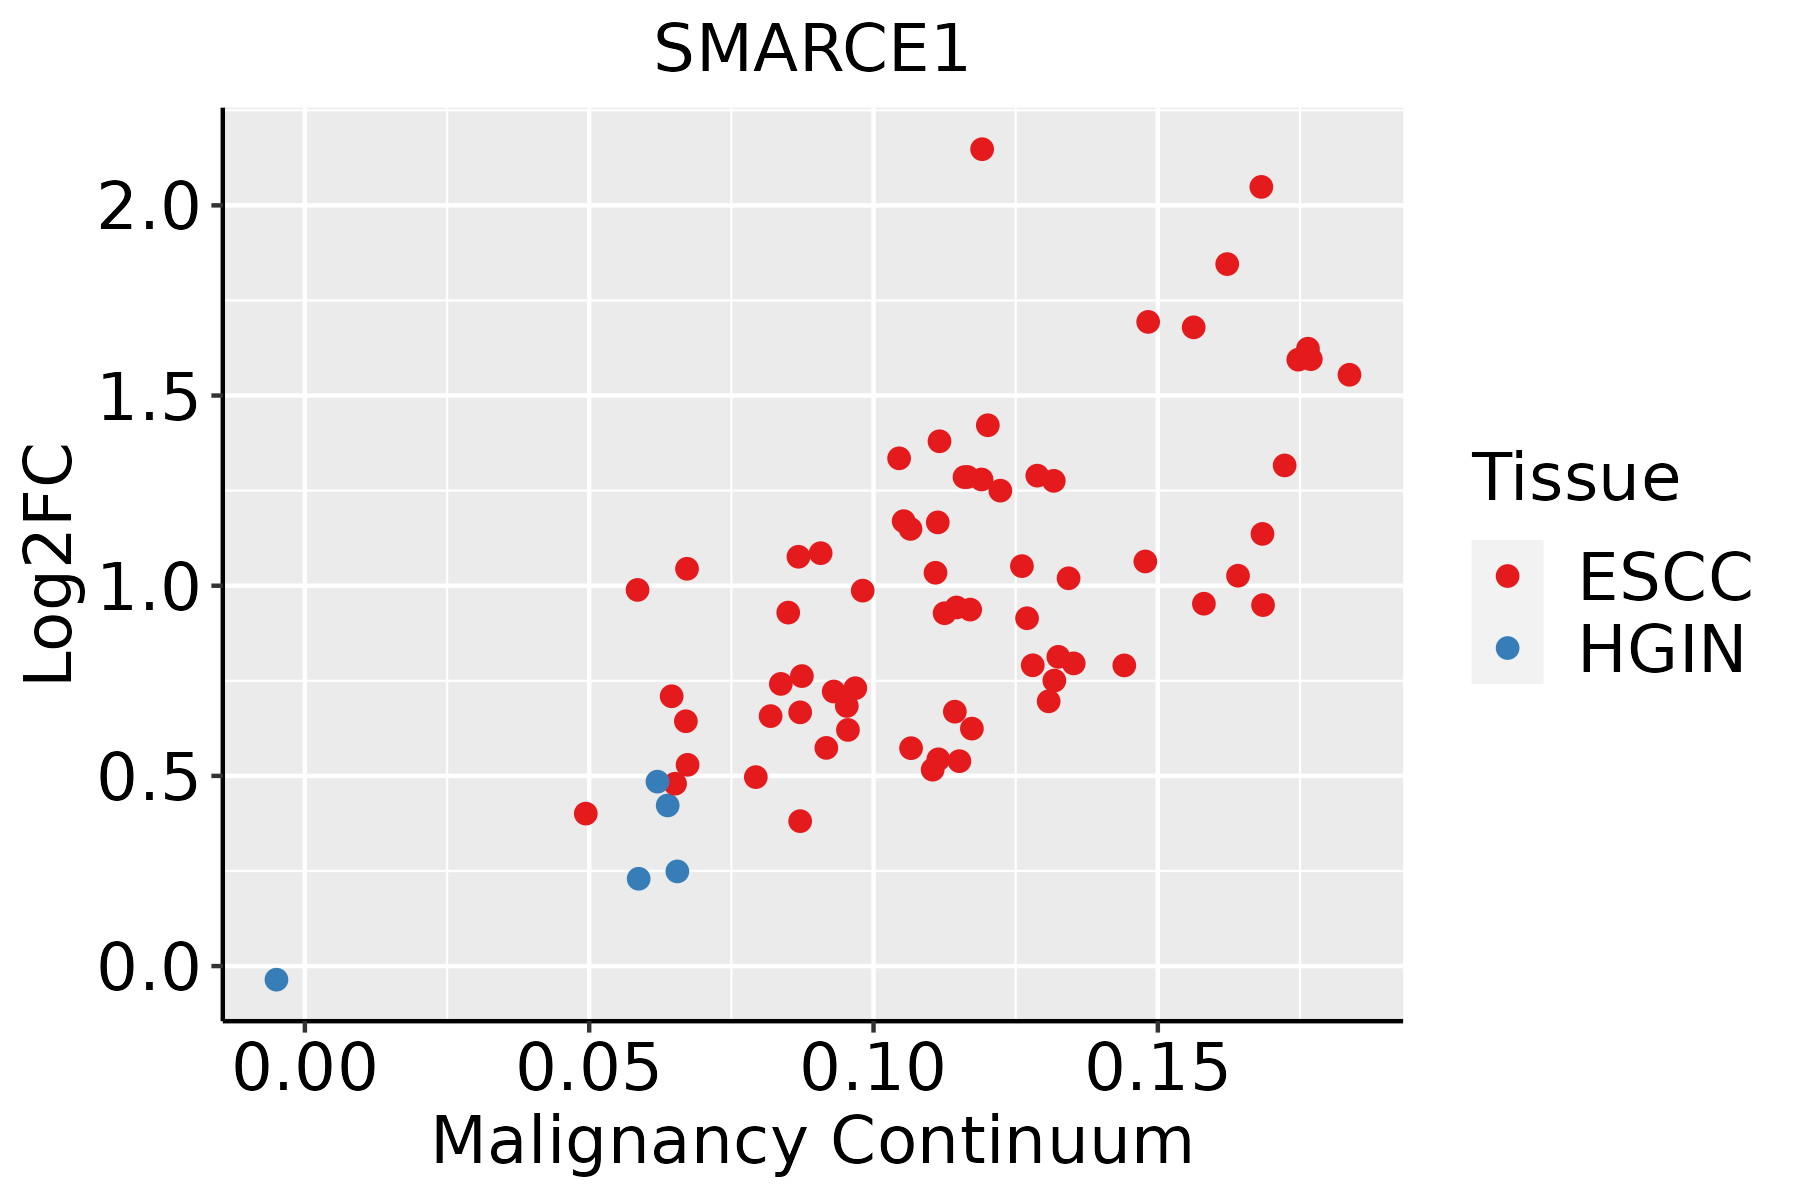 | ESCC: Esophageal squamous cell carcinoma |
| HGIN: High-grade intraepithelial neoplasias | ||
| LGIN: Low-grade intraepithelial neoplasias | ||
| Liver |  | HCC: Hepatocellular carcinoma |
| NAFLD: Non-alcoholic fatty liver disease | ||
| Oral Cavity |  | EOLP: Erosive Oral lichen planus |
| LP: leukoplakia | ||
| NEOLP: Non-erosive oral lichen planus | ||
| OSCC: Oral squamous cell carcinoma | ||
| Prostate | 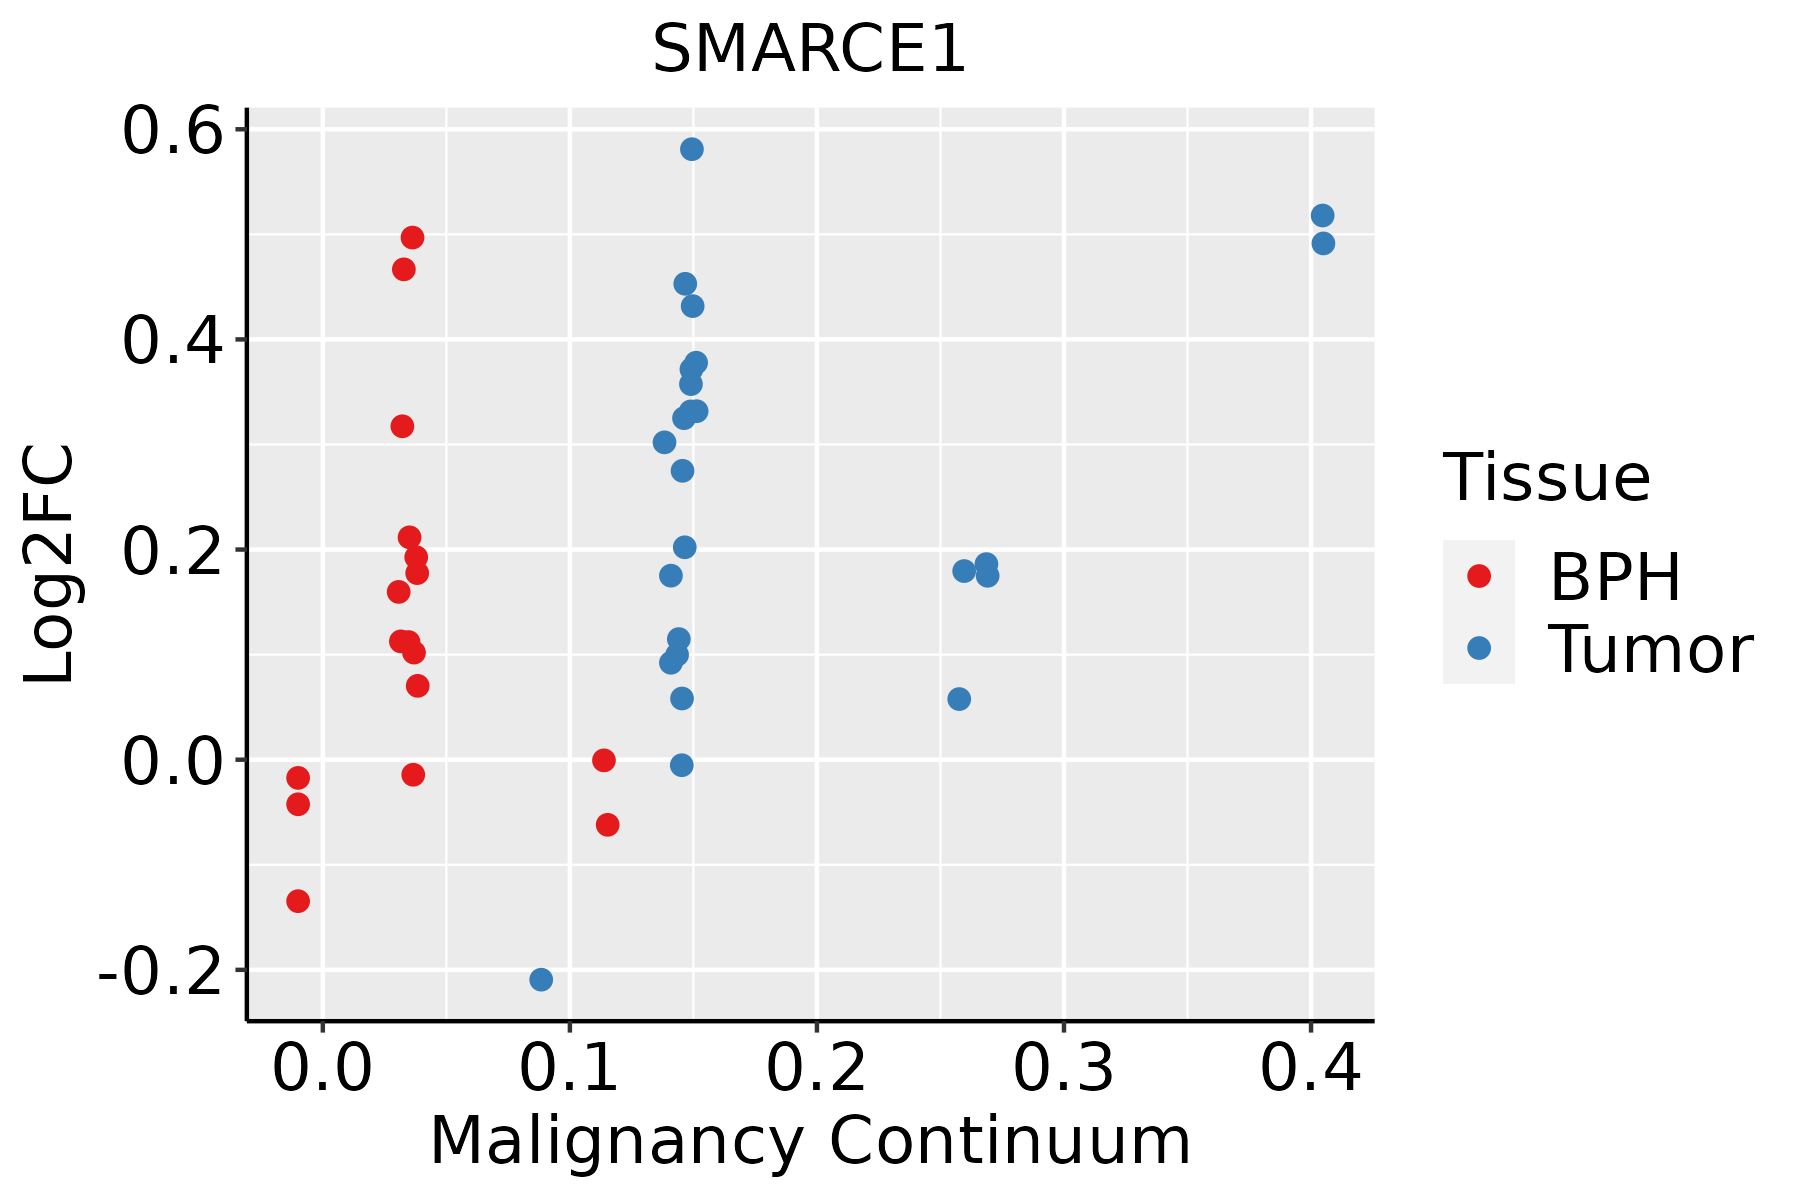 | BPH: Benign Prostatic Hyperplasia |
| Skin |  | AK: Actinic keratosis |
| cSCC: Cutaneous squamous cell carcinoma | ||
| SCCIS:squamous cell carcinoma in situ | ||
| Thyroid | 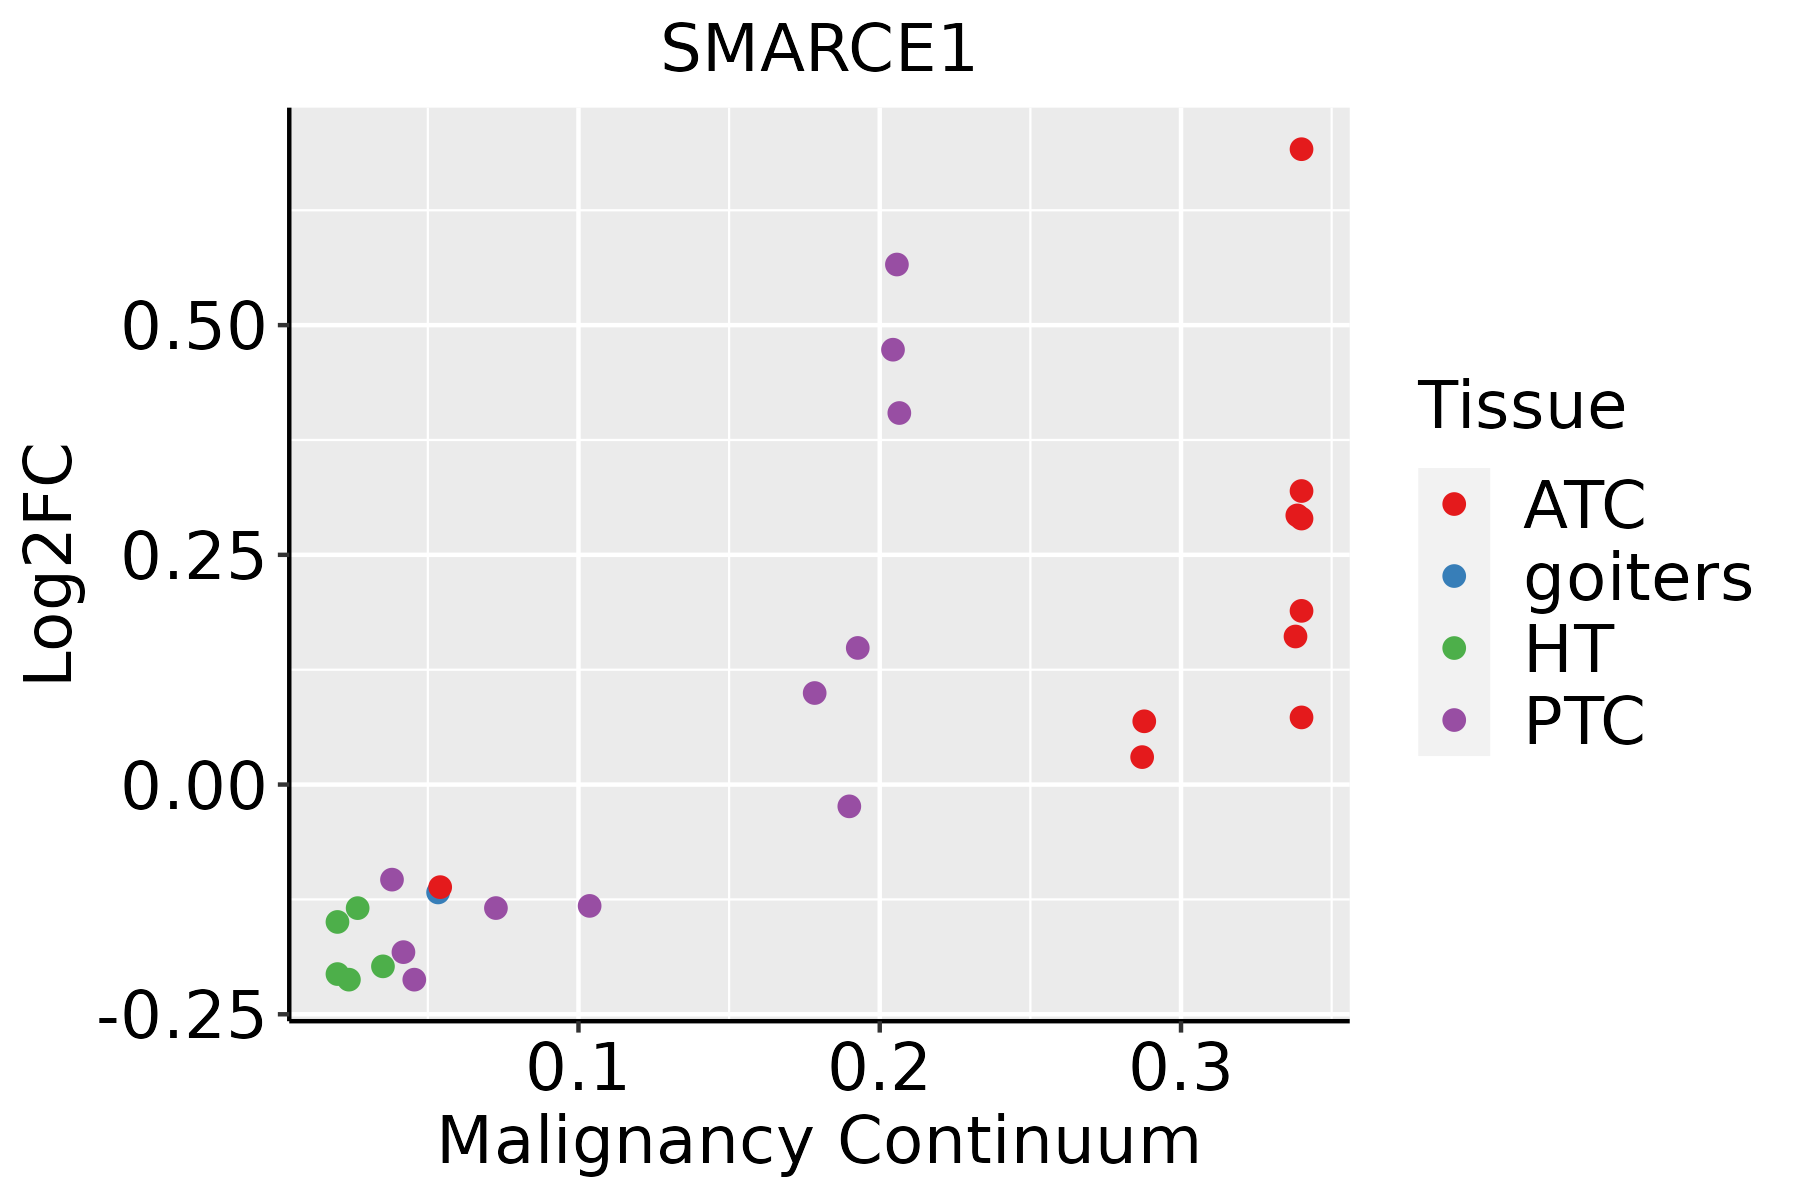 | ATC: Anaplastic thyroid cancer |
| HT: Hashimoto's thyroiditis | ||
| PTC: Papillary thyroid cancer |
| ∗log2FC in expression of this searched gene in stem-like cells from each diseased tissue sample relative to stem-like cells in normal samples in each tissue plotted against the malignancy continuum. Samples are colored based on if they are from different disease stage. |
Top |
Malignant transformation related pathway analysis |
| Find out the enriched GO biological processes and KEGG pathways involved in transition from healthy to precancer to cancer |
| Tissue | Disease Stage | Enriched GO biological Processes |
| Colorectum | AD |  |
| Colorectum | SER |  |
| Colorectum | MSS |  |
| Colorectum | MSI-H |  |
| Colorectum | FAP |  |
| ∗Top 15 enriched GO BP terms are showed in the bar plot of each disease state in each tissue. Each row represents a significant GO biological process which is colored according to the -log10(p.adjust). |
| Page: 1 2 3 4 5 6 7 8 9 |
| GO ID | Tissue | Disease Stage | Description | Gene Ratio | Bg Ratio | pvalue | p.adjust | Count |
| GO:00224119 | Breast | Precancer | cellular component disassembly | 44/1080 | 443/18723 | 3.17e-04 | 4.51e-03 | 44 |
| GO:00329865 | Breast | Precancer | protein-DNA complex disassembly | 6/1080 | 20/18723 | 6.99e-04 | 8.43e-03 | 6 |
| GO:003298612 | Breast | IDC | protein-DNA complex disassembly | 6/1434 | 20/18723 | 3.03e-03 | 2.60e-02 | 6 |
| GO:003298621 | Breast | DCIS | protein-DNA complex disassembly | 6/1390 | 20/18723 | 2.59e-03 | 2.30e-02 | 6 |
| GO:002241113 | Breast | DCIS | cellular component disassembly | 48/1390 | 443/18723 | 5.35e-03 | 3.92e-02 | 48 |
| GO:0022411 | Colorectum | AD | cellular component disassembly | 147/3918 | 443/18723 | 8.53e-10 | 6.76e-08 | 147 |
| GO:0032984 | Colorectum | AD | protein-containing complex disassembly | 81/3918 | 224/18723 | 9.41e-08 | 4.65e-06 | 81 |
| GO:0006325 | Colorectum | AD | chromatin organization | 119/3918 | 409/18723 | 4.85e-05 | 8.33e-04 | 119 |
| GO:0032986 | Colorectum | AD | protein-DNA complex disassembly | 12/3918 | 20/18723 | 1.60e-04 | 2.21e-03 | 12 |
| GO:0031498 | Colorectum | AD | chromatin disassembly | 11/3918 | 20/18723 | 8.39e-04 | 8.21e-03 | 11 |
| GO:0006337 | Colorectum | AD | nucleosome disassembly | 10/3918 | 18/18723 | 1.31e-03 | 1.15e-02 | 10 |
| GO:0006338 | Colorectum | AD | chromatin remodeling | 70/3918 | 255/18723 | 7.44e-03 | 4.53e-02 | 70 |
| GO:00224111 | Colorectum | SER | cellular component disassembly | 114/2897 | 443/18723 | 1.17e-08 | 9.59e-07 | 114 |
| GO:00329841 | Colorectum | SER | protein-containing complex disassembly | 61/2897 | 224/18723 | 4.17e-06 | 1.60e-04 | 61 |
| GO:00063251 | Colorectum | SER | chromatin organization | 89/2897 | 409/18723 | 4.15e-04 | 6.17e-03 | 89 |
| GO:00314981 | Colorectum | SER | chromatin disassembly | 8/2897 | 20/18723 | 7.14e-03 | 4.99e-02 | 8 |
| GO:00329861 | Colorectum | SER | protein-DNA complex disassembly | 8/2897 | 20/18723 | 7.14e-03 | 4.99e-02 | 8 |
| GO:00224112 | Colorectum | MSS | cellular component disassembly | 130/3467 | 443/18723 | 1.44e-08 | 8.46e-07 | 130 |
| GO:00329842 | Colorectum | MSS | protein-containing complex disassembly | 69/3467 | 224/18723 | 5.61e-06 | 1.50e-04 | 69 |
| GO:00329862 | Colorectum | MSS | protein-DNA complex disassembly | 12/3467 | 20/18723 | 4.55e-05 | 8.35e-04 | 12 |
| Page: 1 2 3 4 5 6 |
| Pathway ID | Tissue | Disease Stage | Description | Gene Ratio | Bg Ratio | pvalue | p.adjust | qvalue | Count |
| hsa0471418 | Breast | Precancer | Thermogenesis | 68/684 | 232/8465 | 4.40e-22 | 1.26e-20 | 9.69e-21 | 68 |
| hsa0471419 | Breast | Precancer | Thermogenesis | 68/684 | 232/8465 | 4.40e-22 | 1.26e-20 | 9.69e-21 | 68 |
| hsa0471424 | Breast | IDC | Thermogenesis | 75/867 | 232/8465 | 8.41e-21 | 3.04e-19 | 2.27e-19 | 75 |
| hsa0471434 | Breast | IDC | Thermogenesis | 75/867 | 232/8465 | 8.41e-21 | 3.04e-19 | 2.27e-19 | 75 |
| hsa0471443 | Breast | DCIS | Thermogenesis | 74/846 | 232/8465 | 8.72e-21 | 3.13e-19 | 2.30e-19 | 74 |
| hsa0471453 | Breast | DCIS | Thermogenesis | 74/846 | 232/8465 | 8.72e-21 | 3.13e-19 | 2.30e-19 | 74 |
| hsa04714 | Colorectum | AD | Thermogenesis | 120/2092 | 232/8465 | 2.76e-19 | 1.16e-17 | 7.37e-18 | 120 |
| hsa05225 | Colorectum | AD | Hepatocellular carcinoma | 59/2092 | 168/8465 | 1.50e-03 | 8.69e-03 | 5.54e-03 | 59 |
| hsa047141 | Colorectum | AD | Thermogenesis | 120/2092 | 232/8465 | 2.76e-19 | 1.16e-17 | 7.37e-18 | 120 |
| hsa052251 | Colorectum | AD | Hepatocellular carcinoma | 59/2092 | 168/8465 | 1.50e-03 | 8.69e-03 | 5.54e-03 | 59 |
| hsa047142 | Colorectum | SER | Thermogenesis | 106/1580 | 232/8465 | 1.15e-21 | 6.34e-20 | 4.61e-20 | 106 |
| hsa047143 | Colorectum | SER | Thermogenesis | 106/1580 | 232/8465 | 1.15e-21 | 6.34e-20 | 4.61e-20 | 106 |
| hsa047144 | Colorectum | MSS | Thermogenesis | 113/1875 | 232/8465 | 1.52e-19 | 4.62e-18 | 2.83e-18 | 113 |
| hsa052252 | Colorectum | MSS | Hepatocellular carcinoma | 56/1875 | 168/8465 | 5.04e-04 | 3.45e-03 | 2.11e-03 | 56 |
| hsa047145 | Colorectum | MSS | Thermogenesis | 113/1875 | 232/8465 | 1.52e-19 | 4.62e-18 | 2.83e-18 | 113 |
| hsa052253 | Colorectum | MSS | Hepatocellular carcinoma | 56/1875 | 168/8465 | 5.04e-04 | 3.45e-03 | 2.11e-03 | 56 |
| hsa047146 | Colorectum | MSI-H | Thermogenesis | 56/797 | 232/8465 | 1.79e-11 | 4.14e-10 | 3.47e-10 | 56 |
| hsa047147 | Colorectum | MSI-H | Thermogenesis | 56/797 | 232/8465 | 1.79e-11 | 4.14e-10 | 3.47e-10 | 56 |
| hsa0471426 | Endometrium | AEH | Thermogenesis | 85/1197 | 232/8465 | 3.44e-18 | 9.33e-17 | 6.83e-17 | 85 |
| hsa04714111 | Endometrium | AEH | Thermogenesis | 85/1197 | 232/8465 | 3.44e-18 | 9.33e-17 | 6.83e-17 | 85 |
| Page: 1 2 3 |
Top |
Cell-cell communication analysis |
| Identification of potential cell-cell interactions between two cell types and their ligand-receptor pairs for different disease states |
| Ligand | Receptor | LRpair | Pathway | Tissue | Disease Stage |
| Page: 1 |
Top |
Single-cell gene regulatory network inference analysis |
| Find out the significant the regulons (TFs) and the target genes of each regulon across cell types for different disease states |
| TF | Cell Type | Tissue | Disease Stage | Target Gene | RSS | Regulon Activity |
| ∗The dot plots of a searched regulon are shown for all cell subpopulations in each disease state of each tissue based on the regulon specific score inferred using pySCENIC and by calculating the average expression. |
| Page: 1 |
Top |
Somatic mutation of malignant transformation related genes |
| Annotation of somatic variants for genes involved in malignant transformation |
| Hugo Symbol | Variant Class | Variant Classification | dbSNP RS | HGVSc | HGVSp | HGVSp Short | SWISSPROT | BIOTYPE | SIFT | PolyPhen | Tumor Sample Barcode | Tissue | Histology | Sex | Age | Stage | Therapy Types | Drugs | Outcome |
| SMARCE1 | SNV | Missense_Mutation | c.1045N>A | p.Glu349Lys | p.E349K | Q969G3 | protein_coding | deleterious(0.01) | benign(0.033) | TCGA-5L-AAT1-01 | Breast | breast invasive carcinoma | Female | <65 | III/IV | Hormone Therapy | letrozol | SD | |
| SMARCE1 | SNV | Missense_Mutation | c.1124N>T | p.Asp375Val | p.D375V | Q969G3 | protein_coding | deleterious_low_confidence(0.01) | benign(0.151) | TCGA-A8-A08R-01 | Breast | breast invasive carcinoma | Female | <65 | I/II | Unknown | Unknown | SD | |
| SMARCE1 | SNV | Missense_Mutation | rs761299232 | c.602N>A | p.Arg201His | p.R201H | Q969G3 | protein_coding | tolerated(0.05) | benign(0.005) | TCGA-AO-A128-01 | Breast | breast invasive carcinoma | Female | <65 | I/II | Chemotherapy | doxorubicin | SD |
| SMARCE1 | SNV | Missense_Mutation | c.650N>T | p.Ser217Leu | p.S217L | Q969G3 | protein_coding | deleterious(0) | possibly_damaging(0.681) | TCGA-BH-A0HF-01 | Breast | breast invasive carcinoma | Female | >=65 | I/II | Hormone Therapy | arimidex | SD | |
| SMARCE1 | insertion | Nonsense_Mutation | novel | c.1132_1133insGACAATAGCTTTAAAATACCTCCTTGAAGCCATG | p.Ala378GlyfsTer3 | p.A378Gfs*3 | Q969G3 | protein_coding | TCGA-BH-A0HF-01 | Breast | breast invasive carcinoma | Female | >=65 | I/II | Hormone Therapy | arimidex | SD | ||
| SMARCE1 | SNV | Missense_Mutation | c.1072N>A | p.Glu358Lys | p.E358K | Q969G3 | protein_coding | deleterious(0.03) | possibly_damaging(0.5) | TCGA-IR-A3LA-01 | Cervix | cervical & endocervical cancer | Female | <65 | I/II | Chemotherapy | cisplatin | CR | |
| SMARCE1 | SNV | Missense_Mutation | c.934N>A | p.Glu312Lys | p.E312K | Q969G3 | protein_coding | tolerated(0.22) | benign(0) | TCGA-IR-A3LA-01 | Cervix | cervical & endocervical cancer | Female | <65 | I/II | Chemotherapy | cisplatin | CR | |
| SMARCE1 | SNV | Missense_Mutation | c.890G>A | p.Arg297His | p.R297H | Q969G3 | protein_coding | tolerated(0.07) | probably_damaging(0.98) | TCGA-AA-3833-01 | Colorectum | colon adenocarcinoma | Female | <65 | I/II | Unknown | Unknown | SD | |
| SMARCE1 | SNV | Missense_Mutation | c.173C>T | p.Thr58Met | p.T58M | Q969G3 | protein_coding | deleterious(0.01) | possibly_damaging(0.548) | TCGA-AA-A01R-01 | Colorectum | colon adenocarcinoma | Male | <65 | III/IV | Chemotherapy | 5-fluorouracil | PD | |
| SMARCE1 | SNV | Missense_Mutation | c.601N>T | p.Arg201Cys | p.R201C | Q969G3 | protein_coding | deleterious(0.04) | benign(0.005) | TCGA-AZ-6598-01 | Colorectum | colon adenocarcinoma | Female | >=65 | I/II | Unknown | Unknown | SD |
| Page: 1 2 3 4 |
Top |
Related drugs of malignant transformation related genes |
| Identification of chemicals and drugs interact with genes involved in malignant transfromation |
| (DGIdb 4.0) |
| Entrez ID | Symbol | Category | Interaction Types | Drug Claim Name | Drug Name | PMIDs |
| Page: 1 |

Copyright 2023-Present -The University of Texas Health Science Center at Houston |