
|
|||||
|
 | |
| |
| |
| |
| |
| |
|
Gene: SMARCD2 |
Gene summary for SMARCD2 |
| Gene information | Species | Human | Gene symbol | SMARCD2 | Gene ID | 6603 |
| Gene name | SWI/SNF related, matrix associated, actin dependent regulator of chromatin, subfamily d, member 2 | |
| Gene Alias | BAF60B | |
| Cytomap | 17q23.3 | |
| Gene Type | protein-coding | GO ID | GO:0006139 | UniProtAcc | Q92925 |
Top |
Malignant transformation analysis |
| Identification of the aberrant gene expression in precancerous and cancerous lesions by comparing the gene expression of stem-like cells in diseased tissues with normal stem cells |
| Entrez ID | Symbol | Replicates | Species | Organ | Tissue | Adj P-value | Log2FC | Malignancy |
| 6603 | SMARCD2 | HTA11_3410_2000001011 | Human | Colorectum | AD | 2.44e-04 | 2.55e-01 | 0.0155 |
| 6603 | SMARCD2 | HTA11_2487_2000001011 | Human | Colorectum | SER | 2.14e-09 | 4.69e-01 | -0.1808 |
| 6603 | SMARCD2 | HTA11_1938_2000001011 | Human | Colorectum | AD | 1.05e-10 | 5.48e-01 | -0.0811 |
| 6603 | SMARCD2 | HTA11_78_2000001011 | Human | Colorectum | AD | 4.34e-05 | 4.07e-01 | -0.1088 |
| 6603 | SMARCD2 | HTA11_347_2000001011 | Human | Colorectum | AD | 1.76e-11 | 4.38e-01 | -0.1954 |
| 6603 | SMARCD2 | HTA11_411_2000001011 | Human | Colorectum | SER | 1.85e-03 | 7.01e-01 | -0.2602 |
| 6603 | SMARCD2 | HTA11_3361_2000001011 | Human | Colorectum | AD | 4.99e-03 | 3.66e-01 | -0.1207 |
| 6603 | SMARCD2 | HTA11_83_2000001011 | Human | Colorectum | SER | 3.19e-05 | 4.37e-01 | -0.1526 |
| 6603 | SMARCD2 | HTA11_696_2000001011 | Human | Colorectum | AD | 1.37e-22 | 6.44e-01 | -0.1464 |
| 6603 | SMARCD2 | HTA11_866_2000001011 | Human | Colorectum | AD | 5.60e-07 | 3.33e-01 | -0.1001 |
| 6603 | SMARCD2 | HTA11_1391_2000001011 | Human | Colorectum | AD | 1.80e-20 | 7.92e-01 | -0.059 |
| 6603 | SMARCD2 | HTA11_5212_2000001011 | Human | Colorectum | AD | 1.05e-03 | 4.58e-01 | -0.2061 |
| 6603 | SMARCD2 | HTA11_546_2000001011 | Human | Colorectum | AD | 2.47e-03 | 4.04e-01 | -0.0842 |
| 6603 | SMARCD2 | HTA11_7862_2000001011 | Human | Colorectum | AD | 1.79e-04 | 4.73e-01 | -0.0179 |
| 6603 | SMARCD2 | HTA11_866_3004761011 | Human | Colorectum | AD | 1.61e-19 | 6.86e-01 | 0.096 |
| 6603 | SMARCD2 | HTA11_4255_2000001011 | Human | Colorectum | SER | 2.71e-03 | 4.81e-01 | 0.0446 |
| 6603 | SMARCD2 | HTA11_8622_2000001021 | Human | Colorectum | SER | 1.41e-06 | 6.49e-01 | 0.0528 |
| 6603 | SMARCD2 | HTA11_7663_2000001011 | Human | Colorectum | SER | 1.32e-02 | 5.79e-01 | 0.0131 |
| 6603 | SMARCD2 | HTA11_10623_2000001011 | Human | Colorectum | AD | 1.19e-04 | 5.52e-01 | -0.0177 |
| 6603 | SMARCD2 | HTA11_6801_2000001011 | Human | Colorectum | SER | 2.56e-06 | 7.78e-01 | 0.0171 |
| Page: 1 2 3 4 5 6 |
| Tissue | Expression Dynamics | Abbreviation |
| Colorectum (GSE201348) |  | FAP: Familial adenomatous polyposis |
| CRC: Colorectal cancer | ||
| Colorectum (HTA11) | 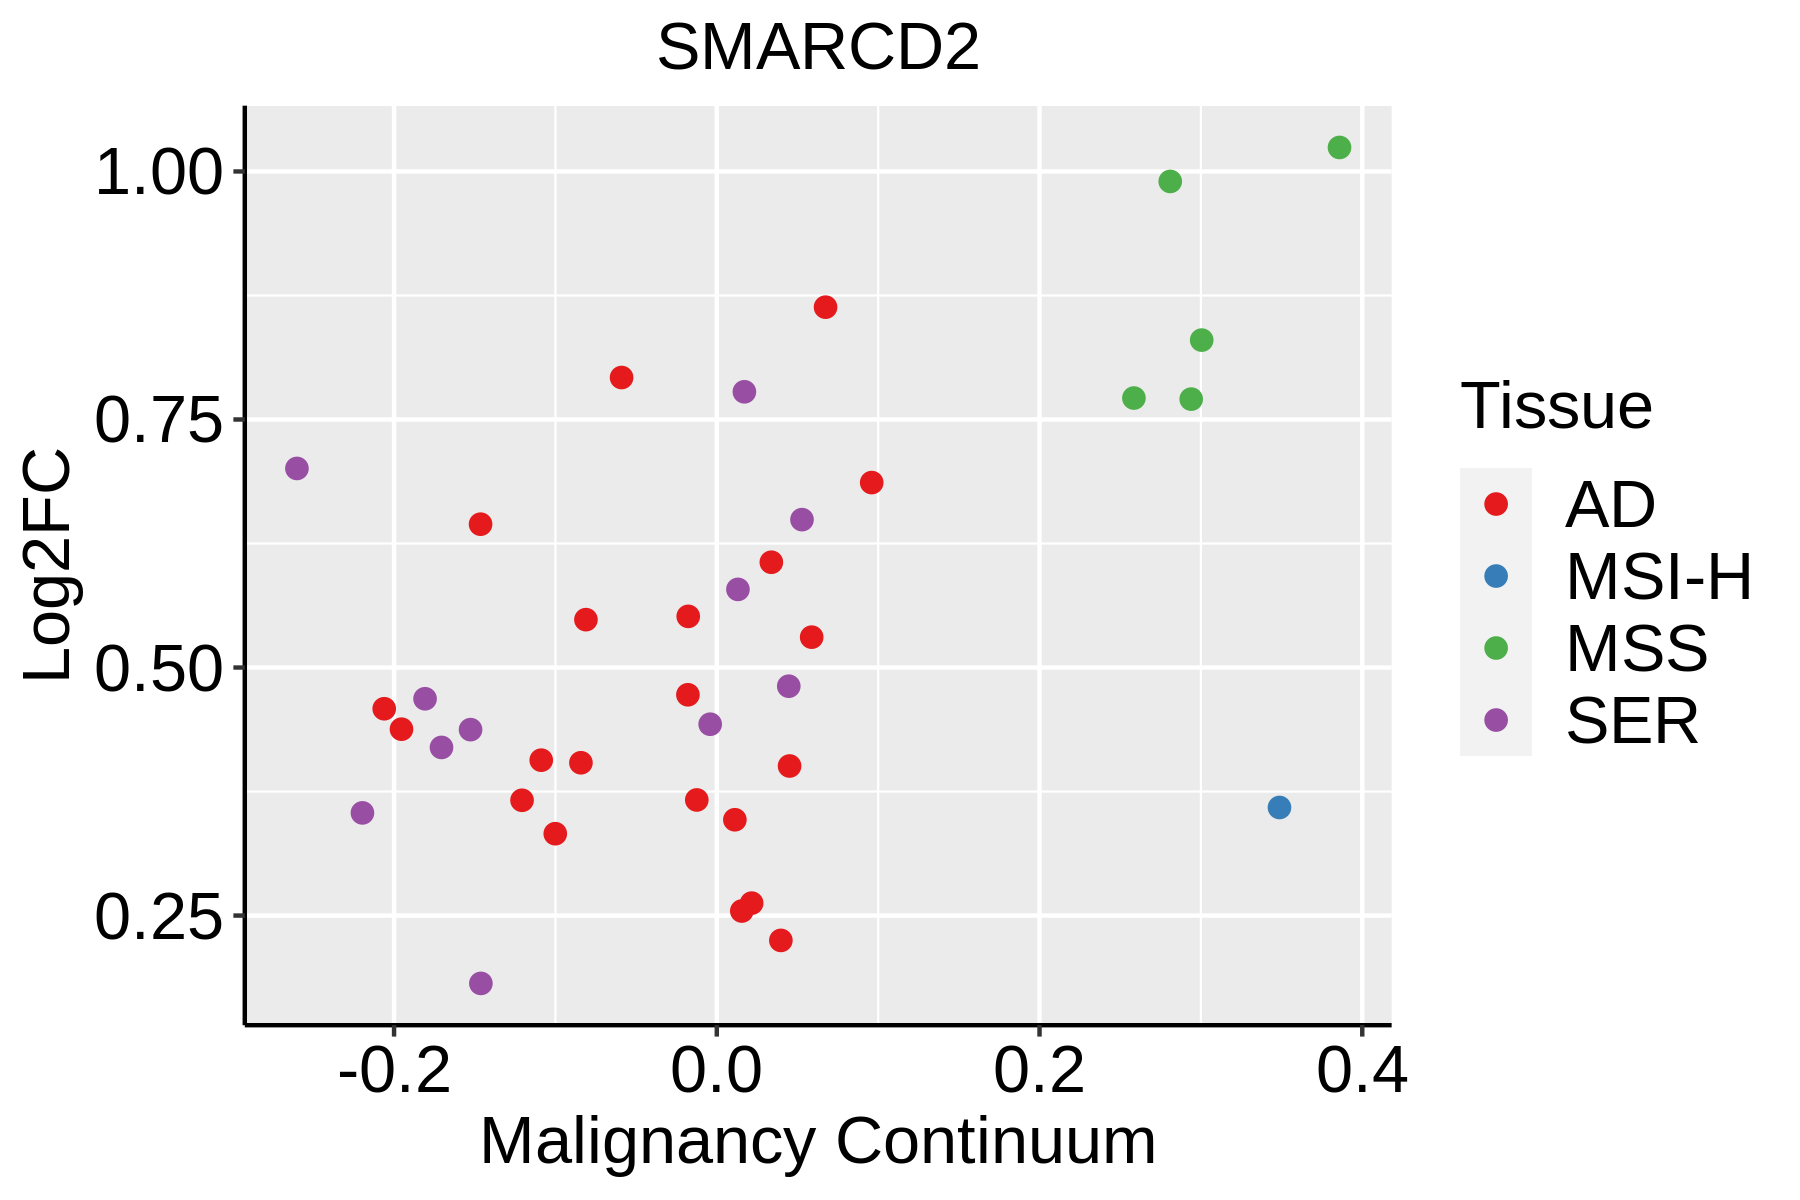 | AD: Adenomas |
| SER: Sessile serrated lesions | ||
| MSI-H: Microsatellite-high colorectal cancer | ||
| MSS: Microsatellite stable colorectal cancer | ||
| Esophagus |  | ESCC: Esophageal squamous cell carcinoma |
| HGIN: High-grade intraepithelial neoplasias | ||
| LGIN: Low-grade intraepithelial neoplasias | ||
| Liver |  | HCC: Hepatocellular carcinoma |
| NAFLD: Non-alcoholic fatty liver disease | ||
| Oral Cavity | 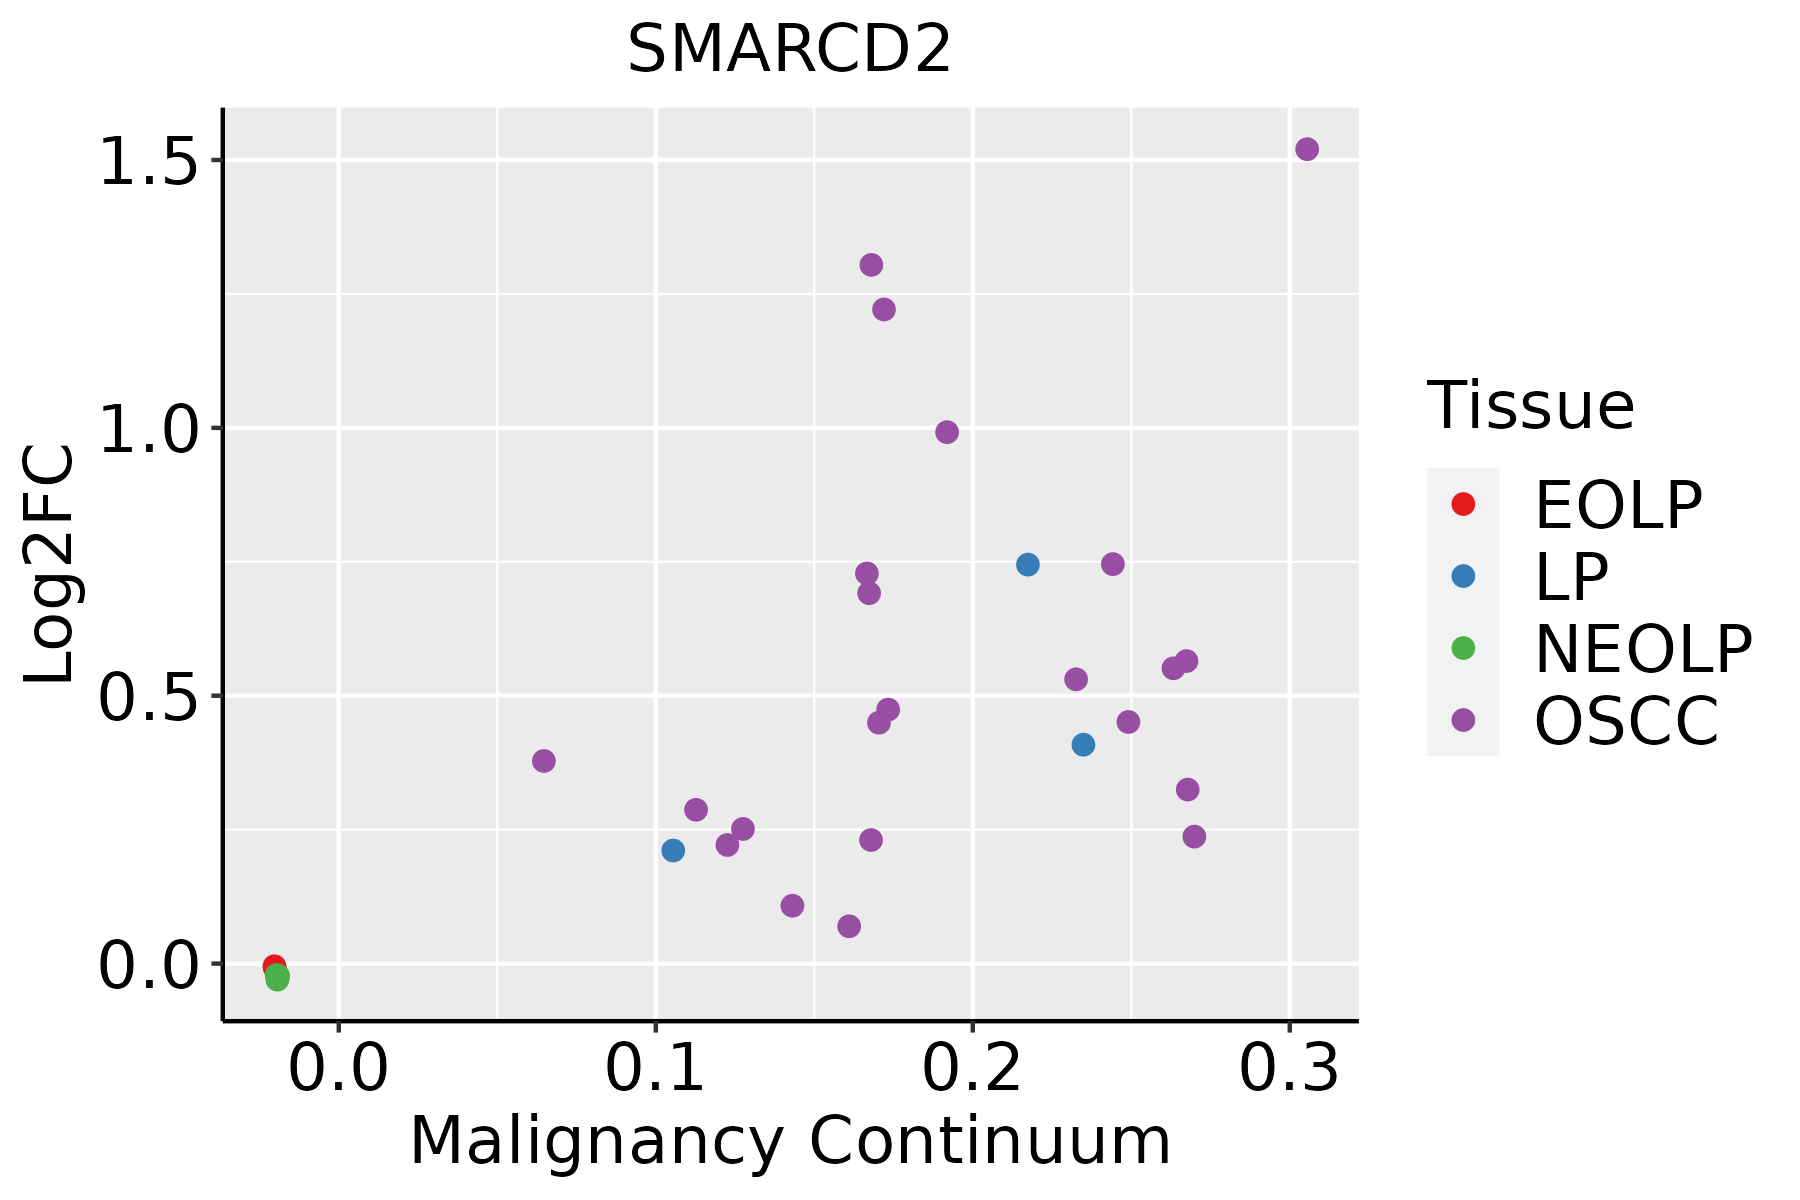 | EOLP: Erosive Oral lichen planus |
| LP: leukoplakia | ||
| NEOLP: Non-erosive oral lichen planus | ||
| OSCC: Oral squamous cell carcinoma | ||
| Prostate | 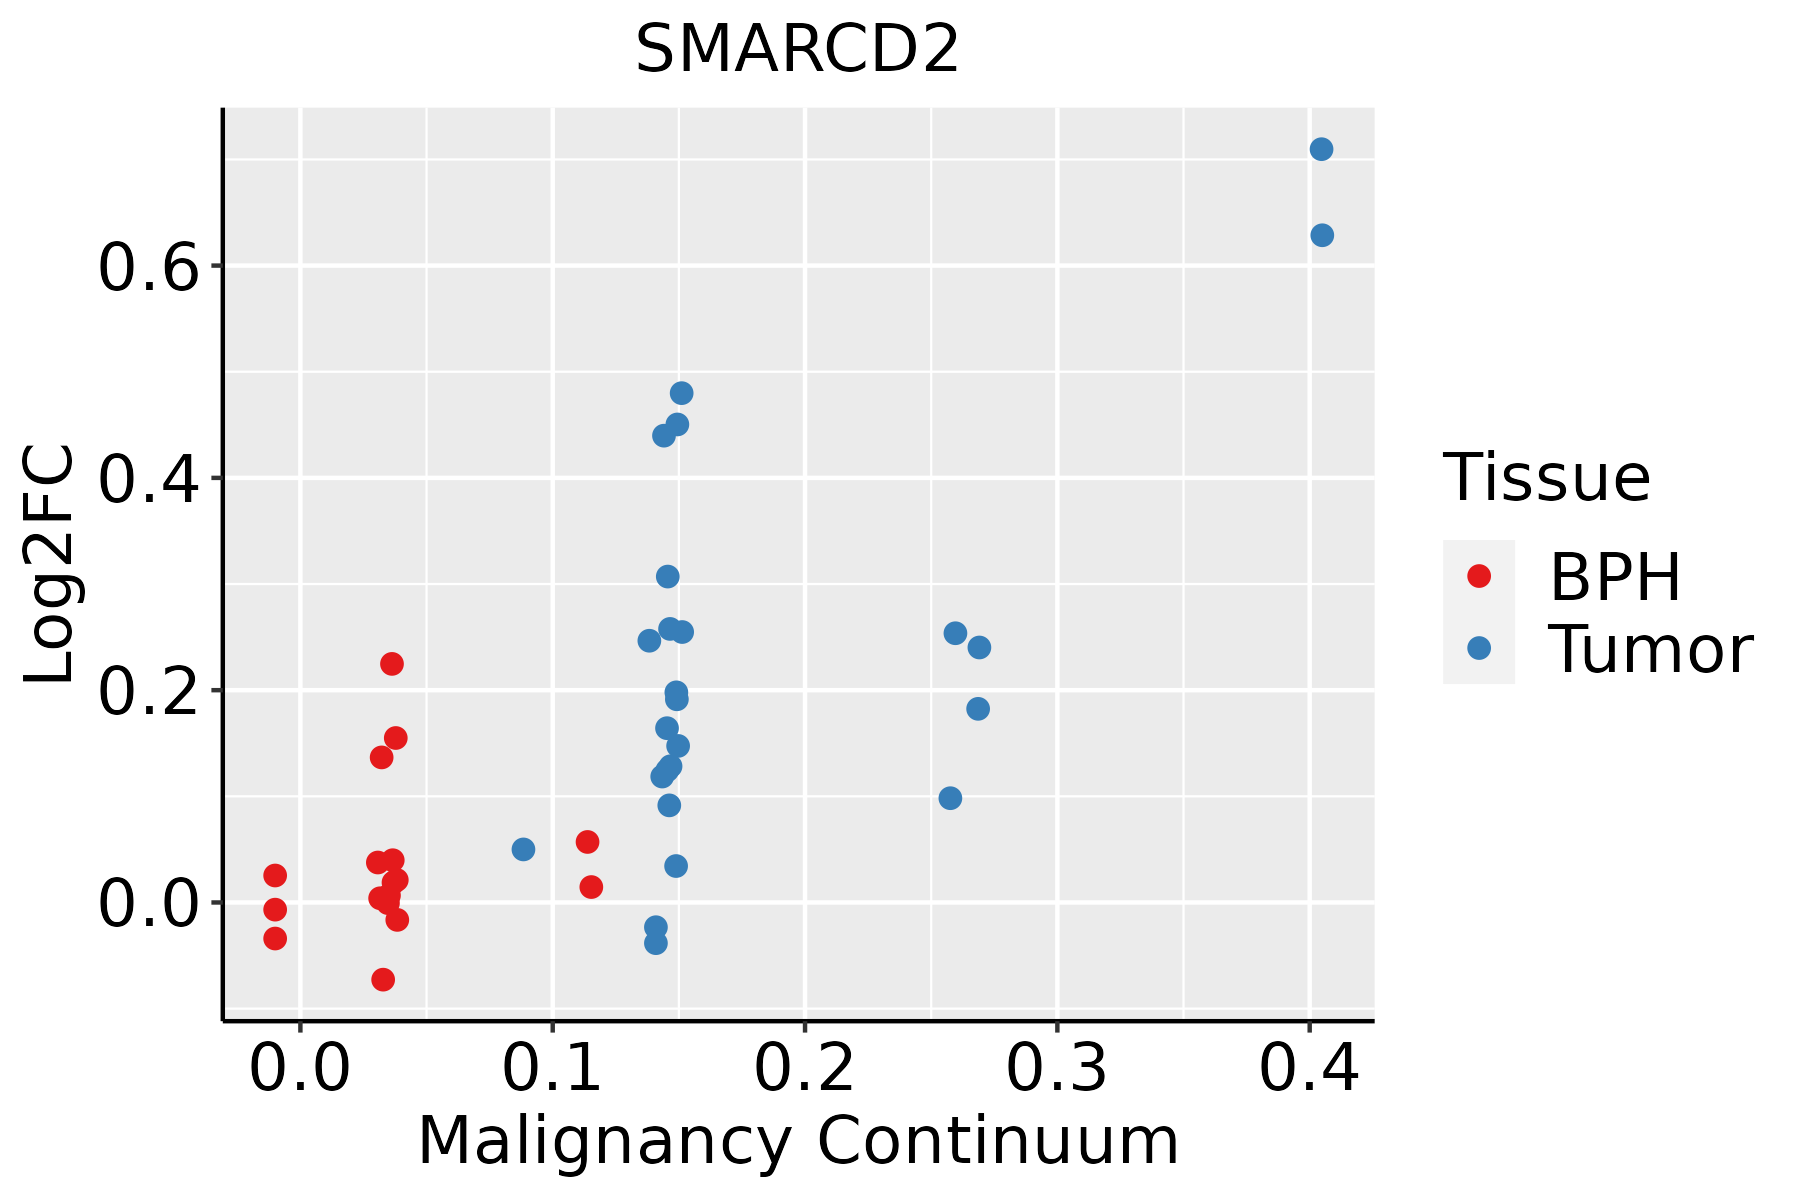 | BPH: Benign Prostatic Hyperplasia |
| Skin |  | AK: Actinic keratosis |
| cSCC: Cutaneous squamous cell carcinoma | ||
| SCCIS:squamous cell carcinoma in situ |
| ∗log2FC in expression of this searched gene in stem-like cells from each diseased tissue sample relative to stem-like cells in normal samples in each tissue plotted against the malignancy continuum. Samples are colored based on if they are from different disease stage. |
Top |
Malignant transformation related pathway analysis |
| Find out the enriched GO biological processes and KEGG pathways involved in transition from healthy to precancer to cancer |
| Tissue | Disease Stage | Enriched GO biological Processes |
| Colorectum | AD |  |
| Colorectum | SER |  |
| Colorectum | MSS |  |
| Colorectum | MSI-H |  |
| Colorectum | FAP |  |
| ∗Top 15 enriched GO BP terms are showed in the bar plot of each disease state in each tissue. Each row represents a significant GO biological process which is colored according to the -log10(p.adjust). |
| Page: 1 2 3 4 5 6 7 8 9 |
| GO ID | Tissue | Disease Stage | Description | Gene Ratio | Bg Ratio | pvalue | p.adjust | Count |
| GO:0022411 | Colorectum | AD | cellular component disassembly | 147/3918 | 443/18723 | 8.53e-10 | 6.76e-08 | 147 |
| GO:0032984 | Colorectum | AD | protein-containing complex disassembly | 81/3918 | 224/18723 | 9.41e-08 | 4.65e-06 | 81 |
| GO:0006325 | Colorectum | AD | chromatin organization | 119/3918 | 409/18723 | 4.85e-05 | 8.33e-04 | 119 |
| GO:0032986 | Colorectum | AD | protein-DNA complex disassembly | 12/3918 | 20/18723 | 1.60e-04 | 2.21e-03 | 12 |
| GO:0031498 | Colorectum | AD | chromatin disassembly | 11/3918 | 20/18723 | 8.39e-04 | 8.21e-03 | 11 |
| GO:0006337 | Colorectum | AD | nucleosome disassembly | 10/3918 | 18/18723 | 1.31e-03 | 1.15e-02 | 10 |
| GO:0006338 | Colorectum | AD | chromatin remodeling | 70/3918 | 255/18723 | 7.44e-03 | 4.53e-02 | 70 |
| GO:00224111 | Colorectum | SER | cellular component disassembly | 114/2897 | 443/18723 | 1.17e-08 | 9.59e-07 | 114 |
| GO:00329841 | Colorectum | SER | protein-containing complex disassembly | 61/2897 | 224/18723 | 4.17e-06 | 1.60e-04 | 61 |
| GO:00063251 | Colorectum | SER | chromatin organization | 89/2897 | 409/18723 | 4.15e-04 | 6.17e-03 | 89 |
| GO:00314981 | Colorectum | SER | chromatin disassembly | 8/2897 | 20/18723 | 7.14e-03 | 4.99e-02 | 8 |
| GO:00329861 | Colorectum | SER | protein-DNA complex disassembly | 8/2897 | 20/18723 | 7.14e-03 | 4.99e-02 | 8 |
| GO:00224112 | Colorectum | MSS | cellular component disassembly | 130/3467 | 443/18723 | 1.44e-08 | 8.46e-07 | 130 |
| GO:00329842 | Colorectum | MSS | protein-containing complex disassembly | 69/3467 | 224/18723 | 5.61e-06 | 1.50e-04 | 69 |
| GO:00329862 | Colorectum | MSS | protein-DNA complex disassembly | 12/3467 | 20/18723 | 4.55e-05 | 8.35e-04 | 12 |
| GO:00063252 | Colorectum | MSS | chromatin organization | 107/3467 | 409/18723 | 7.22e-05 | 1.21e-03 | 107 |
| GO:00314982 | Colorectum | MSS | chromatin disassembly | 11/3467 | 20/18723 | 2.77e-04 | 3.67e-03 | 11 |
| GO:00063371 | Colorectum | MSS | nucleosome disassembly | 10/3467 | 18/18723 | 4.76e-04 | 5.58e-03 | 10 |
| GO:0022411111 | Esophagus | ESCC | cellular component disassembly | 305/8552 | 443/18723 | 1.94e-23 | 4.57e-21 | 305 |
| GO:003298416 | Esophagus | ESCC | protein-containing complex disassembly | 151/8552 | 224/18723 | 3.45e-11 | 1.15e-09 | 151 |
| Page: 1 2 3 |
| Pathway ID | Tissue | Disease Stage | Description | Gene Ratio | Bg Ratio | pvalue | p.adjust | qvalue | Count |
| hsa04714 | Colorectum | AD | Thermogenesis | 120/2092 | 232/8465 | 2.76e-19 | 1.16e-17 | 7.37e-18 | 120 |
| hsa05225 | Colorectum | AD | Hepatocellular carcinoma | 59/2092 | 168/8465 | 1.50e-03 | 8.69e-03 | 5.54e-03 | 59 |
| hsa047141 | Colorectum | AD | Thermogenesis | 120/2092 | 232/8465 | 2.76e-19 | 1.16e-17 | 7.37e-18 | 120 |
| hsa052251 | Colorectum | AD | Hepatocellular carcinoma | 59/2092 | 168/8465 | 1.50e-03 | 8.69e-03 | 5.54e-03 | 59 |
| hsa047142 | Colorectum | SER | Thermogenesis | 106/1580 | 232/8465 | 1.15e-21 | 6.34e-20 | 4.61e-20 | 106 |
| hsa047143 | Colorectum | SER | Thermogenesis | 106/1580 | 232/8465 | 1.15e-21 | 6.34e-20 | 4.61e-20 | 106 |
| hsa047144 | Colorectum | MSS | Thermogenesis | 113/1875 | 232/8465 | 1.52e-19 | 4.62e-18 | 2.83e-18 | 113 |
| hsa052252 | Colorectum | MSS | Hepatocellular carcinoma | 56/1875 | 168/8465 | 5.04e-04 | 3.45e-03 | 2.11e-03 | 56 |
| hsa047145 | Colorectum | MSS | Thermogenesis | 113/1875 | 232/8465 | 1.52e-19 | 4.62e-18 | 2.83e-18 | 113 |
| hsa052253 | Colorectum | MSS | Hepatocellular carcinoma | 56/1875 | 168/8465 | 5.04e-04 | 3.45e-03 | 2.11e-03 | 56 |
| hsa04714211 | Esophagus | ESCC | Thermogenesis | 163/4205 | 232/8465 | 9.22e-11 | 1.14e-09 | 5.86e-10 | 163 |
| hsa0522518 | Esophagus | ESCC | Hepatocellular carcinoma | 109/4205 | 168/8465 | 4.27e-05 | 1.88e-04 | 9.64e-05 | 109 |
| hsa04714310 | Esophagus | ESCC | Thermogenesis | 163/4205 | 232/8465 | 9.22e-11 | 1.14e-09 | 5.86e-10 | 163 |
| hsa0522519 | Esophagus | ESCC | Hepatocellular carcinoma | 109/4205 | 168/8465 | 4.27e-05 | 1.88e-04 | 9.64e-05 | 109 |
| hsa0471422 | Liver | HCC | Thermogenesis | 170/4020 | 232/8465 | 5.36e-16 | 2.25e-14 | 1.25e-14 | 170 |
| hsa052258 | Liver | HCC | Hepatocellular carcinoma | 106/4020 | 168/8465 | 2.87e-05 | 1.85e-04 | 1.03e-04 | 106 |
| hsa0471432 | Liver | HCC | Thermogenesis | 170/4020 | 232/8465 | 5.36e-16 | 2.25e-14 | 1.25e-14 | 170 |
| hsa0522511 | Liver | HCC | Hepatocellular carcinoma | 106/4020 | 168/8465 | 2.87e-05 | 1.85e-04 | 1.03e-04 | 106 |
| hsa0471430 | Oral cavity | OSCC | Thermogenesis | 138/3704 | 232/8465 | 7.67e-07 | 4.35e-06 | 2.22e-06 | 138 |
| hsa0522516 | Oral cavity | OSCC | Hepatocellular carcinoma | 97/3704 | 168/8465 | 1.63e-04 | 5.52e-04 | 2.81e-04 | 97 |
| Page: 1 2 |
Top |
Cell-cell communication analysis |
| Identification of potential cell-cell interactions between two cell types and their ligand-receptor pairs for different disease states |
| Ligand | Receptor | LRpair | Pathway | Tissue | Disease Stage |
| Page: 1 |
Top |
Single-cell gene regulatory network inference analysis |
| Find out the significant the regulons (TFs) and the target genes of each regulon across cell types for different disease states |
| TF | Cell Type | Tissue | Disease Stage | Target Gene | RSS | Regulon Activity |
| ∗The dot plots of a searched regulon are shown for all cell subpopulations in each disease state of each tissue based on the regulon specific score inferred using pySCENIC and by calculating the average expression. |
| Page: 1 |
Top |
Somatic mutation of malignant transformation related genes |
| Annotation of somatic variants for genes involved in malignant transformation |
| Hugo Symbol | Variant Class | Variant Classification | dbSNP RS | HGVSc | HGVSp | HGVSp Short | SWISSPROT | BIOTYPE | SIFT | PolyPhen | Tumor Sample Barcode | Tissue | Histology | Sex | Age | Stage | Therapy Types | Drugs | Outcome |
| SMARCD2 | SNV | Missense_Mutation | c.1268T>A | p.Phe423Tyr | p.F423Y | Q92925 | protein_coding | tolerated(0.05) | probably_damaging(0.991) | TCGA-A8-A09Q-01 | Breast | breast invasive carcinoma | Female | >=65 | III/IV | Hormone Therapy | anastrozole | SD | |
| SMARCD2 | insertion | Frame_Shift_Ins | novel | c.1320_1321insTTCCTAGCCTTTCTAAACCAAAGTTCTTTGCCATTCCTACAAGCCCA | p.His441PhefsTer26 | p.H441Ffs*26 | Q92925 | protein_coding | TCGA-B6-A0IN-01 | Breast | breast invasive carcinoma | Female | <65 | I/II | Unknown | Unknown | PD | ||
| SMARCD2 | SNV | Missense_Mutation | c.417G>C | p.Lys139Asn | p.K139N | Q92925 | protein_coding | deleterious(0) | possibly_damaging(0.764) | TCGA-IR-A3LH-01 | Cervix | cervical & endocervical cancer | Female | <65 | I/II | Chemotherapy | cisplatin | CR | |
| SMARCD2 | SNV | Missense_Mutation | rs757140754 | c.1417C>T | p.Arg473Cys | p.R473C | Q92925 | protein_coding | tolerated(0.06) | benign(0.003) | TCGA-A6-6780-01 | Colorectum | colon adenocarcinoma | Male | >=65 | I/II | Unknown | Unknown | SD |
| SMARCD2 | SNV | Missense_Mutation | c.1009N>T | p.Leu337Phe | p.L337F | Q92925 | protein_coding | deleterious(0.03) | probably_damaging(0.926) | TCGA-AD-6895-01 | Colorectum | colon adenocarcinoma | Male | >=65 | III/IV | Unknown | Unknown | SD | |
| SMARCD2 | SNV | Missense_Mutation | rs750388563 | c.1300N>A | p.Ala434Thr | p.A434T | Q92925 | protein_coding | tolerated(0.22) | benign(0.022) | TCGA-AY-4071-01 | Colorectum | colon adenocarcinoma | Female | <65 | I/II | Unknown | Unknown | SD |
| SMARCD2 | SNV | Missense_Mutation | rs866391405 | c.1100N>A | p.Arg367Gln | p.R367Q | Q92925 | protein_coding | tolerated(0.06) | probably_damaging(0.995) | TCGA-AZ-4315-01 | Colorectum | colon adenocarcinoma | Male | <65 | I/II | Unknown | Unknown | SD |
| SMARCD2 | SNV | Missense_Mutation | rs749078019 | c.314N>A | p.Pro105His | p.P105H | Q92925 | protein_coding | deleterious(0) | possibly_damaging(0.838) | TCGA-AZ-6601-01 | Colorectum | colon adenocarcinoma | Male | >=65 | I/II | Unknown | Unknown | PD |
| SMARCD2 | SNV | Missense_Mutation | c.1507G>A | p.Ala503Thr | p.A503T | Q92925 | protein_coding | tolerated(0.58) | benign(0.114) | TCGA-CA-6718-01 | Colorectum | colon adenocarcinoma | Male | <65 | I/II | Unknown | Unknown | PD | |
| SMARCD2 | SNV | Missense_Mutation | rs759533186 | c.1186N>A | p.Asp396Asn | p.D396N | Q92925 | protein_coding | deleterious(0.04) | probably_damaging(0.964) | TCGA-EI-6917-01 | Colorectum | rectum adenocarcinoma | Male | <65 | III/IV | Chemotherapy | 5fluorouracil+oxaciplatina+l-folinian | SD |
| Page: 1 2 3 4 5 6 |
Top |
Related drugs of malignant transformation related genes |
| Identification of chemicals and drugs interact with genes involved in malignant transfromation |
| (DGIdb 4.0) |
| Entrez ID | Symbol | Category | Interaction Types | Drug Claim Name | Drug Name | PMIDs |
| Page: 1 |

Copyright 2023-Present -The University of Texas Health Science Center at Houston |