
|
|||||
|
 | |
| |
| |
| |
| |
| |
|
Gene: SMARCB1 |
Gene summary for SMARCB1 |
| Gene information | Species | Human | Gene symbol | SMARCB1 | Gene ID | 6598 |
| Gene name | SWI/SNF related, matrix associated, actin dependent regulator of chromatin, subfamily b, member 1 | |
| Gene Alias | BAF47 | |
| Cytomap | 22q11.23 | |
| Gene Type | protein-coding | GO ID | GO:0001188 | UniProtAcc | Q12824 |
Top |
Malignant transformation analysis |
| Identification of the aberrant gene expression in precancerous and cancerous lesions by comparing the gene expression of stem-like cells in diseased tissues with normal stem cells |
| Entrez ID | Symbol | Replicates | Species | Organ | Tissue | Adj P-value | Log2FC | Malignancy |
| 6598 | SMARCB1 | AEH-subject1 | Human | Endometrium | AEH | 3.93e-18 | -4.44e-01 | -0.3059 |
| 6598 | SMARCB1 | AEH-subject2 | Human | Endometrium | AEH | 6.71e-17 | -3.76e-01 | -0.2525 |
| 6598 | SMARCB1 | AEH-subject3 | Human | Endometrium | AEH | 9.17e-11 | -3.60e-01 | -0.2576 |
| 6598 | SMARCB1 | AEH-subject4 | Human | Endometrium | AEH | 3.95e-12 | -3.86e-01 | -0.2657 |
| 6598 | SMARCB1 | AEH-subject5 | Human | Endometrium | AEH | 1.11e-23 | -5.31e-01 | -0.2953 |
| 6598 | SMARCB1 | EEC-subject1 | Human | Endometrium | EEC | 2.06e-24 | -4.54e-01 | -0.2682 |
| 6598 | SMARCB1 | EEC-subject2 | Human | Endometrium | EEC | 7.48e-16 | -4.34e-01 | -0.2607 |
| 6598 | SMARCB1 | EEC-subject3 | Human | Endometrium | EEC | 1.32e-44 | -5.19e-01 | -0.2525 |
| 6598 | SMARCB1 | EEC-subject4 | Human | Endometrium | EEC | 1.70e-12 | -4.15e-01 | -0.2571 |
| 6598 | SMARCB1 | EEC-subject5 | Human | Endometrium | EEC | 4.02e-09 | -3.50e-01 | -0.249 |
| 6598 | SMARCB1 | GSM5276934 | Human | Endometrium | EEC | 4.52e-20 | -4.99e-01 | -0.0913 |
| 6598 | SMARCB1 | GSM5276937 | Human | Endometrium | EEC | 2.60e-19 | -4.62e-01 | -0.0897 |
| 6598 | SMARCB1 | GSM6177620_NYU_UCEC1_lib1_lib1 | Human | Endometrium | EEC | 1.30e-39 | -3.19e-01 | -0.1869 |
| 6598 | SMARCB1 | GSM6177620_NYU_UCEC1_lib2_lib2 | Human | Endometrium | EEC | 2.66e-34 | -3.14e-01 | -0.1875 |
| 6598 | SMARCB1 | GSM6177620_NYU_UCEC1_lib3_lib3 | Human | Endometrium | EEC | 1.71e-36 | -4.32e-01 | -0.1883 |
| 6598 | SMARCB1 | GSM6177621_NYU_UCEC2_lib1_lib1 | Human | Endometrium | EEC | 1.40e-35 | -4.30e-01 | -0.1934 |
| 6598 | SMARCB1 | GSM6177622_NYU_UCEC3_lib1_lib1 | Human | Endometrium | EEC | 3.77e-43 | -2.36e-01 | -0.1917 |
| 6598 | SMARCB1 | GSM6177622_NYU_UCEC3_lib2_lib2 | Human | Endometrium | EEC | 8.01e-50 | -1.95e-01 | -0.1916 |
| 6598 | SMARCB1 | GSM6177623_NYU_UCEC3_Vis | Human | Endometrium | EEC | 6.43e-04 | -2.02e-01 | -0.1269 |
| 6598 | SMARCB1 | LZE2T | Human | Esophagus | ESCC | 1.36e-02 | 1.01e+00 | 0.082 |
| Page: 1 2 3 4 5 6 7 8 |
| Tissue | Expression Dynamics | Abbreviation |
| Endometrium | 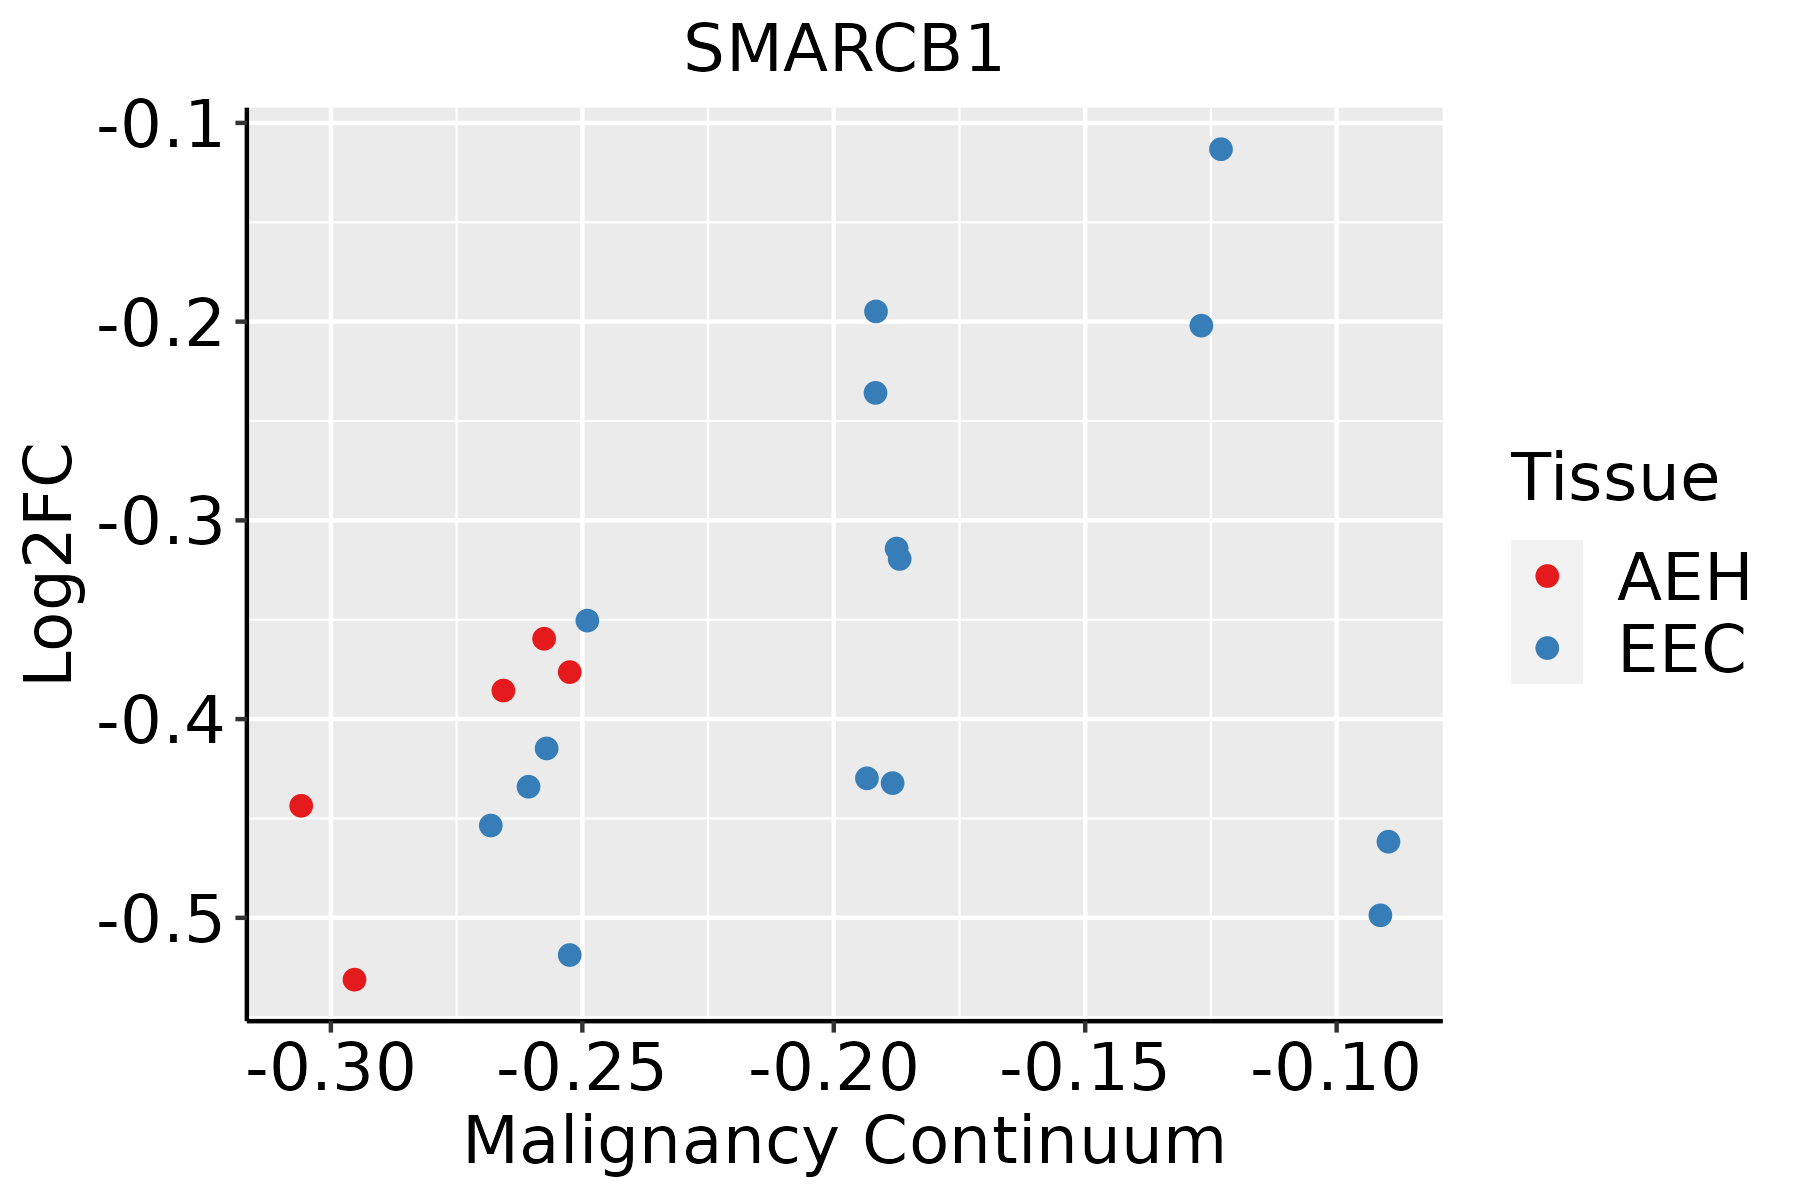 | AEH: Atypical endometrial hyperplasia |
| EEC: Endometrioid Cancer | ||
| Esophagus | 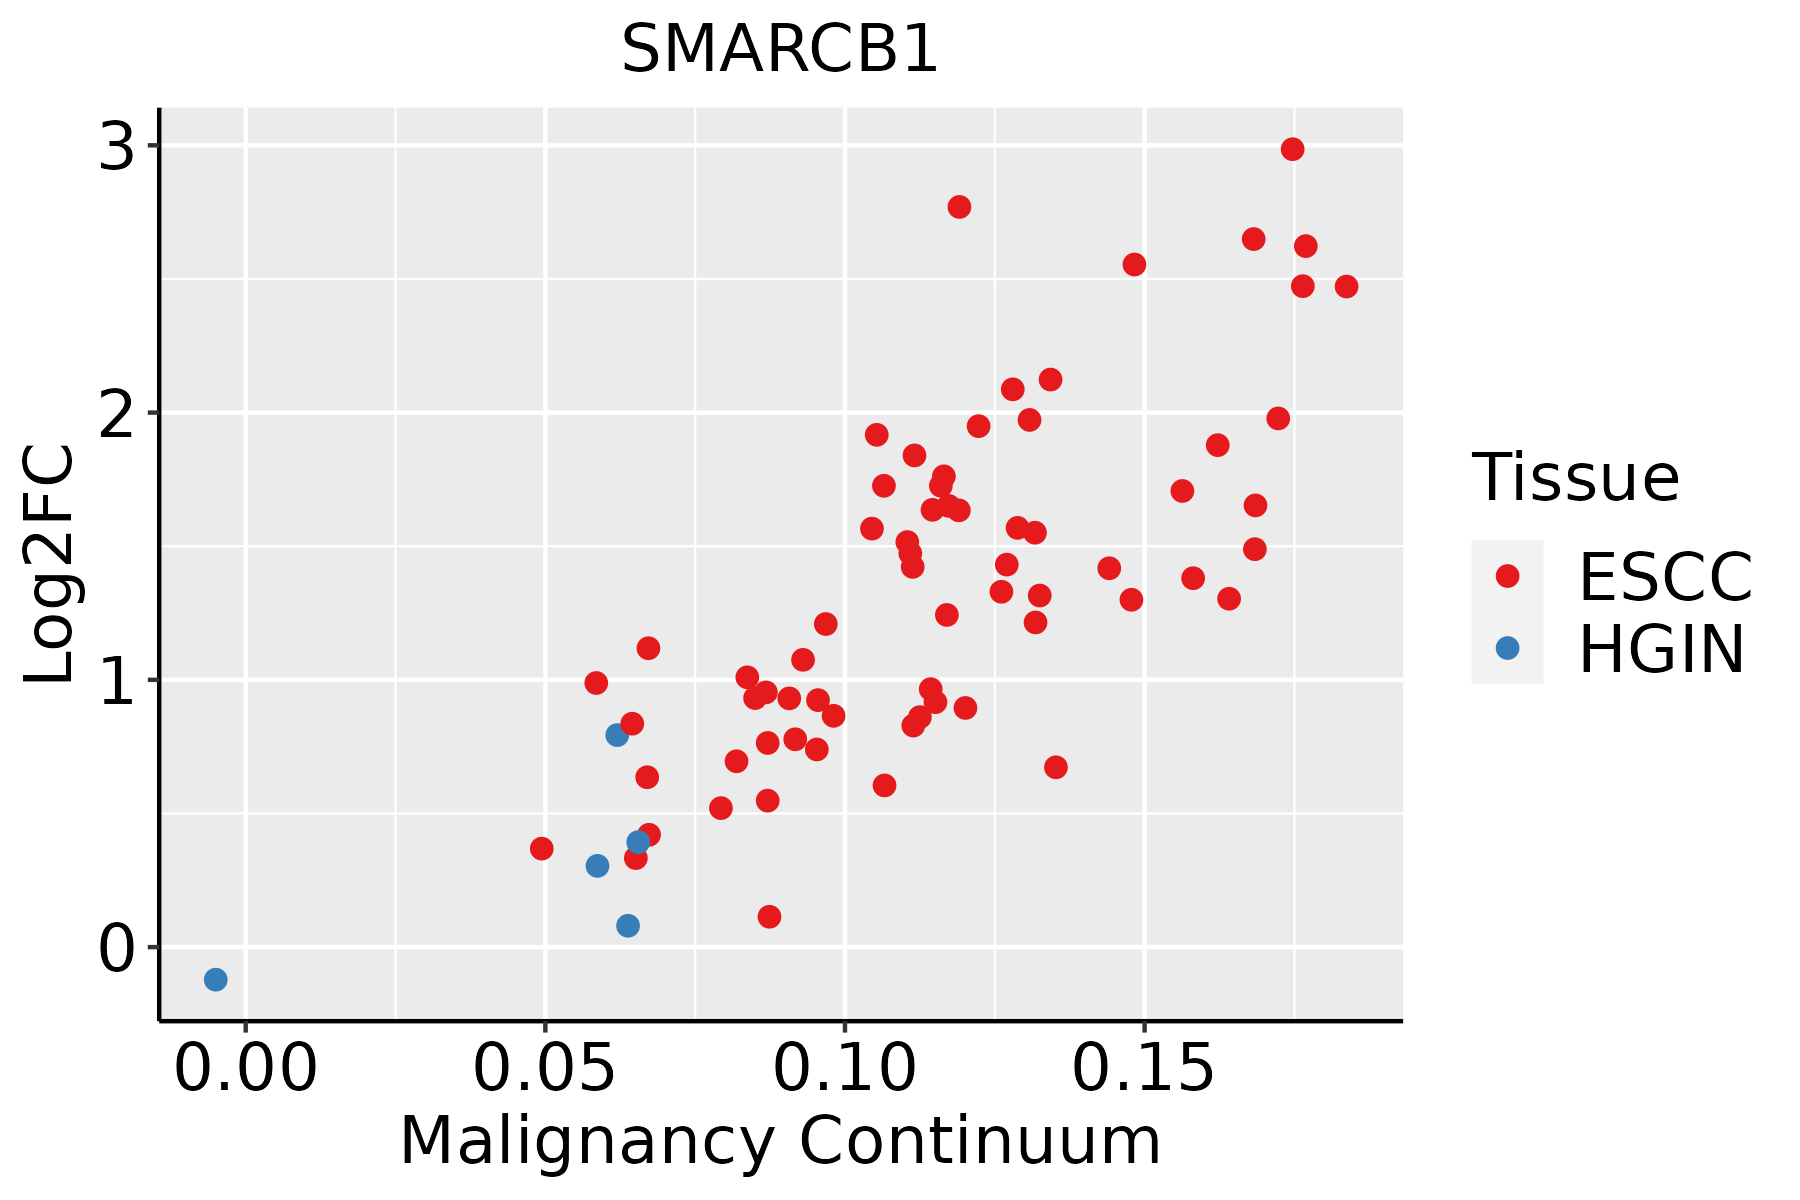 | ESCC: Esophageal squamous cell carcinoma |
| HGIN: High-grade intraepithelial neoplasias | ||
| LGIN: Low-grade intraepithelial neoplasias | ||
| Liver |  | HCC: Hepatocellular carcinoma |
| NAFLD: Non-alcoholic fatty liver disease | ||
| Oral Cavity | 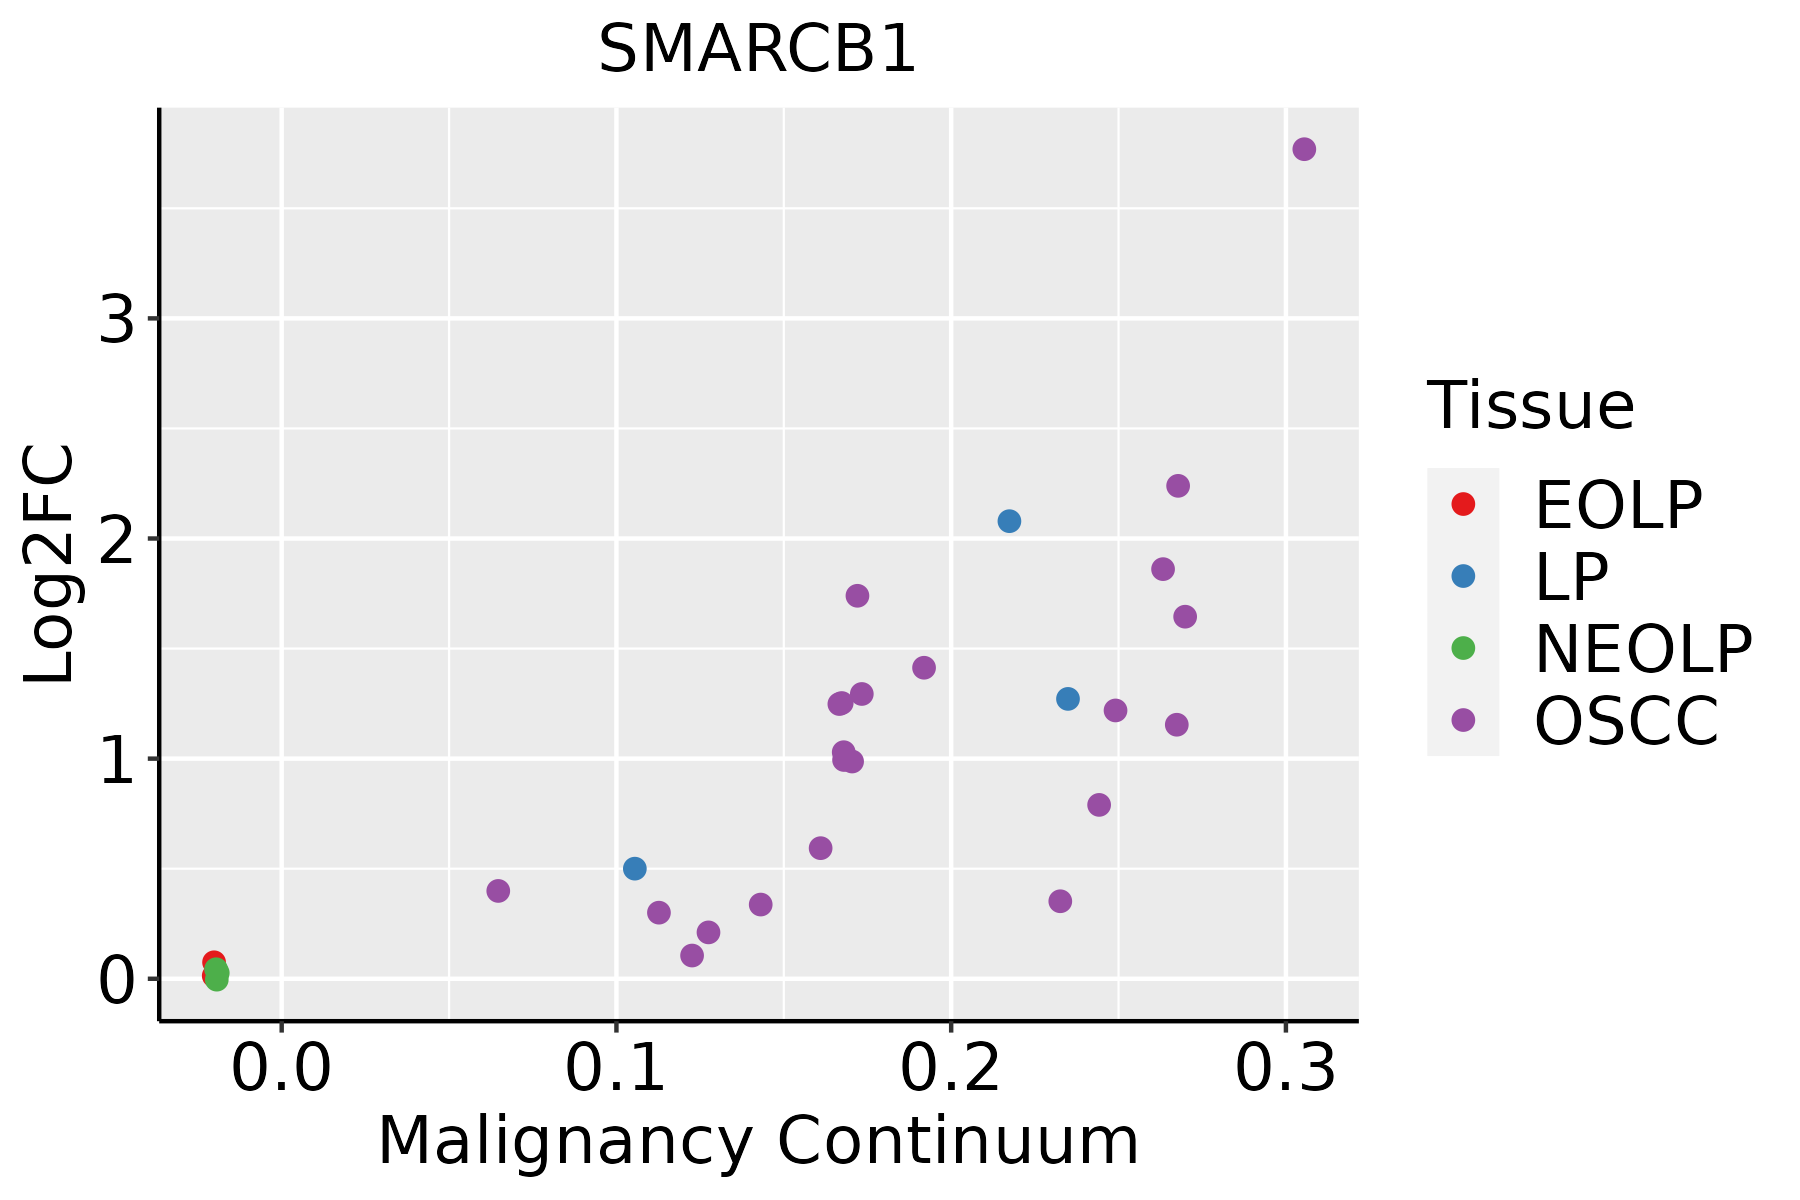 | EOLP: Erosive Oral lichen planus |
| LP: leukoplakia | ||
| NEOLP: Non-erosive oral lichen planus | ||
| OSCC: Oral squamous cell carcinoma | ||
| Skin |  | AK: Actinic keratosis |
| cSCC: Cutaneous squamous cell carcinoma | ||
| SCCIS:squamous cell carcinoma in situ | ||
| Thyroid | 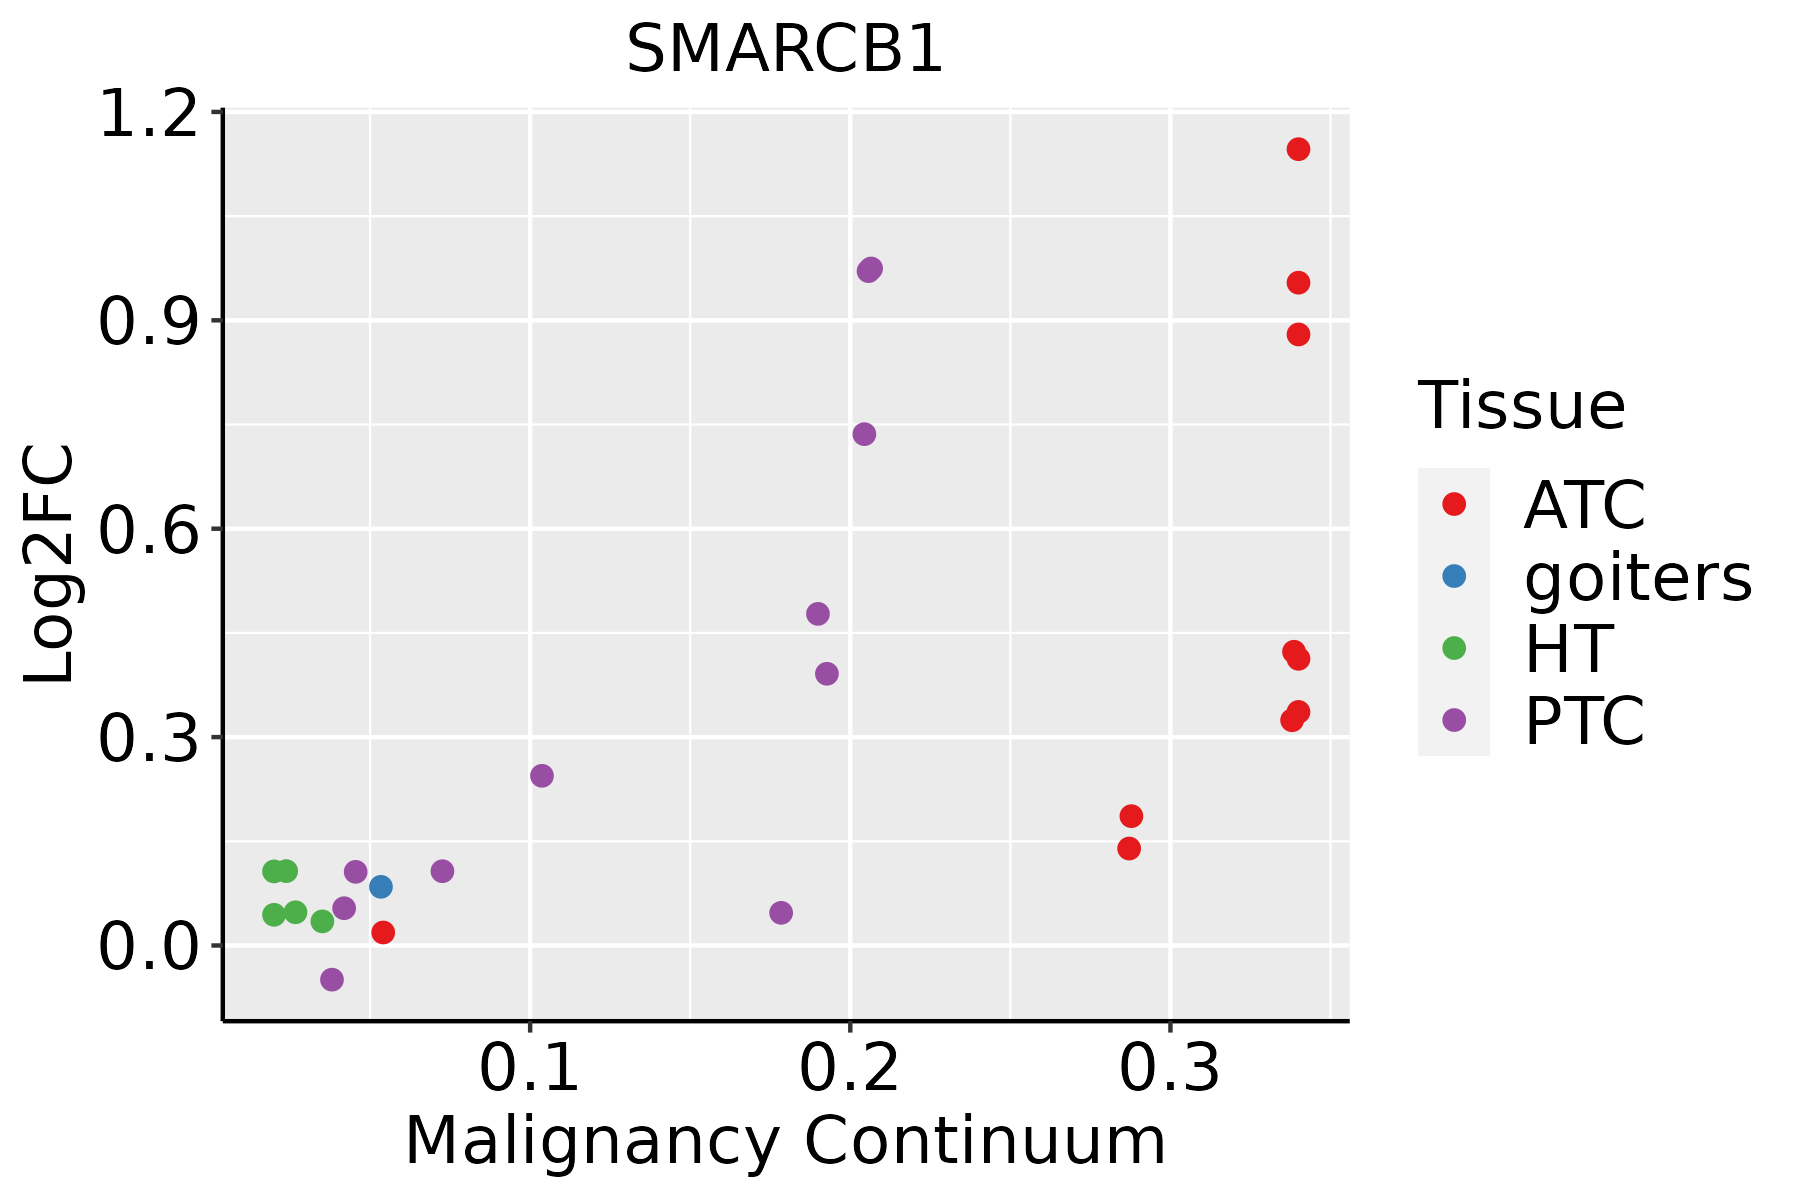 | ATC: Anaplastic thyroid cancer |
| HT: Hashimoto's thyroiditis | ||
| PTC: Papillary thyroid cancer |
| ∗log2FC in expression of this searched gene in stem-like cells from each diseased tissue sample relative to stem-like cells in normal samples in each tissue plotted against the malignancy continuum. Samples are colored based on if they are from different disease stage. |
Top |
Malignant transformation related pathway analysis |
| Find out the enriched GO biological processes and KEGG pathways involved in transition from healthy to precancer to cancer |
| Tissue | Disease Stage | Enriched GO biological Processes |
| Colorectum | AD |  |
| Colorectum | SER |  |
| Colorectum | MSS |  |
| Colorectum | MSI-H |  |
| Colorectum | FAP |  |
| ∗Top 15 enriched GO BP terms are showed in the bar plot of each disease state in each tissue. Each row represents a significant GO biological process which is colored according to the -log10(p.adjust). |
| Page: 1 2 3 4 5 6 7 8 9 |
| GO ID | Tissue | Disease Stage | Description | Gene Ratio | Bg Ratio | pvalue | p.adjust | Count |
| GO:001603216 | Endometrium | AEH | viral process | 110/2100 | 415/18723 | 1.99e-18 | 1.09e-15 | 110 |
| GO:001905816 | Endometrium | AEH | viral life cycle | 86/2100 | 317/18723 | 2.53e-15 | 7.58e-13 | 86 |
| GO:001907916 | Endometrium | AEH | viral genome replication | 43/2100 | 131/18723 | 3.22e-11 | 4.60e-09 | 43 |
| GO:004440316 | Endometrium | AEH | biological process involved in symbiotic interaction | 70/2100 | 290/18723 | 3.26e-10 | 3.55e-08 | 70 |
| GO:000974316 | Endometrium | AEH | response to carbohydrate | 62/2100 | 253/18723 | 1.76e-09 | 1.51e-07 | 62 |
| GO:003428416 | Endometrium | AEH | response to monosaccharide | 57/2100 | 225/18723 | 2.13e-09 | 1.77e-07 | 57 |
| GO:000974615 | Endometrium | AEH | response to hexose | 54/2100 | 219/18723 | 1.54e-08 | 9.72e-07 | 54 |
| GO:000974910 | Endometrium | AEH | response to glucose | 52/2100 | 212/18723 | 3.40e-08 | 1.91e-06 | 52 |
| GO:00016789 | Endometrium | AEH | cellular glucose homeostasis | 44/2100 | 172/18723 | 1.04e-07 | 5.07e-06 | 44 |
| GO:007132210 | Endometrium | AEH | cellular response to carbohydrate stimulus | 41/2100 | 163/18723 | 4.55e-07 | 1.87e-05 | 41 |
| GO:00017019 | Endometrium | AEH | in utero embryonic development | 73/2100 | 367/18723 | 7.18e-07 | 2.63e-05 | 73 |
| GO:00713339 | Endometrium | AEH | cellular response to glucose stimulus | 38/2100 | 151/18723 | 1.17e-06 | 3.82e-05 | 38 |
| GO:00713319 | Endometrium | AEH | cellular response to hexose stimulus | 38/2100 | 153/18723 | 1.65e-06 | 5.13e-05 | 38 |
| GO:004259310 | Endometrium | AEH | glucose homeostasis | 55/2100 | 258/18723 | 1.87e-06 | 5.74e-05 | 55 |
| GO:00713269 | Endometrium | AEH | cellular response to monosaccharide stimulus | 38/2100 | 154/18723 | 1.96e-06 | 5.93e-05 | 38 |
| GO:003350010 | Endometrium | AEH | carbohydrate homeostasis | 55/2100 | 259/18723 | 2.12e-06 | 6.31e-05 | 55 |
| GO:002241115 | Endometrium | AEH | cellular component disassembly | 80/2100 | 443/18723 | 1.07e-05 | 2.45e-04 | 80 |
| GO:00329848 | Endometrium | AEH | protein-containing complex disassembly | 45/2100 | 224/18723 | 7.16e-05 | 1.10e-03 | 45 |
| GO:00396942 | Endometrium | AEH | viral RNA genome replication | 12/2100 | 35/18723 | 2.69e-04 | 3.12e-03 | 12 |
| GO:00518174 | Endometrium | AEH | modulation of process of other organism involved in symbiotic interaction | 19/2100 | 81/18723 | 1.32e-03 | 1.12e-02 | 19 |
| Page: 1 2 3 4 5 6 7 8 9 10 11 12 13 14 15 16 17 18 19 20 21 22 23 24 25 26 27 28 |
| Pathway ID | Tissue | Disease Stage | Description | Gene Ratio | Bg Ratio | pvalue | p.adjust | qvalue | Count |
| hsa0471426 | Endometrium | AEH | Thermogenesis | 85/1197 | 232/8465 | 3.44e-18 | 9.33e-17 | 6.83e-17 | 85 |
| hsa04714111 | Endometrium | AEH | Thermogenesis | 85/1197 | 232/8465 | 3.44e-18 | 9.33e-17 | 6.83e-17 | 85 |
| hsa0471427 | Endometrium | EEC | Thermogenesis | 85/1237 | 232/8465 | 2.79e-17 | 7.05e-16 | 5.26e-16 | 85 |
| hsa0471436 | Endometrium | EEC | Thermogenesis | 85/1237 | 232/8465 | 2.79e-17 | 7.05e-16 | 5.26e-16 | 85 |
| hsa0471439 | Esophagus | HGIN | Thermogenesis | 91/1383 | 232/8465 | 1.97e-17 | 5.36e-16 | 4.25e-16 | 91 |
| hsa04714114 | Esophagus | HGIN | Thermogenesis | 91/1383 | 232/8465 | 1.97e-17 | 5.36e-16 | 4.25e-16 | 91 |
| hsa04714211 | Esophagus | ESCC | Thermogenesis | 163/4205 | 232/8465 | 9.22e-11 | 1.14e-09 | 5.86e-10 | 163 |
| hsa032509 | Esophagus | ESCC | Viral life cycle - HIV-1 | 54/4205 | 63/8465 | 2.01e-09 | 2.17e-08 | 1.11e-08 | 54 |
| hsa0522518 | Esophagus | ESCC | Hepatocellular carcinoma | 109/4205 | 168/8465 | 4.27e-05 | 1.88e-04 | 9.64e-05 | 109 |
| hsa04714310 | Esophagus | ESCC | Thermogenesis | 163/4205 | 232/8465 | 9.22e-11 | 1.14e-09 | 5.86e-10 | 163 |
| hsa0325014 | Esophagus | ESCC | Viral life cycle - HIV-1 | 54/4205 | 63/8465 | 2.01e-09 | 2.17e-08 | 1.11e-08 | 54 |
| hsa0522519 | Esophagus | ESCC | Hepatocellular carcinoma | 109/4205 | 168/8465 | 4.27e-05 | 1.88e-04 | 9.64e-05 | 109 |
| hsa0471414 | Liver | Cirrhotic | Thermogenesis | 121/2530 | 232/8465 | 5.70e-13 | 1.36e-11 | 8.36e-12 | 121 |
| hsa0471415 | Liver | Cirrhotic | Thermogenesis | 121/2530 | 232/8465 | 5.70e-13 | 1.36e-11 | 8.36e-12 | 121 |
| hsa0471422 | Liver | HCC | Thermogenesis | 170/4020 | 232/8465 | 5.36e-16 | 2.25e-14 | 1.25e-14 | 170 |
| hsa052258 | Liver | HCC | Hepatocellular carcinoma | 106/4020 | 168/8465 | 2.87e-05 | 1.85e-04 | 1.03e-04 | 106 |
| hsa032502 | Liver | HCC | Viral life cycle - HIV-1 | 46/4020 | 63/8465 | 3.25e-05 | 1.88e-04 | 1.04e-04 | 46 |
| hsa0471432 | Liver | HCC | Thermogenesis | 170/4020 | 232/8465 | 5.36e-16 | 2.25e-14 | 1.25e-14 | 170 |
| hsa0522511 | Liver | HCC | Hepatocellular carcinoma | 106/4020 | 168/8465 | 2.87e-05 | 1.85e-04 | 1.03e-04 | 106 |
| hsa0325011 | Liver | HCC | Viral life cycle - HIV-1 | 46/4020 | 63/8465 | 3.25e-05 | 1.88e-04 | 1.04e-04 | 46 |
| Page: 1 2 |
Top |
Cell-cell communication analysis |
| Identification of potential cell-cell interactions between two cell types and their ligand-receptor pairs for different disease states |
| Ligand | Receptor | LRpair | Pathway | Tissue | Disease Stage |
| Page: 1 |
Top |
Single-cell gene regulatory network inference analysis |
| Find out the significant the regulons (TFs) and the target genes of each regulon across cell types for different disease states |
| TF | Cell Type | Tissue | Disease Stage | Target Gene | RSS | Regulon Activity |
| SMARCB1 | BN | Cervix | Healthy | AC010422.8,SDHAF1,TNFRSF13B, etc. | 6.90e-02 |  |
| SMARCB1 | BN | Cervix | N_HPV | AC010422.8,SDHAF1,TNFRSF13B, etc. | 1.21e-01 |  |
| SMARCB1 | CT | Colorectum | CRC | FAM227A,KSR2,GOLT1B, etc. | 6.32e-03 |  |
| SMARCB1 | AT1 | Lung | IAC | MTCH1,HMGA1,UQCR10, etc. | 8.51e-02 |  |
| SMARCB1 | TH1 | Lung | ADJ | CD79A,PTGDS,ITGB7, etc. | 1.26e-01 |  |
| SMARCB1 | PLA | Lung | AIS | PRPSAP2,MUC1,IGHM, etc. | 7.87e-02 |  |
| SMARCB1 | PLA | Lung | IAC | POU2AF1,VPREB3,TNFRSF13B, etc. | 1.16e-01 | |
| SMARCB1 | MAIT | Lung | IAC | POU2AF1,VPREB3,TNFRSF13B, etc. | 4.44e-16 | |
| SMARCB1 | GDT | Lung | IAC | POU2AF1,VPREB3,TNFRSF13B, etc. | 6.59e-03 | |
| SMARCB1 | GC | Lung | IAC | POU2AF1,VPREB3,TNFRSF13B, etc. | 3.48e-02 | |
| ∗The dot plots of a searched regulon are shown for all cell subpopulations in each disease state of each tissue based on the regulon specific score inferred using pySCENIC and by calculating the average expression. |
| Page: 1 2 3 |
Top |
Somatic mutation of malignant transformation related genes |
| Annotation of somatic variants for genes involved in malignant transformation |
| Hugo Symbol | Variant Class | Variant Classification | dbSNP RS | HGVSc | HGVSp | HGVSp Short | SWISSPROT | BIOTYPE | SIFT | PolyPhen | Tumor Sample Barcode | Tissue | Histology | Sex | Age | Stage | Therapy Types | Drugs | Outcome |
| SMARCB1 | SNV | Missense_Mutation | c.811N>A | p.Val271Ile | p.V271I | protein_coding | tolerated(0.41) | possibly_damaging(0.767) | TCGA-AO-A128-01 | Breast | breast invasive carcinoma | Female | <65 | I/II | Chemotherapy | doxorubicin | SD | ||
| SMARCB1 | insertion | Nonsense_Mutation | novel | c.481_482insAATAGA | p.Cys161delinsTer | p.C161delins* | protein_coding | TCGA-AR-A0U0-01 | Breast | breast invasive carcinoma | Female | >=65 | I/II | Unknown | Unknown | SD | |||
| SMARCB1 | insertion | Frame_Shift_Ins | novel | c.277_278insAGCACTTCATCCTGGCAGCCAGTGTGCTAGAGCCCAT | p.Gly93GlufsTer16 | p.G93Efs*16 | protein_coding | TCGA-BH-A0DP-01 | Breast | breast invasive carcinoma | Female | <65 | I/II | Hormone Therapy | arimidex | SD | |||
| SMARCB1 | SNV | Missense_Mutation | rs767791254 | c.283N>A | p.Asp95Asn | p.D95N | protein_coding | deleterious(0.01) | probably_damaging(0.913) | TCGA-2W-A8YY-01 | Cervix | cervical & endocervical cancer | Female | <65 | I/II | Chemotherapy | cisplatin | CR | |
| SMARCB1 | SNV | Missense_Mutation | novel | c.953N>T | p.Thr318Ile | p.T318I | protein_coding | deleterious(0) | possibly_damaging(0.578) | TCGA-2W-A8YY-01 | Cervix | cervical & endocervical cancer | Female | <65 | I/II | Chemotherapy | cisplatin | CR | |
| SMARCB1 | SNV | Missense_Mutation | c.448N>A | p.Asp150Asn | p.D150N | protein_coding | tolerated(0.22) | benign(0.037) | TCGA-IR-A3LL-01 | Cervix | cervical & endocervical cancer | Female | <65 | I/II | Chemotherapy | cisplatin | CR | ||
| SMARCB1 | SNV | Missense_Mutation | c.767C>G | p.Ser256Cys | p.S256C | protein_coding | tolerated(0.09) | possibly_damaging(0.673) | TCGA-LP-A4AV-01 | Cervix | cervical & endocervical cancer | Female | <65 | I/II | Unknown | Unknown | SD | ||
| SMARCB1 | insertion | Nonsense_Mutation | novel | c.100_101insTTGAACAATGAGAAC | p.Asn34delinsIleGluGlnTerGluHis | p.N34delinsIEQ*EH | protein_coding | TCGA-DS-A1OD-01 | Cervix | cervical & endocervical cancer | Female | <65 | I/II | Chemotherapy | cisplatin | SD | |||
| SMARCB1 | SNV | Missense_Mutation | rs387906812 | c.1157G>A | p.Arg386His | p.R386H | protein_coding | deleterious(0) | probably_damaging(0.96) | TCGA-A6-2678-01 | Colorectum | colon adenocarcinoma | Female | <65 | III/IV | Chemotherapy | 5-fluorouracil | SD | |
| SMARCB1 | SNV | Missense_Mutation | novel | c.14N>T | p.Ala5Val | p.A5V | protein_coding | tolerated_low_confidence(0.08) | benign(0.324) | TCGA-A6-3808-01 | Colorectum | colon adenocarcinoma | Male | >=65 | I/II | Unknown | Unknown | SD |
| Page: 1 2 3 4 5 |
Top |
Related drugs of malignant transformation related genes |
| Identification of chemicals and drugs interact with genes involved in malignant transfromation |
| (DGIdb 4.0) |
| Entrez ID | Symbol | Category | Interaction Types | Drug Claim Name | Drug Name | PMIDs |
| 6598 | SMARCB1 | CLINICALLY ACTIONABLE | radiotherapy | 23190500 | ||
| 6598 | SMARCB1 | CLINICALLY ACTIONABLE | Alvocidib | ALVOCIDIB | 18223228 | |
| 6598 | SMARCB1 | CLINICALLY ACTIONABLE | Tazemetostat | TAZEMETOSTAT | 26360609,23620515 | |
| 6598 | SMARCB1 | CLINICALLY ACTIONABLE | Tazemetostat | TAZEMETOSTAT | ||
| 6598 | SMARCB1 | CLINICALLY ACTIONABLE | DZNeP | 23190500 | ||
| 6598 | SMARCB1 | CLINICALLY ACTIONABLE | Vorinostat | VORINOSTAT | 23764045 | |
| 6598 | SMARCB1 | CLINICALLY ACTIONABLE | TAZEMETOSTAT | TAZEMETOSTAT | 29650362,23620515 | |
| 6598 | SMARCB1 | CLINICALLY ACTIONABLE | PANOBINOSTAT | PANOBINOSTAT | 26920892 | |
| 6598 | SMARCB1 | CLINICALLY ACTIONABLE | Fenretinide | FENRETINIDE | 23764045 | |
| 6598 | SMARCB1 | CLINICALLY ACTIONABLE | Palbociclib | PALBOCICLIB | 21871868 |
| Page: 1 2 |

Copyright 2023-Present -The University of Texas Health Science Center at Houston |