
|
|||||
|
 | |
| |
| |
| |
| |
| |
|
Gene: SMARCAD1 |
Gene summary for SMARCAD1 |
| Gene information | Species | Human | Gene symbol | SMARCAD1 | Gene ID | 56916 |
| Gene name | SWI/SNF-related, matrix-associated actin-dependent regulator of chromatin, subfamily a, containing DEAD/H box 1 | |
| Gene Alias | ADERM | |
| Cytomap | 4q22.3 | |
| Gene Type | protein-coding | GO ID | GO:0000018 | UniProtAcc | Q9H4L7 |
Top |
Malignant transformation analysis |
| Identification of the aberrant gene expression in precancerous and cancerous lesions by comparing the gene expression of stem-like cells in diseased tissues with normal stem cells |
| Entrez ID | Symbol | Replicates | Species | Organ | Tissue | Adj P-value | Log2FC | Malignancy |
| 56916 | SMARCAD1 | LZE4T | Human | Esophagus | ESCC | 1.37e-05 | 1.92e-01 | 0.0811 |
| 56916 | SMARCAD1 | LZE7T | Human | Esophagus | ESCC | 9.07e-10 | 4.51e-01 | 0.0667 |
| 56916 | SMARCAD1 | LZE20T | Human | Esophagus | ESCC | 3.14e-02 | 7.93e-02 | 0.0662 |
| 56916 | SMARCAD1 | LZE24T | Human | Esophagus | ESCC | 1.70e-07 | 1.65e-01 | 0.0596 |
| 56916 | SMARCAD1 | P1T-E | Human | Esophagus | ESCC | 1.38e-04 | 2.01e-01 | 0.0875 |
| 56916 | SMARCAD1 | P2T-E | Human | Esophagus | ESCC | 2.02e-33 | 5.28e-01 | 0.1177 |
| 56916 | SMARCAD1 | P4T-E | Human | Esophagus | ESCC | 2.55e-20 | 4.08e-01 | 0.1323 |
| 56916 | SMARCAD1 | P5T-E | Human | Esophagus | ESCC | 8.38e-05 | 8.34e-02 | 0.1327 |
| 56916 | SMARCAD1 | P8T-E | Human | Esophagus | ESCC | 1.33e-08 | 1.26e-01 | 0.0889 |
| 56916 | SMARCAD1 | P9T-E | Human | Esophagus | ESCC | 2.29e-05 | 1.02e-01 | 0.1131 |
| 56916 | SMARCAD1 | P10T-E | Human | Esophagus | ESCC | 7.90e-35 | 4.55e-01 | 0.116 |
| 56916 | SMARCAD1 | P11T-E | Human | Esophagus | ESCC | 1.93e-16 | 7.17e-01 | 0.1426 |
| 56916 | SMARCAD1 | P12T-E | Human | Esophagus | ESCC | 1.14e-27 | 4.85e-01 | 0.1122 |
| 56916 | SMARCAD1 | P15T-E | Human | Esophagus | ESCC | 3.72e-14 | 2.86e-01 | 0.1149 |
| 56916 | SMARCAD1 | P16T-E | Human | Esophagus | ESCC | 2.51e-20 | 3.77e-01 | 0.1153 |
| 56916 | SMARCAD1 | P17T-E | Human | Esophagus | ESCC | 2.30e-06 | 2.14e-01 | 0.1278 |
| 56916 | SMARCAD1 | P20T-E | Human | Esophagus | ESCC | 4.81e-07 | 1.56e-01 | 0.1124 |
| 56916 | SMARCAD1 | P21T-E | Human | Esophagus | ESCC | 2.23e-15 | 2.52e-01 | 0.1617 |
| 56916 | SMARCAD1 | P22T-E | Human | Esophagus | ESCC | 9.84e-18 | 2.40e-01 | 0.1236 |
| 56916 | SMARCAD1 | P23T-E | Human | Esophagus | ESCC | 1.03e-10 | 2.23e-01 | 0.108 |
| Page: 1 2 3 4 5 |
| Tissue | Expression Dynamics | Abbreviation |
| Esophagus | 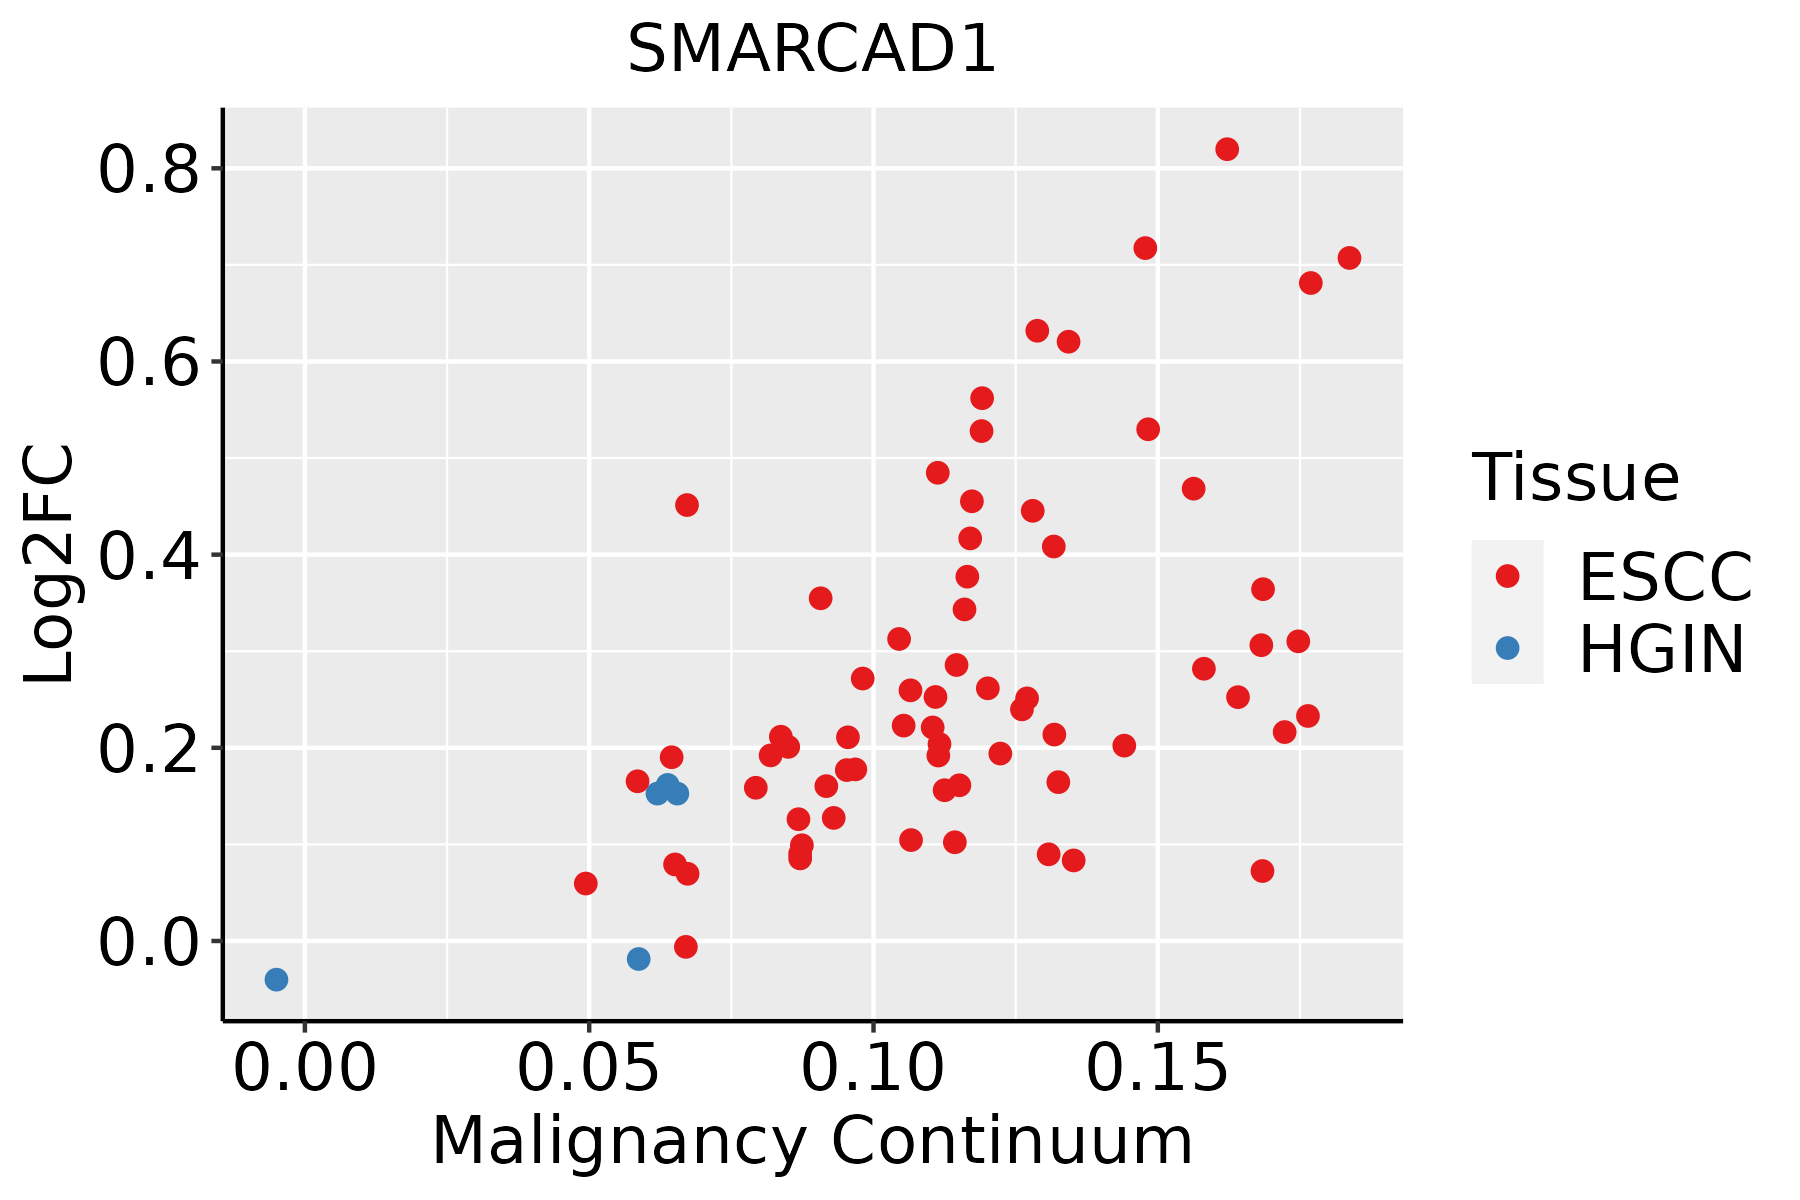 | ESCC: Esophageal squamous cell carcinoma |
| HGIN: High-grade intraepithelial neoplasias | ||
| LGIN: Low-grade intraepithelial neoplasias | ||
| Lung |  | AAH: Atypical adenomatous hyperplasia |
| AIS: Adenocarcinoma in situ | ||
| IAC: Invasive lung adenocarcinoma | ||
| MIA: Minimally invasive adenocarcinoma | ||
| Oral Cavity |  | EOLP: Erosive Oral lichen planus |
| LP: leukoplakia | ||
| NEOLP: Non-erosive oral lichen planus | ||
| OSCC: Oral squamous cell carcinoma | ||
| Skin |  | AK: Actinic keratosis |
| cSCC: Cutaneous squamous cell carcinoma | ||
| SCCIS:squamous cell carcinoma in situ | ||
| Thyroid |  | ATC: Anaplastic thyroid cancer |
| HT: Hashimoto's thyroiditis | ||
| PTC: Papillary thyroid cancer |
| ∗log2FC in expression of this searched gene in stem-like cells from each diseased tissue sample relative to stem-like cells in normal samples in each tissue plotted against the malignancy continuum. Samples are colored based on if they are from different disease stage. |
Top |
Malignant transformation related pathway analysis |
| Find out the enriched GO biological processes and KEGG pathways involved in transition from healthy to precancer to cancer |
| Tissue | Disease Stage | Enriched GO biological Processes |
| Colorectum | AD |  |
| Colorectum | SER |  |
| Colorectum | MSS |  |
| Colorectum | MSI-H |  |
| Colorectum | FAP |  |
| ∗Top 15 enriched GO BP terms are showed in the bar plot of each disease state in each tissue. Each row represents a significant GO biological process which is colored according to the -log10(p.adjust). |
| Page: 1 2 3 4 5 6 7 8 9 |
| GO ID | Tissue | Disease Stage | Description | Gene Ratio | Bg Ratio | pvalue | p.adjust | Count |
| GO:001657015 | Esophagus | ESCC | histone modification | 323/8552 | 463/18723 | 2.61e-26 | 7.88e-24 | 323 |
| GO:000705911 | Esophagus | ESCC | chromosome segregation | 238/8552 | 346/18723 | 1.72e-18 | 1.82e-16 | 238 |
| GO:005105215 | Esophagus | ESCC | regulation of DNA metabolic process | 232/8552 | 359/18723 | 2.40e-13 | 1.13e-11 | 232 |
| GO:000632517 | Esophagus | ESCC | chromatin organization | 240/8552 | 409/18723 | 6.52e-08 | 1.14e-06 | 240 |
| GO:00356015 | Esophagus | ESCC | protein deacylation | 79/8552 | 112/18723 | 8.30e-08 | 1.42e-06 | 79 |
| GO:00987325 | Esophagus | ESCC | macromolecule deacylation | 80/8552 | 116/18723 | 3.19e-07 | 4.50e-06 | 80 |
| GO:00165754 | Esophagus | ESCC | histone deacetylation | 60/8552 | 82/18723 | 3.85e-07 | 5.32e-06 | 60 |
| GO:00064765 | Esophagus | ESCC | protein deacetylation | 70/8552 | 101/18723 | 1.29e-06 | 1.58e-05 | 70 |
| GO:00063024 | Esophagus | ESCC | double-strand break repair | 152/8552 | 251/18723 | 1.33e-06 | 1.62e-05 | 152 |
| GO:003239214 | Esophagus | ESCC | DNA geometric change | 62/8552 | 90/18723 | 7.02e-06 | 7.04e-05 | 62 |
| GO:003250813 | Esophagus | ESCC | DNA duplex unwinding | 58/8552 | 84/18723 | 1.23e-05 | 1.14e-04 | 58 |
| GO:00513042 | Esophagus | ESCC | chromosome separation | 64/8552 | 96/18723 | 2.61e-05 | 2.20e-04 | 64 |
| GO:00063101 | Esophagus | ESCC | DNA recombination | 168/8552 | 305/18723 | 5.58e-04 | 3.05e-03 | 168 |
| GO:00709331 | Esophagus | ESCC | histone H4 deacetylation | 10/8552 | 11/18723 | 2.54e-03 | 1.08e-02 | 10 |
| GO:00709321 | Esophagus | ESCC | histone H3 deacetylation | 15/8552 | 20/18723 | 7.60e-03 | 2.71e-02 | 15 |
| GO:00165704 | Lung | IAC | histone modification | 93/2061 | 463/18723 | 5.41e-09 | 8.03e-07 | 93 |
| GO:00064762 | Lung | IAC | protein deacetylation | 25/2061 | 101/18723 | 7.38e-05 | 1.55e-03 | 25 |
| GO:0016575 | Lung | IAC | histone deacetylation | 21/2061 | 82/18723 | 1.62e-04 | 2.92e-03 | 21 |
| GO:00063256 | Lung | IAC | chromatin organization | 69/2061 | 409/18723 | 2.01e-04 | 3.53e-03 | 69 |
| GO:00356012 | Lung | IAC | protein deacylation | 25/2061 | 112/18723 | 4.18e-04 | 6.25e-03 | 25 |
| Page: 1 2 3 4 5 6 |
| Pathway ID | Tissue | Disease Stage | Description | Gene Ratio | Bg Ratio | pvalue | p.adjust | qvalue | Count |
| Page: 1 |
Top |
Cell-cell communication analysis |
| Identification of potential cell-cell interactions between two cell types and their ligand-receptor pairs for different disease states |
| Ligand | Receptor | LRpair | Pathway | Tissue | Disease Stage |
| Page: 1 |
Top |
Single-cell gene regulatory network inference analysis |
| Find out the significant the regulons (TFs) and the target genes of each regulon across cell types for different disease states |
| TF | Cell Type | Tissue | Disease Stage | Target Gene | RSS | Regulon Activity |
| ∗The dot plots of a searched regulon are shown for all cell subpopulations in each disease state of each tissue based on the regulon specific score inferred using pySCENIC and by calculating the average expression. |
| Page: 1 |
Top |
Somatic mutation of malignant transformation related genes |
| Annotation of somatic variants for genes involved in malignant transformation |
| Hugo Symbol | Variant Class | Variant Classification | dbSNP RS | HGVSc | HGVSp | HGVSp Short | SWISSPROT | BIOTYPE | SIFT | PolyPhen | Tumor Sample Barcode | Tissue | Histology | Sex | Age | Stage | Therapy Types | Drugs | Outcome |
| SMARCAD1 | SNV | Missense_Mutation | c.611N>C | p.Gly204Ala | p.G204A | Q9H4L7 | protein_coding | tolerated(0.88) | benign(0) | TCGA-BH-A1FC-01 | Breast | breast invasive carcinoma | Female | >=65 | I/II | Unknown | Unknown | SD | |
| SMARCAD1 | SNV | Missense_Mutation | novel | c.707N>A | p.Gly236Glu | p.G236E | Q9H4L7 | protein_coding | tolerated(1) | benign(0.003) | TCGA-C8-A8HP-01 | Breast | breast invasive carcinoma | Female | <65 | III/IV | Chemotherapy | 5-fluorouracil | CR |
| SMARCAD1 | SNV | Missense_Mutation | c.1945N>T | p.Ala649Ser | p.A649S | Q9H4L7 | protein_coding | tolerated(0.06) | possibly_damaging(0.506) | TCGA-D8-A1JG-01 | Breast | breast invasive carcinoma | Female | <65 | I/II | Chemotherapy | doxorubicin | SD | |
| SMARCAD1 | SNV | Missense_Mutation | novel | c.1840C>T | p.Arg614Cys | p.R614C | Q9H4L7 | protein_coding | deleterious(0) | probably_damaging(0.928) | TCGA-2W-A8YY-01 | Cervix | cervical & endocervical cancer | Female | <65 | I/II | Chemotherapy | cisplatin | CR |
| SMARCAD1 | SNV | Missense_Mutation | c.373N>A | p.Glu125Lys | p.E125K | Q9H4L7 | protein_coding | tolerated_low_confidence(0.24) | probably_damaging(0.953) | TCGA-C5-A1M5-01 | Cervix | cervical & endocervical cancer | Female | <65 | I/II | Unknown | Unknown | PD | |
| SMARCAD1 | SNV | Missense_Mutation | c.2182C>G | p.Leu728Val | p.L728V | Q9H4L7 | protein_coding | deleterious(0) | probably_damaging(0.998) | TCGA-C5-A2LX-01 | Cervix | cervical & endocervical cancer | Female | <65 | I/II | Chemotherapy | cisplatin | SD | |
| SMARCAD1 | SNV | Missense_Mutation | c.1132G>A | p.Glu378Lys | p.E378K | Q9H4L7 | protein_coding | deleterious(0.05) | benign(0.022) | TCGA-DR-A0ZM-01 | Cervix | cervical & endocervical cancer | Female | <65 | III/IV | Unspecific | Cisplatin | SD | |
| SMARCAD1 | SNV | Missense_Mutation | rs555203609 | c.205N>G | p.Pro69Ala | p.P69A | Q9H4L7 | protein_coding | deleterious_low_confidence(0.03) | probably_damaging(0.994) | TCGA-DS-A1OA-01 | Cervix | cervical & endocervical cancer | Female | >=65 | I/II | Chemotherapy | carboplatin | PD |
| SMARCAD1 | SNV | Missense_Mutation | c.19N>T | p.Asp7Tyr | p.D7Y | Q9H4L7 | protein_coding | deleterious_low_confidence(0) | probably_damaging(0.996) | TCGA-LP-A5U2-01 | Cervix | cervical & endocervical cancer | Female | <65 | III/IV | Unknown | Unknown | SD | |
| SMARCAD1 | SNV | Missense_Mutation | novel | c.2839N>C | p.Ile947Leu | p.I947L | Q9H4L7 | protein_coding | deleterious(0.01) | probably_damaging(0.955) | TCGA-VS-A94Z-01 | Cervix | cervical & endocervical cancer | Female | <65 | I/II | Chemotherapy | cisplatin | CR |
| Page: 1 2 3 4 5 6 7 8 9 10 11 12 |
Top |
Related drugs of malignant transformation related genes |
| Identification of chemicals and drugs interact with genes involved in malignant transfromation |
| (DGIdb 4.0) |
| Entrez ID | Symbol | Category | Interaction Types | Drug Claim Name | Drug Name | PMIDs |
| Page: 1 |

Copyright 2023-Present -The University of Texas Health Science Center at Houston |