Schematic overview of the cellular and molecular mechanisms involved in the cancer progression, including the proposed cellular and molecular mechanisms in cancer cells trajectory. AT1: alveolar type 1 cells; AT2: alveolar type 2 cells; AAH: atypical adenomatous hyperplasia; AIS: adenocarcinoma in situ; MIA: minimally invasive adenocarcinoma; IA: invasive adenocarcinoma; EMT: epithelial-mesenchymal transition

Home

Download

Statistics

Help

Contact

Center for Computational Systems Medicine
leaf

Gene summary

leaf

Malignant transformation analysis

leaf

Malignant transformation related pathway analysis

leaf

Cell-cell communication analysis

leaf

Single-cell gene regulatory network inference analysis

leaf

Somatic mutation of malignant transformation related genes

leaf

Related drugs of malignant transformation related genes

Gene: SMARCA5

Gene summary for SMARCA5

check button Gene summary.

Gene informationSpeciesHuman
Gene symbol

SMARCA5

Gene ID

8467

Gene nameSWI/SNF related, matrix associated, actin dependent regulator of chromatin, subfamily a, member 5
Gene AliasISWI
Cytomap4q31.21
Gene Typeprotein-coding
GO ID

GO:0000183

UniProtAcc

O60264


Top

Malignant transformation analysis

check button Identification of the aberrant gene expression in precancerous and cancerous lesions by comparing the gene expression of stem-like cells in diseased tissues with normal stem cells
check button Malignant transformation involving gene list.
Entrez IDSymbolReplicatesSpeciesOrganTissueAdj P-valueLog2FCMalignancy
8467SMARCA5LZE4THumanEsophagusESCC1.11e-156.04e-010.0811
8467SMARCA5LZE5THumanEsophagusESCC2.00e-054.84e-010.0514
8467SMARCA5LZE7THumanEsophagusESCC1.05e-064.66e-010.0667
8467SMARCA5LZE8THumanEsophagusESCC2.74e-101.63e-010.067
8467SMARCA5LZE20THumanEsophagusESCC4.08e-031.38e-010.0662
8467SMARCA5LZE22D1HumanEsophagusHGIN1.72e-02-6.99e-020.0595
8467SMARCA5LZE22THumanEsophagusESCC3.39e-052.82e-010.068
8467SMARCA5LZE24THumanEsophagusESCC2.66e-143.91e-010.0596
8467SMARCA5LZE21THumanEsophagusESCC7.14e-102.76e-010.0655
8467SMARCA5LZE6THumanEsophagusESCC4.32e-041.64e-010.0845
8467SMARCA5P1T-EHumanEsophagusESCC4.06e-134.37e-010.0875
8467SMARCA5P2T-EHumanEsophagusESCC7.10e-631.24e+000.1177
8467SMARCA5P4T-EHumanEsophagusESCC2.45e-338.01e-010.1323
8467SMARCA5P5T-EHumanEsophagusESCC3.06e-233.37e-010.1327
8467SMARCA5P8T-EHumanEsophagusESCC2.84e-255.80e-010.0889
8467SMARCA5P9T-EHumanEsophagusESCC7.93e-163.45e-010.1131
8467SMARCA5P10T-EHumanEsophagusESCC4.38e-276.61e-010.116
8467SMARCA5P11T-EHumanEsophagusESCC1.27e-249.45e-010.1426
8467SMARCA5P12T-EHumanEsophagusESCC3.65e-501.14e+000.1122
8467SMARCA5P15T-EHumanEsophagusESCC2.56e-338.48e-010.1149
Page: 1 2 3 4 5 6 7 8 

check button Transcriptomic changes along malignancy continuum.
TissueExpression DynamicsAbbreviation
EsophagusThe image shows the transcriptomic changes along malignancy continuum.log2FC in expression of this searched gene in stem-like cells from each diseased tissue sample relative to stem-like cells in normal samples in each tissue plotted against the malignancy continuum. Samples are colored based on if they are from different disease stage.
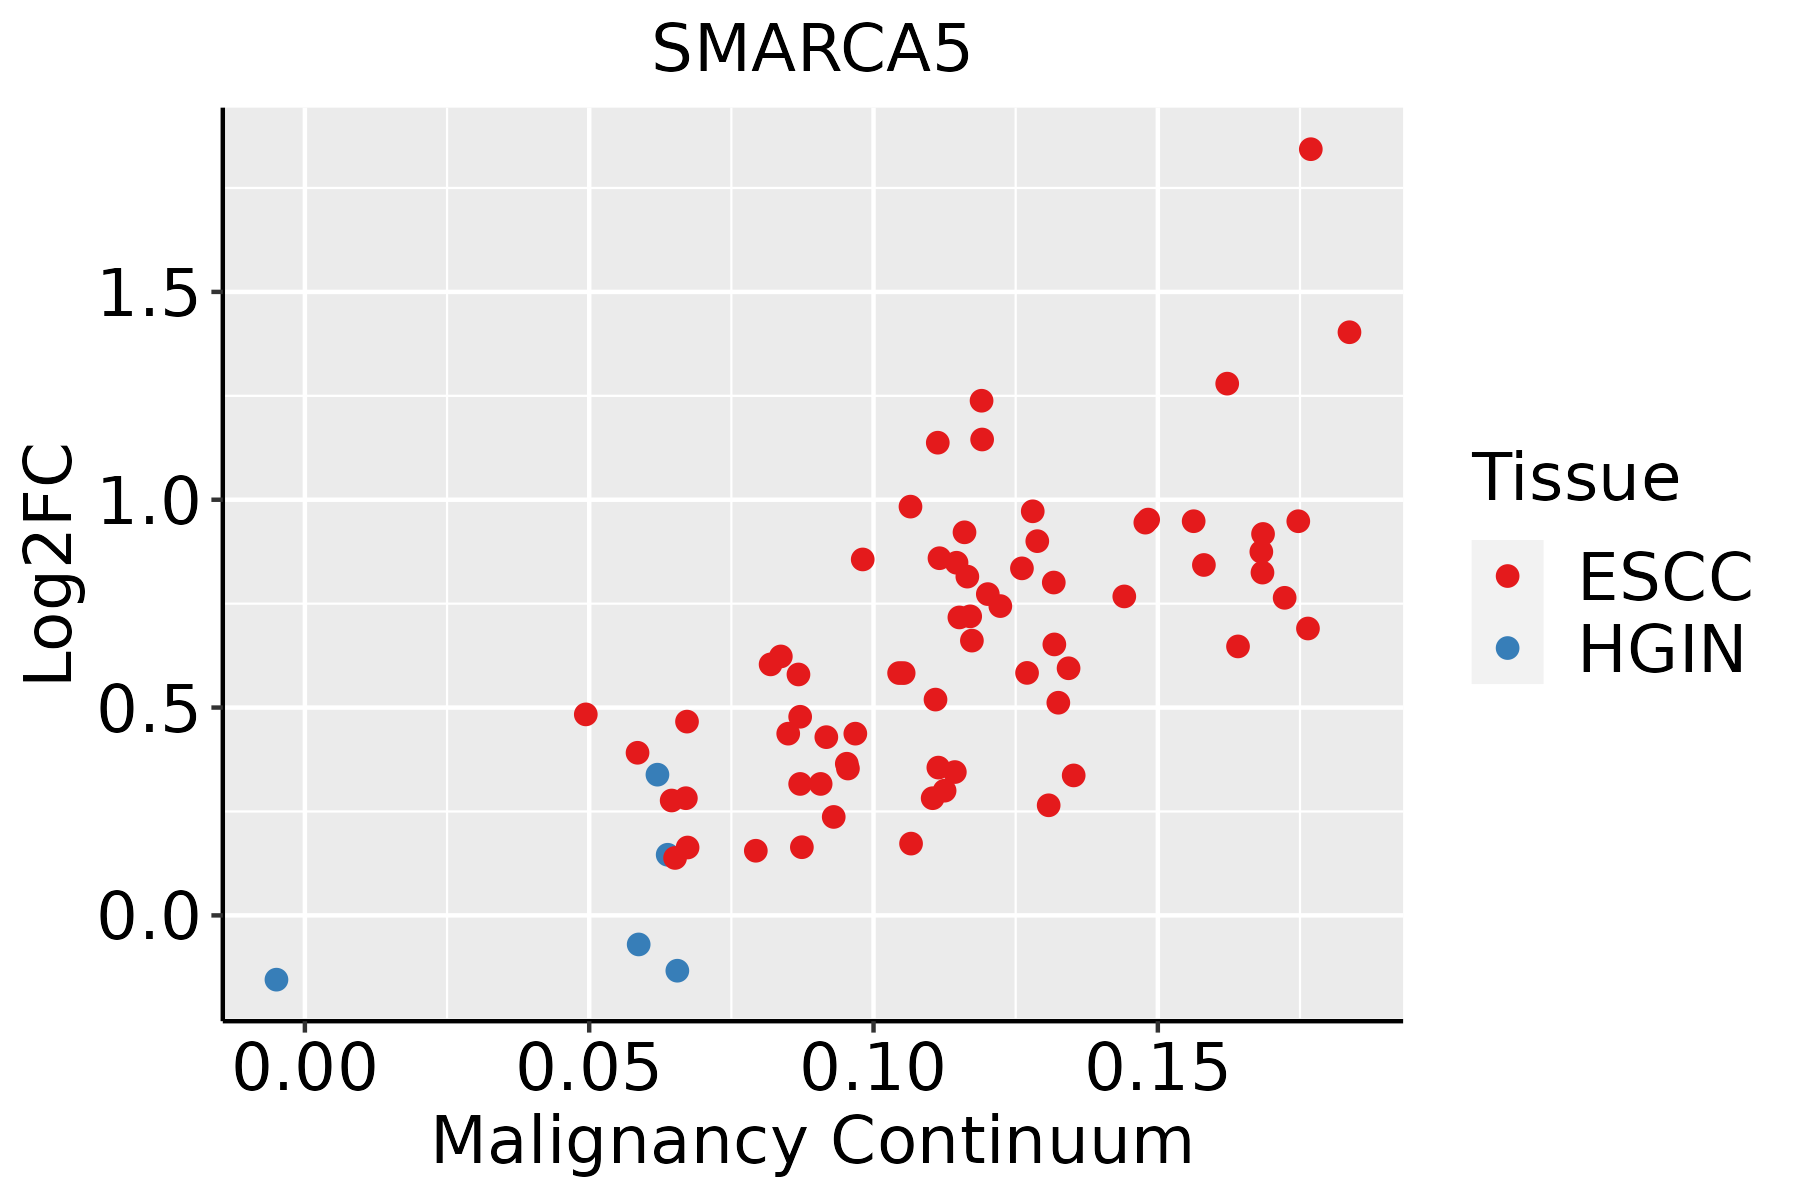
ESCC: Esophageal squamous cell carcinoma
HGIN: High-grade intraepithelial neoplasias
LGIN: Low-grade intraepithelial neoplasias
LiverThe image shows the transcriptomic changes along malignancy continuum.log2FC in expression of this searched gene in stem-like cells from each diseased tissue sample relative to stem-like cells in normal samples in each tissue plotted against the malignancy continuum. Samples are colored based on if they are from different disease stage.
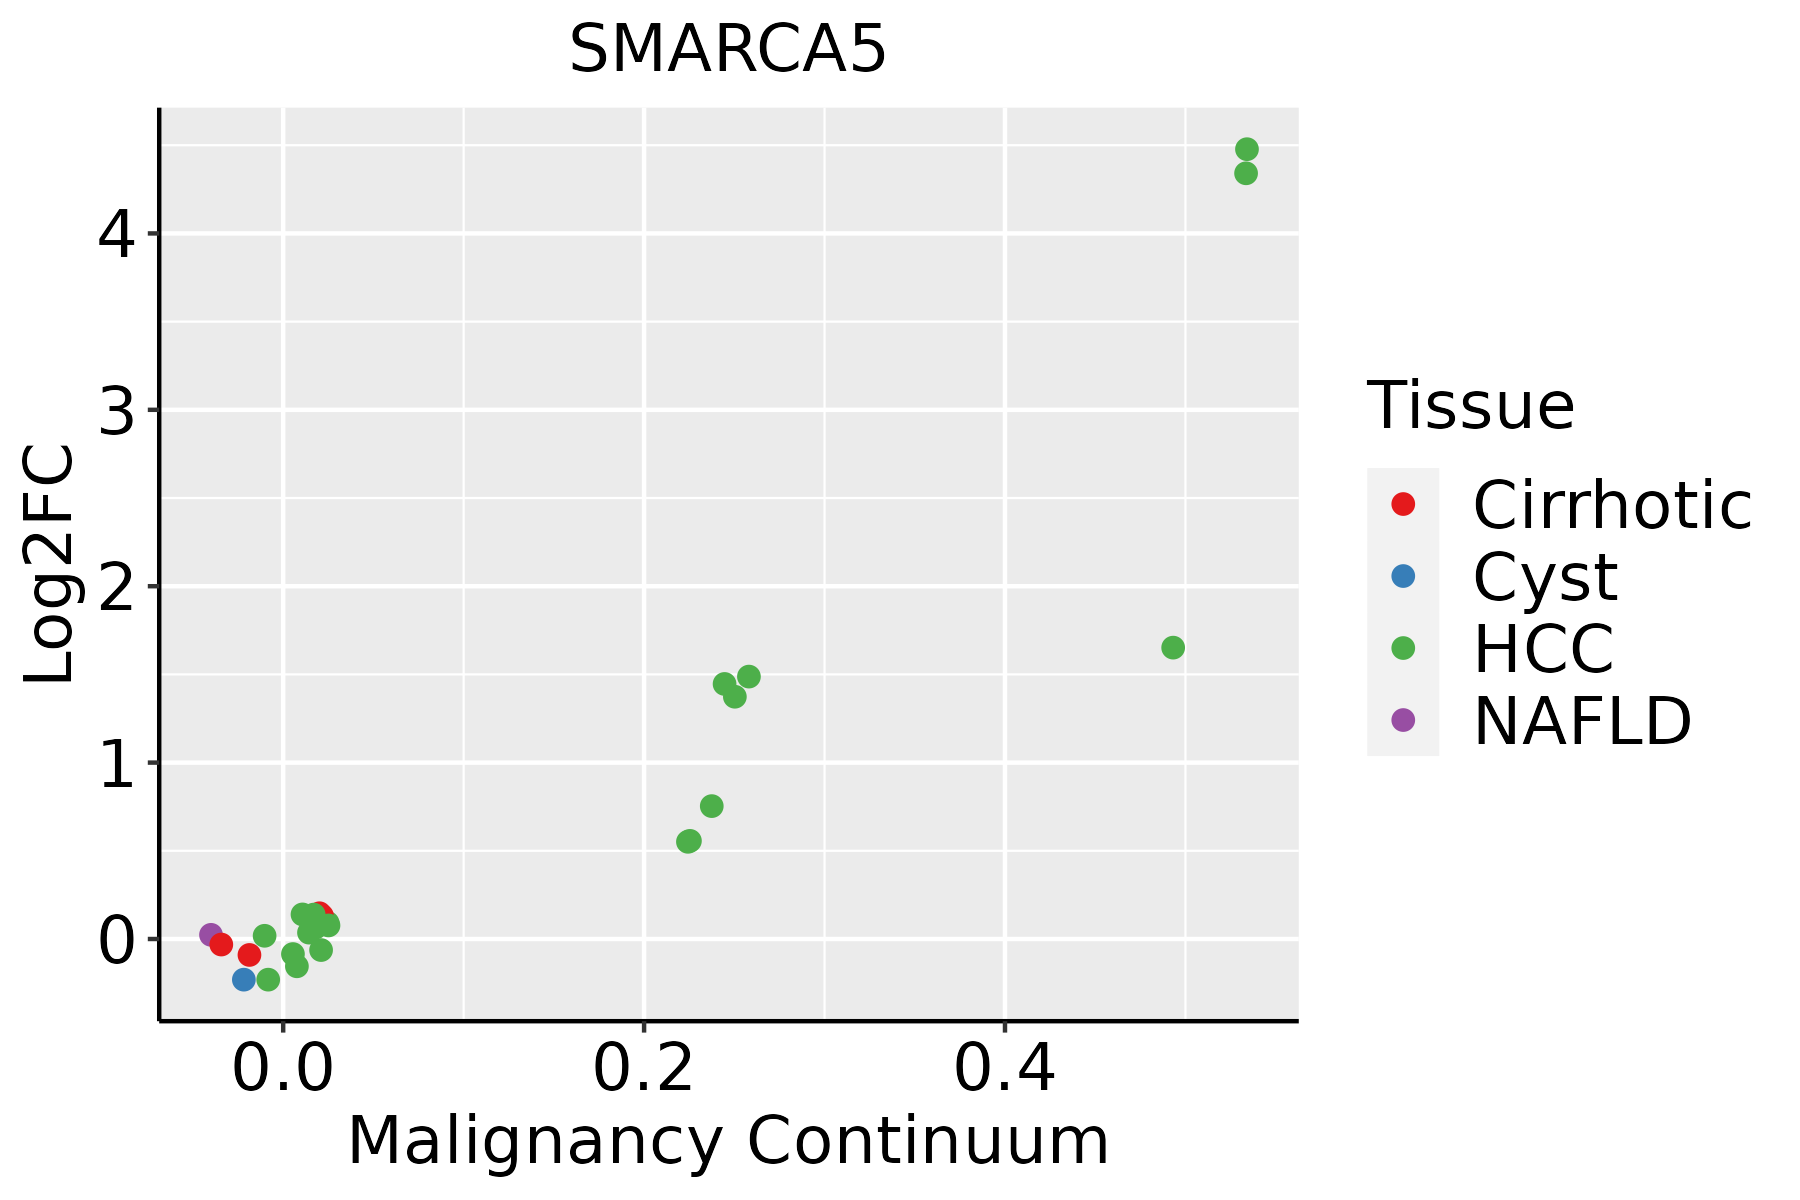
HCC: Hepatocellular carcinoma
NAFLD: Non-alcoholic fatty liver disease
Oral CavityThe image shows the transcriptomic changes along malignancy continuum.log2FC in expression of this searched gene in stem-like cells from each diseased tissue sample relative to stem-like cells in normal samples in each tissue plotted against the malignancy continuum. Samples are colored based on if they are from different disease stage.
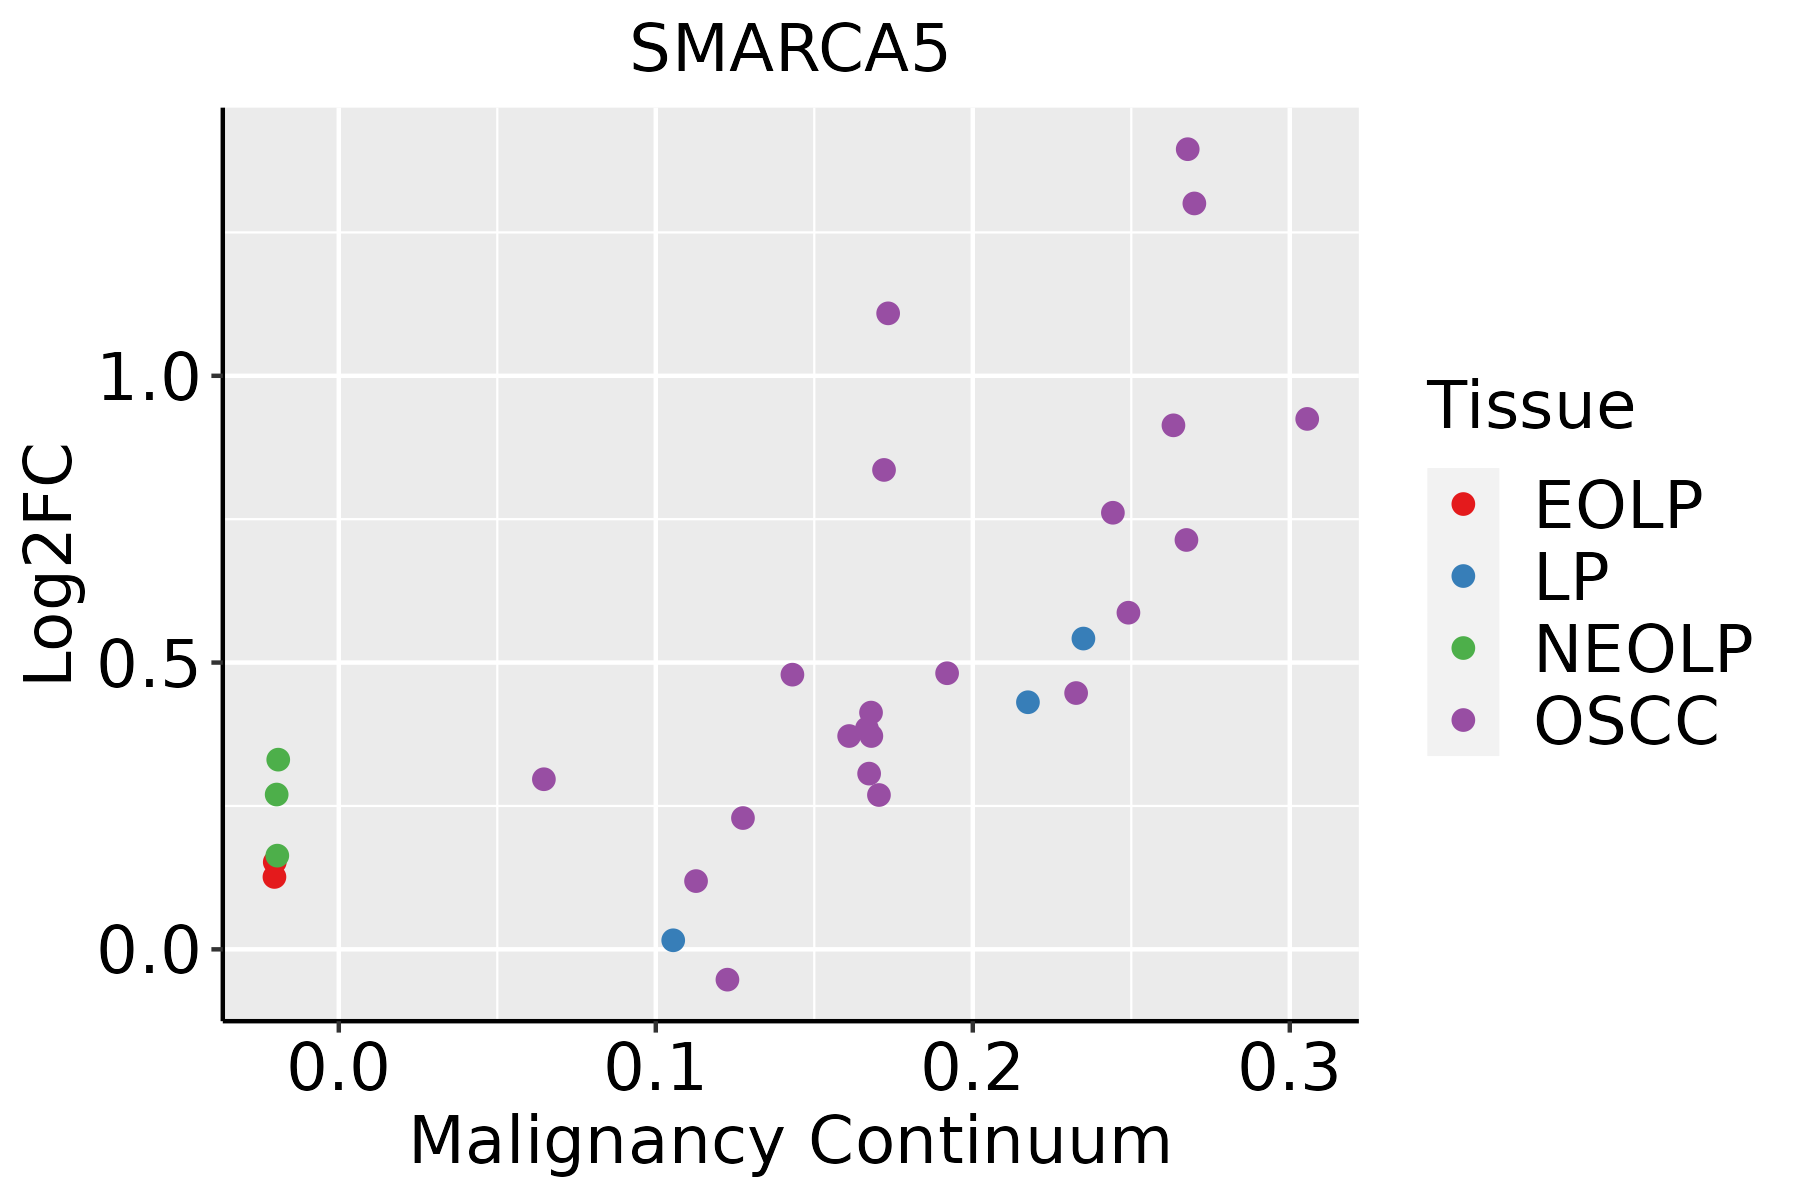
EOLP: Erosive Oral lichen planus
LP: leukoplakia
NEOLP: Non-erosive oral lichen planus
OSCC: Oral squamous cell carcinoma
ProstateThe image shows the transcriptomic changes along malignancy continuum.log2FC in expression of this searched gene in stem-like cells from each diseased tissue sample relative to stem-like cells in normal samples in each tissue plotted against the malignancy continuum. Samples are colored based on if they are from different disease stage.
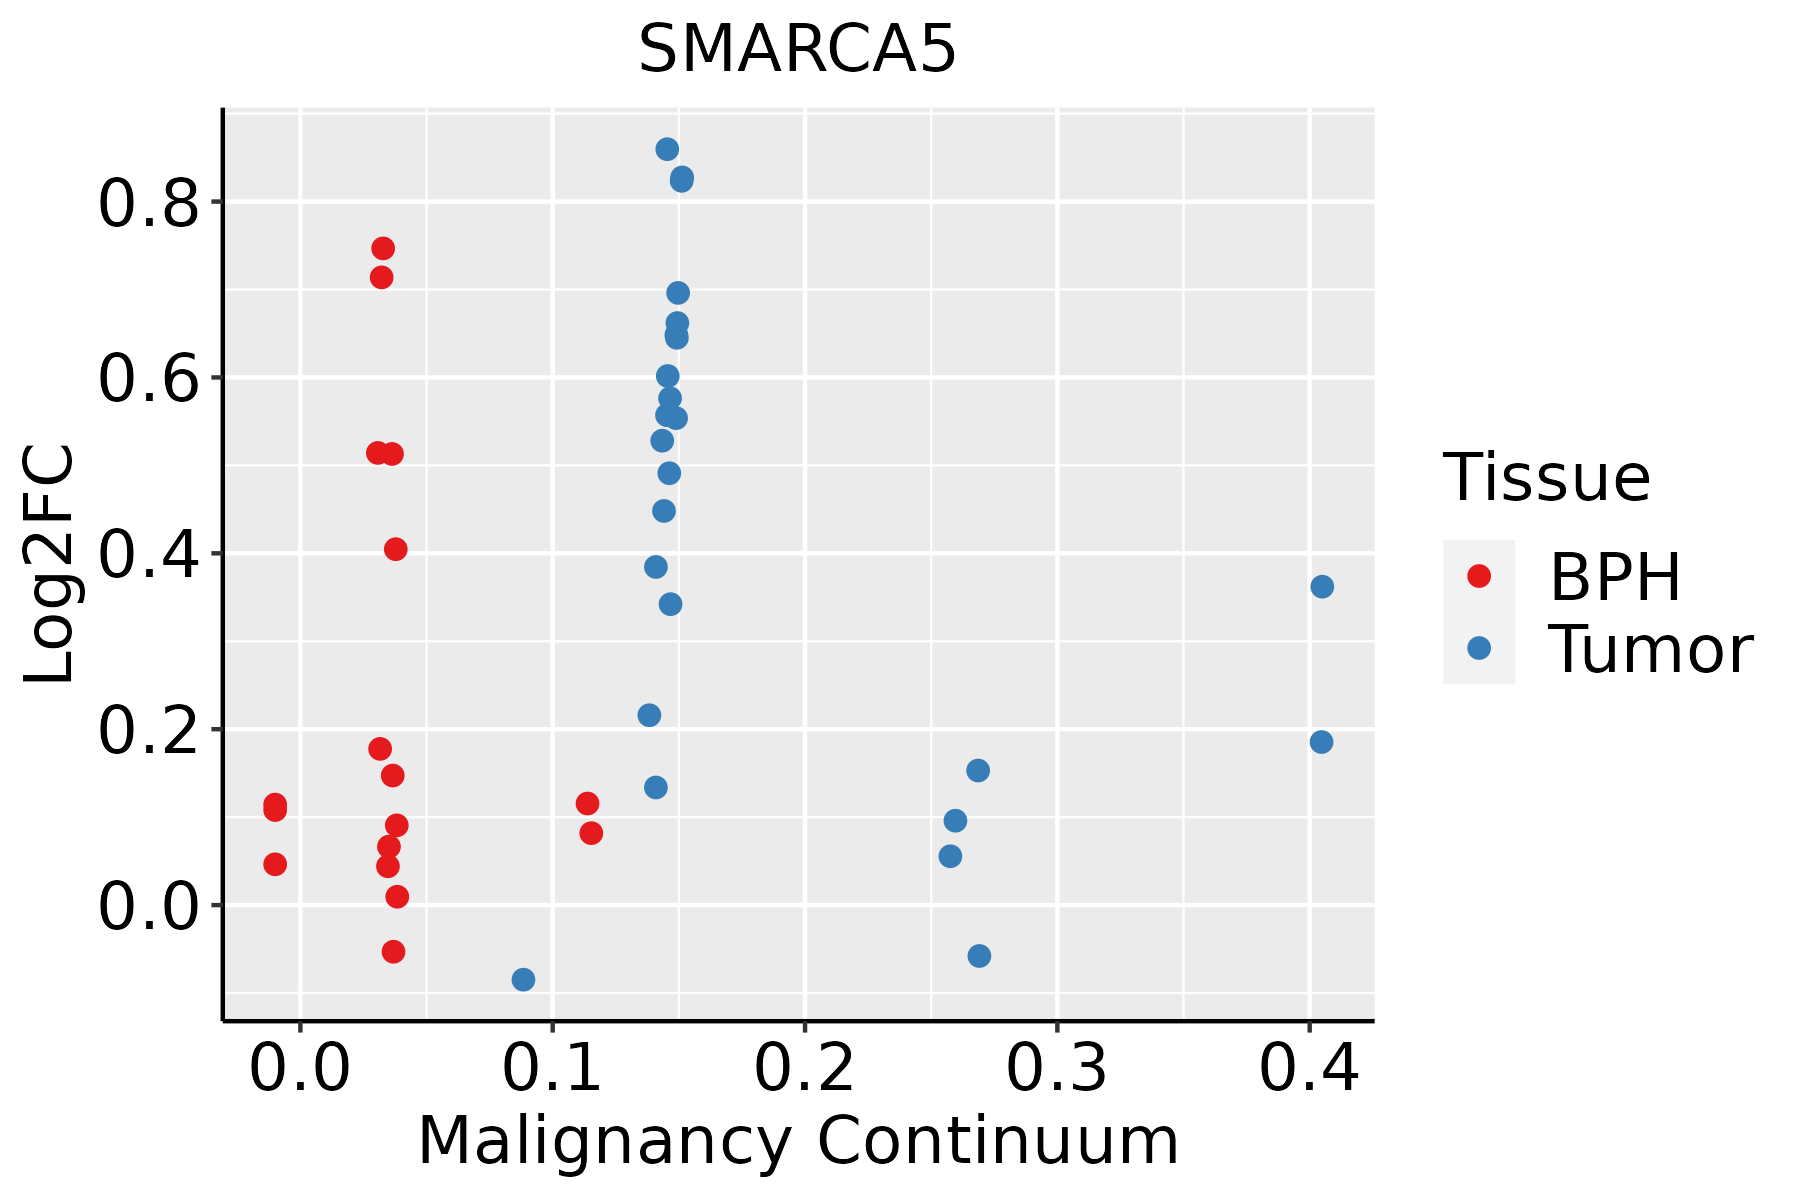
BPH: Benign Prostatic Hyperplasia
SkinThe image shows the transcriptomic changes along malignancy continuum.log2FC in expression of this searched gene in stem-like cells from each diseased tissue sample relative to stem-like cells in normal samples in each tissue plotted against the malignancy continuum. Samples are colored based on if they are from different disease stage.AK: Actinic keratosis
cSCC: Cutaneous squamous cell carcinoma
SCCIS:squamous cell carcinoma in situ
ThyroidThe image shows the transcriptomic changes along malignancy continuum.log2FC in expression of this searched gene in stem-like cells from each diseased tissue sample relative to stem-like cells in normal samples in each tissue plotted against the malignancy continuum. Samples are colored based on if they are from different disease stage.ATC: Anaplastic thyroid cancer
HT: Hashimoto's thyroiditis
PTC: Papillary thyroid cancer
∗log2FC in expression of this searched gene in stem-like cells from each diseased tissue sample relative to stem-like cells in normal samples in each tissue plotted against the malignancy continuum. Samples are colored based on if they are from different disease stage.

Top

Malignant transformation related pathway analysis

check buttonFind out the enriched GO biological processes and KEGG pathways involved in transition from healthy to precancer to cancer
check button Figure of enriched GO biological processes.
TissueDisease StageEnriched GO biological Processes
ColorectumADGO analysis - Figure of enriched GO biological processes: Top 15 enriched GO BP terms are showed in the bar plot of each disease state in each tissue. Each row represents a significant GO biological process which is colored according to the -log10(p.adjust).
ColorectumSERGO analysis - Figure of enriched GO biological processes: Top 15 enriched GO BP terms are showed in the bar plot of each disease state in each tissue. Each row represents a significant GO biological process which is colored according to the -log10(p.adjust).
ColorectumMSSGO analysis - Figure of enriched GO biological processes: Top 15 enriched GO BP terms are showed in the bar plot of each disease state in each tissue. Each row represents a significant GO biological process which is colored according to the -log10(p.adjust).
ColorectumMSI-HGO analysis - Figure of enriched GO biological processes: Top 15 enriched GO BP terms are showed in the bar plot of each disease state in each tissue. Each row represents a significant GO biological process which is colored according to the -log10(p.adjust).
ColorectumFAPGO analysis - Figure of enriched GO biological processes: Top 15 enriched GO BP terms are showed in the bar plot of each disease state in each tissue. Each row represents a significant GO biological process which is colored according to the -log10(p.adjust).
∗Top 15 enriched GO BP terms are showed in the bar plot of each disease state in each tissue. Each row represents a significant GO biological process which is colored according to the -log10(p.adjust).
Page: 1 2 3 4 5 6 7 8 9 

check button Enriched GO biological processes.
GO IDTissueDisease StageDescriptionGene RatioBg Ratiopvaluep.adjustCount
GO:000632516EsophagusHGINchromatin organization92/2587409/187231.05e-064.16e-0592
GO:00069975EsophagusHGINnucleus organization34/2587133/187232.20e-044.00e-0334
GO:00063523EsophagusHGINDNA-templated transcription, initiation30/2587130/187232.86e-032.79e-0230
GO:19908308EsophagusHGINcellular response to leukemia inhibitory factor23/258794/187233.92e-033.54e-0223
GO:19908238EsophagusHGINresponse to leukemia inhibitory factor23/258795/187234.51e-033.93e-0223
GO:000699713EsophagusESCCnucleus organization96/8552133/187234.66e-101.21e-0896
GO:000632517EsophagusESCCchromatin organization240/8552409/187236.52e-081.14e-06240
GO:00400295EsophagusESCCregulation of gene expression, epigenetic74/8552105/187232.24e-073.42e-0674
GO:000635211EsophagusESCCDNA-templated transcription, initiation86/8552130/187231.88e-062.19e-0586
GO:199082316EsophagusESCCresponse to leukemia inhibitory factor60/855295/187234.41e-042.48e-0360
GO:199083015EsophagusESCCcellular response to leukemia inhibitory factor59/855294/187236.19e-043.32e-0359
GO:00708281EsophagusESCCheterochromatin organization31/855246/187232.42e-031.06e-0231
GO:0045814EsophagusESCCnegative regulation of gene expression, epigenetic32/855250/187236.90e-032.52e-0232
GO:0006997LiverCirrhoticnucleus organization48/4634133/187232.27e-031.38e-0248
GO:00069971LiverHCCnucleus organization82/7958133/187236.32e-067.72e-0582
GO:0006352LiverHCCDNA-templated transcription, initiation78/7958130/187234.19e-054.11e-0478
GO:000632511LiverHCCchromatin organization206/7958409/187237.23e-044.41e-03206
GO:0040029LiverHCCregulation of gene expression, epigenetic61/7958105/187239.02e-045.31e-0361
GO:00069974Oral cavityOSCCnucleus organization85/7305133/187235.12e-091.12e-0785
GO:19908237Oral cavityOSCCresponse to leukemia inhibitory factor58/730595/187231.10e-051.14e-0458
Page: 1 2 3 4 5 

check button Enriched KEGG pathways.
Pathway IDTissueDisease StageDescriptionGene RatioBg Ratiopvaluep.adjustqvalueCount
Page: 1 

Top

Cell-cell communication analysis

check buttonIdentification of potential cell-cell interactions between two cell types and their ligand-receptor pairs for different disease states
LigandReceptorLRpairPathwayTissueDisease Stage
Page: 1 

Top

Single-cell gene regulatory network inference analysis

check buttonFind out the significant the regulons (TFs) and the target genes of each regulon across cell types for different disease states
TFCell TypeTissueDisease StageTarget GeneRSSRegulon Activity
SMARCA5CD4TNColorectumHealthyTRIM73,POLR3B,SF3B1, etc.2.31e-02The dot plots of a searched regulon are shown for all cell subpopulations in each disease state of each tissue based on the regulon specific score inferred using pySCENIC and by calculating the average expression.
SMARCA5CD4TNColorectumMSI-HTRIM73,POLR3B,SF3B1, etc.3.63e-02The dot plots of a searched regulon are shown for all cell subpopulations in each disease state of each tissue based on the regulon specific score inferred using pySCENIC and by calculating the average expression.
SMARCA5PERIColorectumFAPNUP50,MRNIP,FAM149A, etc.4.93e-02The dot plots of a searched regulon are shown for all cell subpopulations in each disease state of each tissue based on the regulon specific score inferred using pySCENIC and by calculating the average expression.
SMARCA5ICAFColorectumMSI-HNUP50,MRNIP,FAM149A, etc.2.63e-01The dot plots of a searched regulon are shown for all cell subpopulations in each disease state of each tissue based on the regulon specific score inferred using pySCENIC and by calculating the average expression.
SMARCA5iATCThyroidHealthyUSP9X,MYOF,ISG20L2, etc.7.48e-02The dot plots of a searched regulon are shown for all cell subpopulations in each disease state of each tissue based on the regulon specific score inferred using pySCENIC and by calculating the average expression.
SMARCA5TH1ThyroidADJITGA4,GOLGB1,SMC5, etc.2.43e-02The dot plots of a searched regulon are shown for all cell subpopulations in each disease state of each tissue based on the regulon specific score inferred using pySCENIC and by calculating the average expression.
SMARCA5GCThyroidADJITGA4,GOLGB1,SMC5, etc.2.52e-03The dot plots of a searched regulon are shown for all cell subpopulations in each disease state of each tissue based on the regulon specific score inferred using pySCENIC and by calculating the average expression.
SMARCA5TH1ThyroidATCITGA4,GOLGB1,SMC5, etc.8.90e-02The dot plots of a searched regulon are shown for all cell subpopulations in each disease state of each tissue based on the regulon specific score inferred using pySCENIC and by calculating the average expression.
SMARCA5INMONThyroidHTITGA4,GOLGB1,SMC5, etc.3.61e-02The dot plots of a searched regulon are shown for all cell subpopulations in each disease state of each tissue based on the regulon specific score inferred using pySCENIC and by calculating the average expression.
SMARCA5M2MACThyroidHTITGA4,GOLGB1,SMC5, etc.2.09e-02The dot plots of a searched regulon are shown for all cell subpopulations in each disease state of each tissue based on the regulon specific score inferred using pySCENIC and by calculating the average expression.
∗The dot plots of a searched regulon are shown for all cell subpopulations in each disease state of each tissue based on the regulon specific score inferred using pySCENIC and by calculating the average expression.
Page: 1 

Top

Somatic mutation of malignant transformation related genes

check buttonAnnotation of somatic variants for genes involved in malignant transformation
Hugo SymbolVariant ClassVariant ClassificationdbSNP RSHGVScHGVSpHGVSp ShortSWISSPROTBIOTYPESIFTPolyPhenTumor Sample BarcodeTissueHistologySexAgeStageTherapy TypesDrugsOutcome
SMARCA5SNVMissense_Mutationc.2629N>Gp.Pro877Alap.P877AO60264protein_codingtolerated(0.36)benign(0)TCGA-5L-AAT1-01Breastbreast invasive carcinomaFemale<65III/IVHormone TherapyletrozolSD
SMARCA5SNVMissense_Mutationc.1759N>Ap.Leu587Ilep.L587IO60264protein_codingdeleterious(0)possibly_damaging(0.812)TCGA-A8-A07W-01Breastbreast invasive carcinomaFemale>=65III/IVHormone TherapyexemestaneSD
SMARCA5SNVMissense_Mutationnovelc.2105A>Cp.Asn702Thrp.N702TO60264protein_codingtolerated(0.07)benign(0.022)TCGA-AN-A046-01Breastbreast invasive carcinomaFemale>=65I/IIUnknownUnknownSD
SMARCA5SNVMissense_Mutationc.1034A>Gp.His345Argp.H345RO60264protein_codingdeleterious(0.04)benign(0.444)TCGA-AN-A0XU-01Breastbreast invasive carcinomaFemale<65I/IIUnknownUnknownSD
SMARCA5SNVMissense_Mutationc.2401N>Tp.Pro801Serp.P801SO60264protein_codingtolerated(0.07)benign(0.219)TCGA-AR-A24S-01Breastbreast invasive carcinomaFemale<65I/IIHormone TherapyanastrozoleSD
SMARCA5SNVMissense_Mutationnovelc.2562N>Gp.Ile854Metp.I854MO60264protein_codingdeleterious(0.02)possibly_damaging(0.868)TCGA-XX-A89A-01Breastbreast invasive carcinomaFemale>=65I/IIUnknownUnknownSD
SMARCA5deletionFrame_Shift_Delnovelc.957delNp.Lys319AsnfsTer5p.K319Nfs*5O60264protein_codingTCGA-D8-A27V-01Breastbreast invasive carcinomaFemale<65I/IIHormone TherapytamoxiphenSD
SMARCA5SNVMissense_Mutationrs764115299c.371G>Ap.Arg124Hisp.R124HO60264protein_codingtolerated(0.07)benign(0.022)TCGA-2W-A8YY-01Cervixcervical & endocervical cancerFemale<65I/IIChemotherapycisplatinCR
SMARCA5SNVMissense_Mutationrs868118261c.1817G>Ap.Arg606Hisp.R606HO60264protein_codingdeleterious(0)probably_damaging(0.987)TCGA-2W-A8YY-01Cervixcervical & endocervical cancerFemale<65I/IIChemotherapycisplatinCR
SMARCA5SNVMissense_Mutationrs749535799c.2405G>Ap.Arg802Glnp.R802QO60264protein_codingtolerated(0.37)benign(0.011)TCGA-2W-A8YY-01Cervixcervical & endocervical cancerFemale<65I/IIChemotherapycisplatinCR
Page: 1 2 3 4 5 6 7 8 9 10 11 

Top

Related drugs of malignant transformation related genes

check buttonIdentification of chemicals and drugs interact with genes involved in malignant transfromation
(DGIdb 4.0)
Entrez IDSymbolCategoryInteraction TypesDrug Claim NameDrug NamePMIDs
Page: 1