
|
|||||
|
 | |
| |
| |
| |
| |
| |
|
Gene: SMARCA4 |
Gene summary for SMARCA4 |
| Gene information | Species | Human | Gene symbol | SMARCA4 | Gene ID | 6597 |
| Gene name | SWI/SNF related, matrix associated, actin dependent regulator of chromatin, subfamily a, member 4 | |
| Gene Alias | BAF190 | |
| Cytomap | 19p13.2 | |
| Gene Type | protein-coding | GO ID | GO:0000122 | UniProtAcc | A7E2E1 |
Top |
Malignant transformation analysis |
| Identification of the aberrant gene expression in precancerous and cancerous lesions by comparing the gene expression of stem-like cells in diseased tissues with normal stem cells |
| Entrez ID | Symbol | Replicates | Species | Organ | Tissue | Adj P-value | Log2FC | Malignancy |
| 6597 | SMARCA4 | GSM4909282 | Human | Breast | IDC | 2.64e-12 | 5.28e-01 | -0.0288 |
| 6597 | SMARCA4 | GSM4909290 | Human | Breast | IDC | 1.53e-08 | 4.10e-01 | 0.2096 |
| 6597 | SMARCA4 | GSM4909291 | Human | Breast | IDC | 4.08e-04 | 3.27e-01 | 0.1753 |
| 6597 | SMARCA4 | GSM4909297 | Human | Breast | IDC | 2.06e-04 | -3.92e-03 | 0.1517 |
| 6597 | SMARCA4 | GSM4909298 | Human | Breast | IDC | 2.15e-04 | 2.95e-01 | 0.1551 |
| 6597 | SMARCA4 | GSM4909308 | Human | Breast | IDC | 1.82e-04 | 2.48e-01 | 0.158 |
| 6597 | SMARCA4 | GSM4909311 | Human | Breast | IDC | 1.80e-16 | -8.22e-02 | 0.1534 |
| 6597 | SMARCA4 | GSM4909319 | Human | Breast | IDC | 2.95e-20 | -6.76e-02 | 0.1563 |
| 6597 | SMARCA4 | GSM4909321 | Human | Breast | IDC | 1.30e-07 | 4.26e-02 | 0.1559 |
| 6597 | SMARCA4 | brca2 | Human | Breast | Precancer | 1.51e-02 | 1.42e-01 | -0.024 |
| 6597 | SMARCA4 | brca3 | Human | Breast | Precancer | 3.55e-04 | 1.78e-01 | -0.0263 |
| 6597 | SMARCA4 | M1 | Human | Breast | IDC | 1.59e-10 | 4.38e-01 | 0.1577 |
| 6597 | SMARCA4 | NCCBC5 | Human | Breast | DCIS | 2.64e-02 | -1.68e-01 | 0.2046 |
| 6597 | SMARCA4 | P1 | Human | Breast | IDC | 3.75e-07 | 9.45e-02 | 0.1527 |
| 6597 | SMARCA4 | DCIS2 | Human | Breast | DCIS | 2.07e-46 | 2.23e-01 | 0.0085 |
| 6597 | SMARCA4 | HTA11_347_2000001011 | Human | Colorectum | AD | 2.20e-05 | 4.25e-01 | -0.1954 |
| 6597 | SMARCA4 | HTA11_866_2000001011 | Human | Colorectum | AD | 1.97e-03 | 3.68e-01 | -0.1001 |
| 6597 | SMARCA4 | HTA11_1391_2000001011 | Human | Colorectum | AD | 1.79e-05 | 5.88e-01 | -0.059 |
| 6597 | SMARCA4 | HTA11_7696_3000711011 | Human | Colorectum | AD | 3.28e-16 | 7.71e-01 | 0.0674 |
| 6597 | SMARCA4 | HTA11_99999965104_69814 | Human | Colorectum | MSS | 2.07e-05 | 6.16e-01 | 0.281 |
| Page: 1 2 3 4 5 6 7 8 9 10 |
| Tissue | Expression Dynamics | Abbreviation |
| Breast | 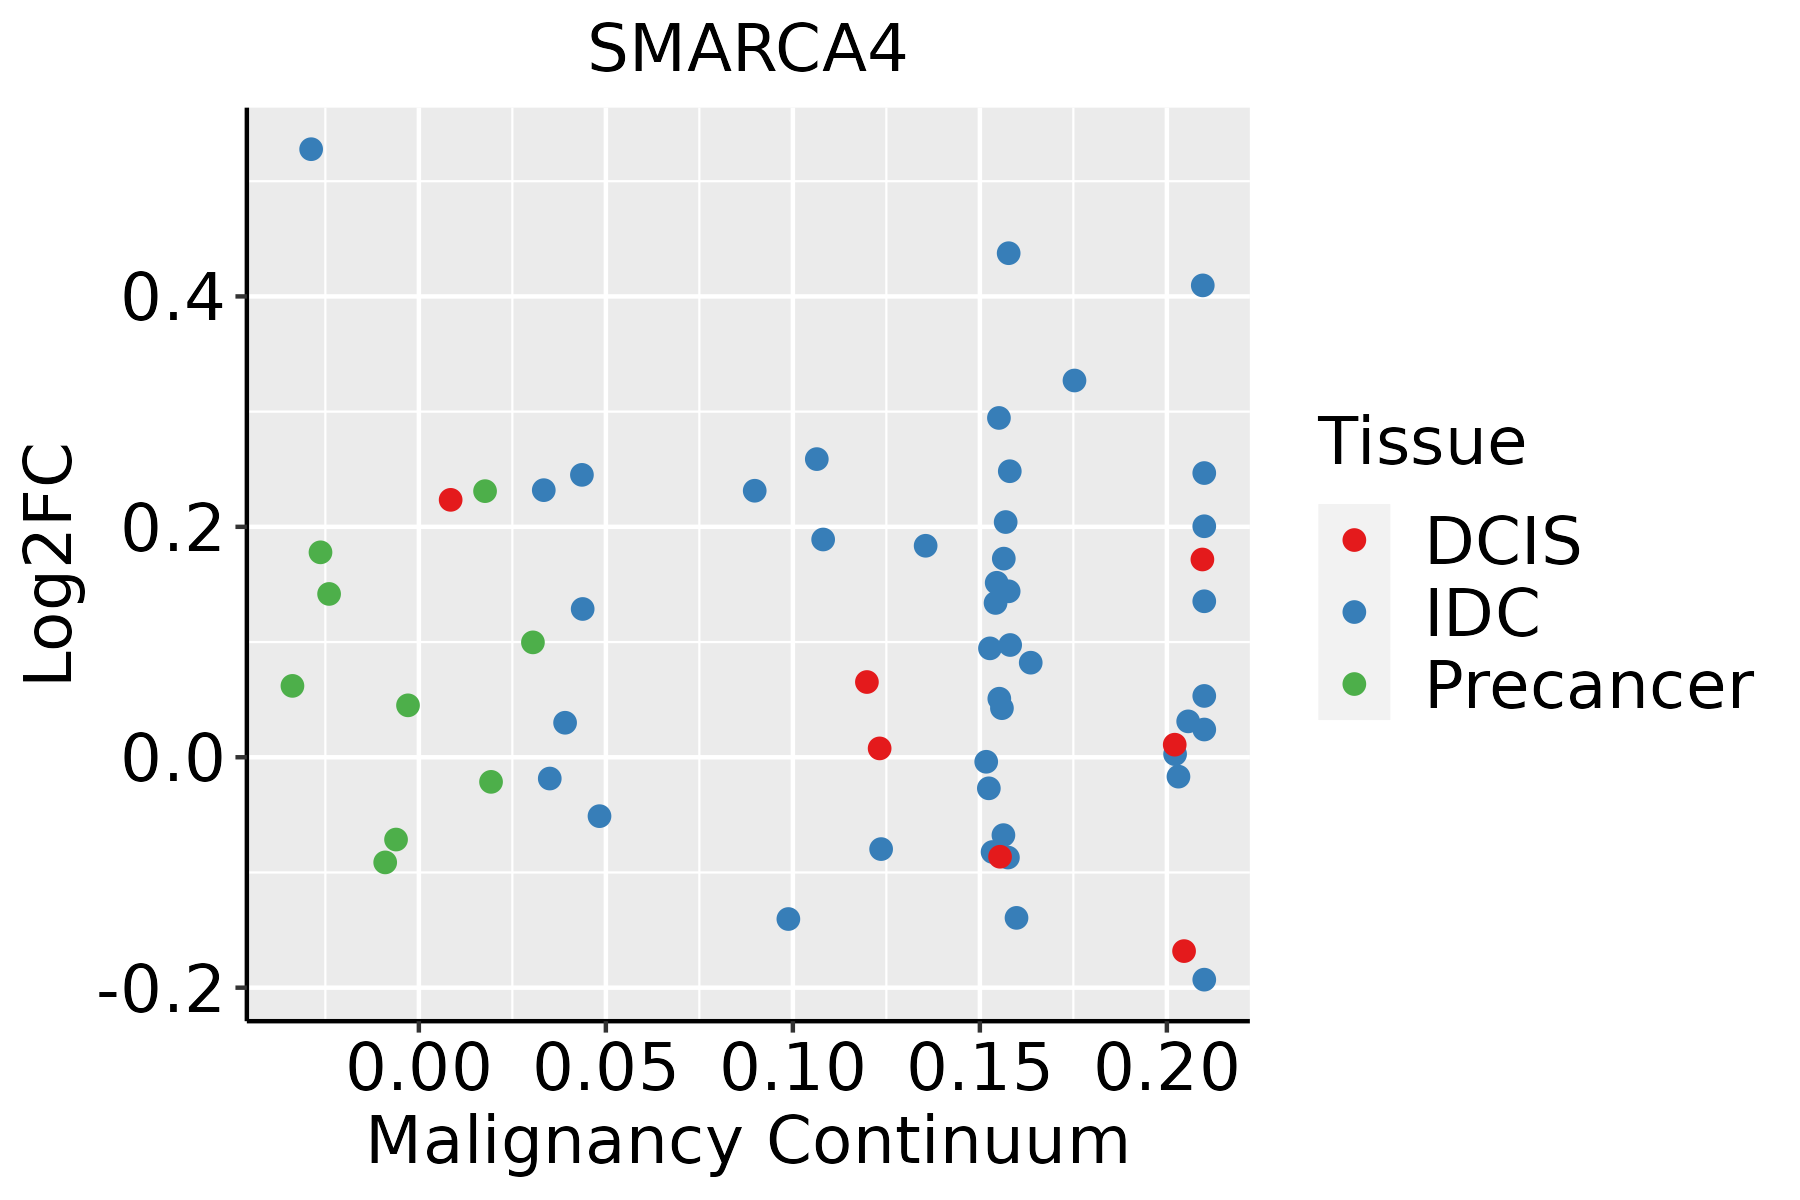 | IDC: Invasive ductal carcinoma |
| DCIS: Ductal carcinoma in situ | ||
| Precancer(BRCA1-mut): Precancerous lesion from BRCA1 mutation carriers | ||
| Colorectum (GSE201348) |  | FAP: Familial adenomatous polyposis |
| CRC: Colorectal cancer | ||
| Colorectum (HTA11) |  | AD: Adenomas |
| SER: Sessile serrated lesions | ||
| MSI-H: Microsatellite-high colorectal cancer | ||
| MSS: Microsatellite stable colorectal cancer | ||
| Endometrium |  | AEH: Atypical endometrial hyperplasia |
| EEC: Endometrioid Cancer | ||
| Esophagus |  | ESCC: Esophageal squamous cell carcinoma |
| HGIN: High-grade intraepithelial neoplasias | ||
| LGIN: Low-grade intraepithelial neoplasias | ||
| Liver | 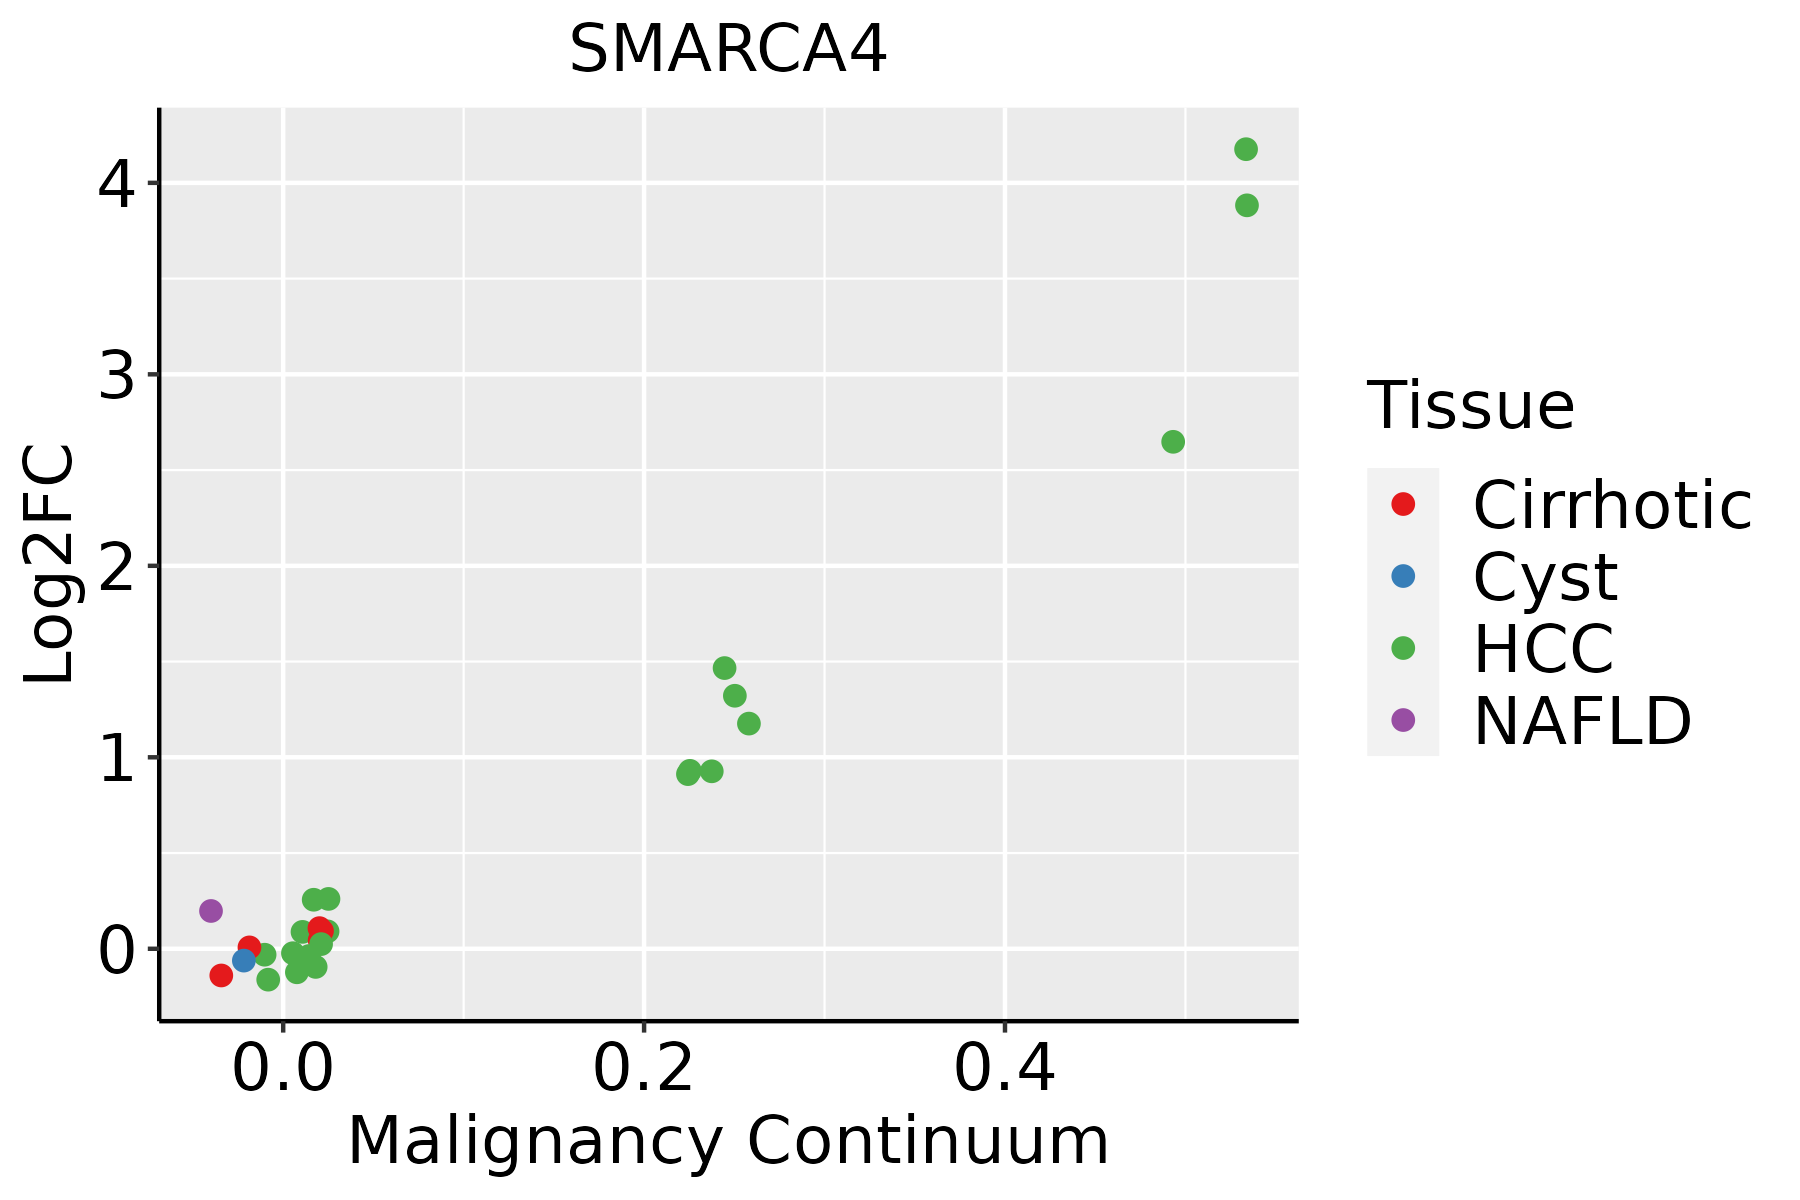 | HCC: Hepatocellular carcinoma |
| NAFLD: Non-alcoholic fatty liver disease | ||
| Oral Cavity | 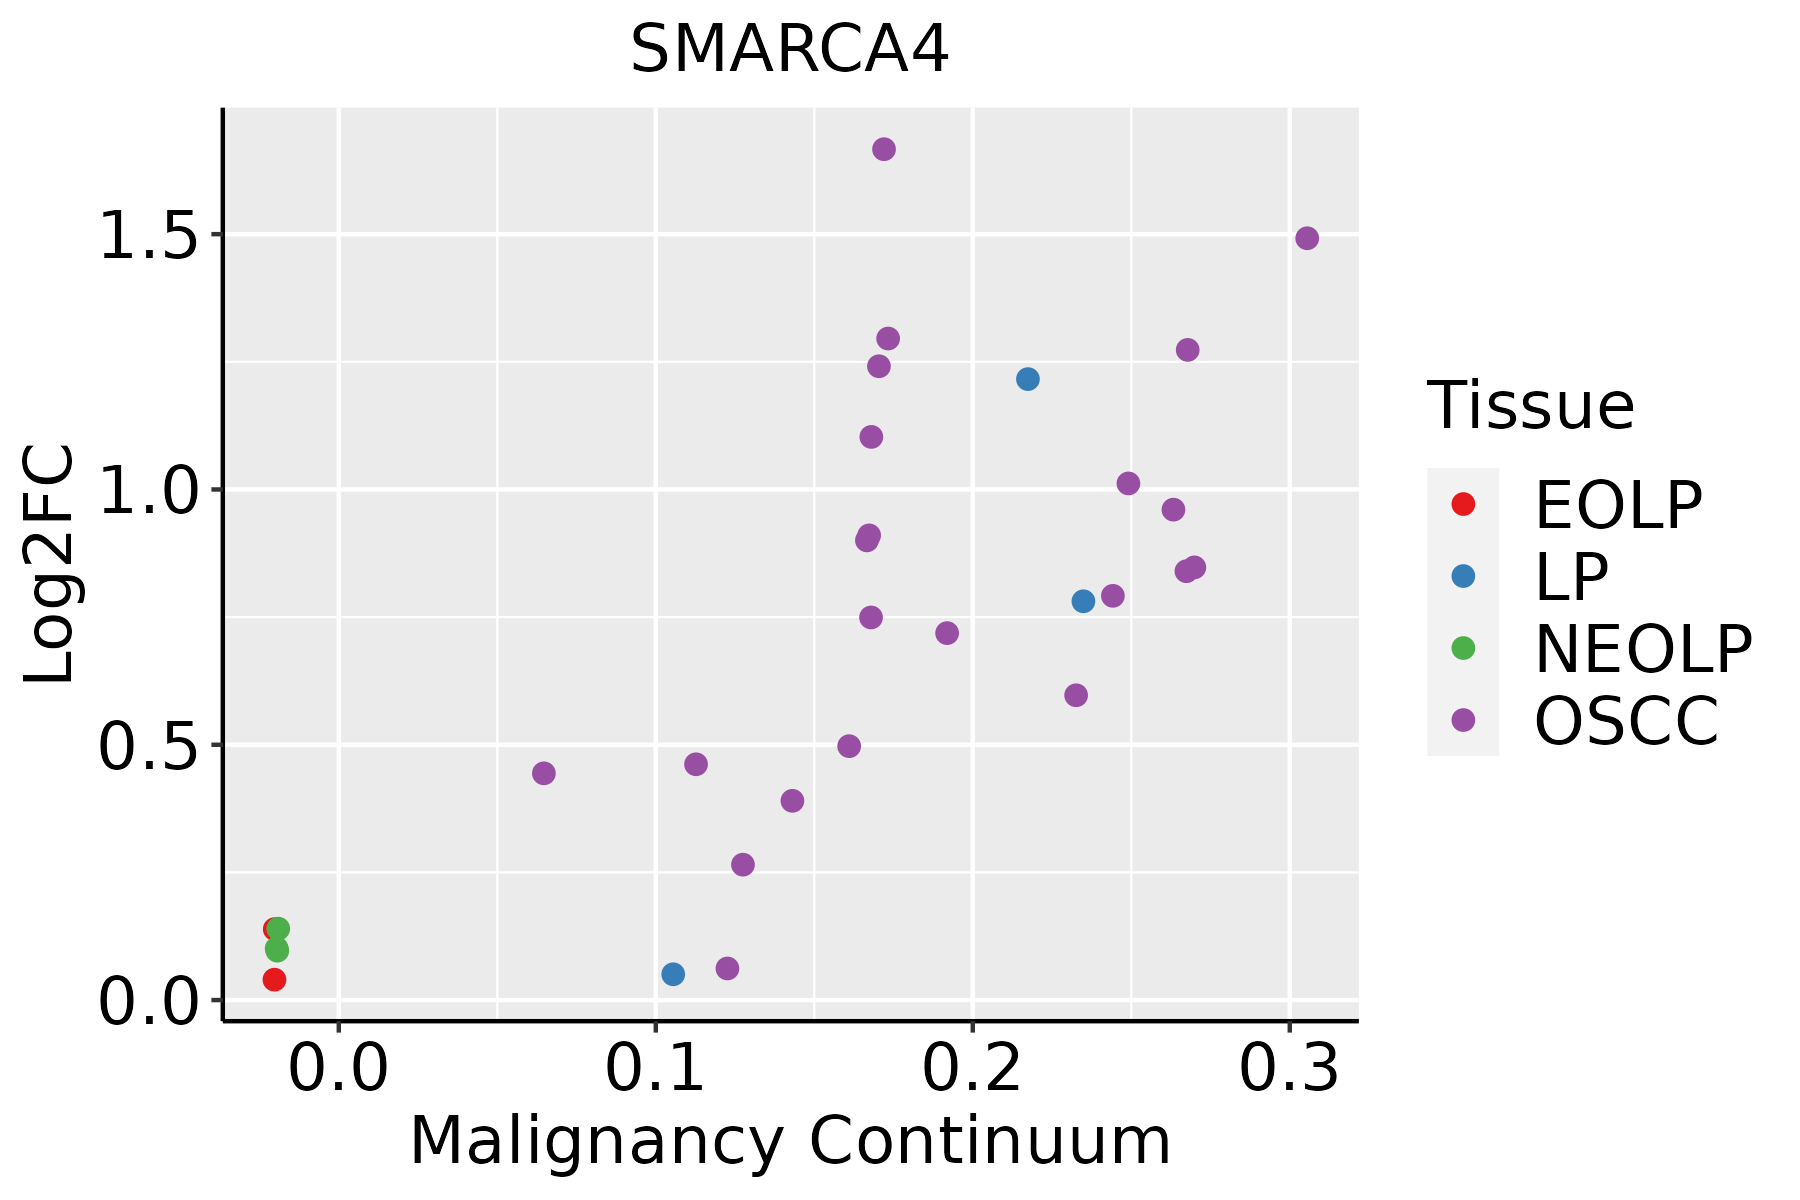 | EOLP: Erosive Oral lichen planus |
| LP: leukoplakia | ||
| NEOLP: Non-erosive oral lichen planus | ||
| OSCC: Oral squamous cell carcinoma | ||
| Skin |  | AK: Actinic keratosis |
| cSCC: Cutaneous squamous cell carcinoma | ||
| SCCIS:squamous cell carcinoma in situ | ||
| Thyroid | 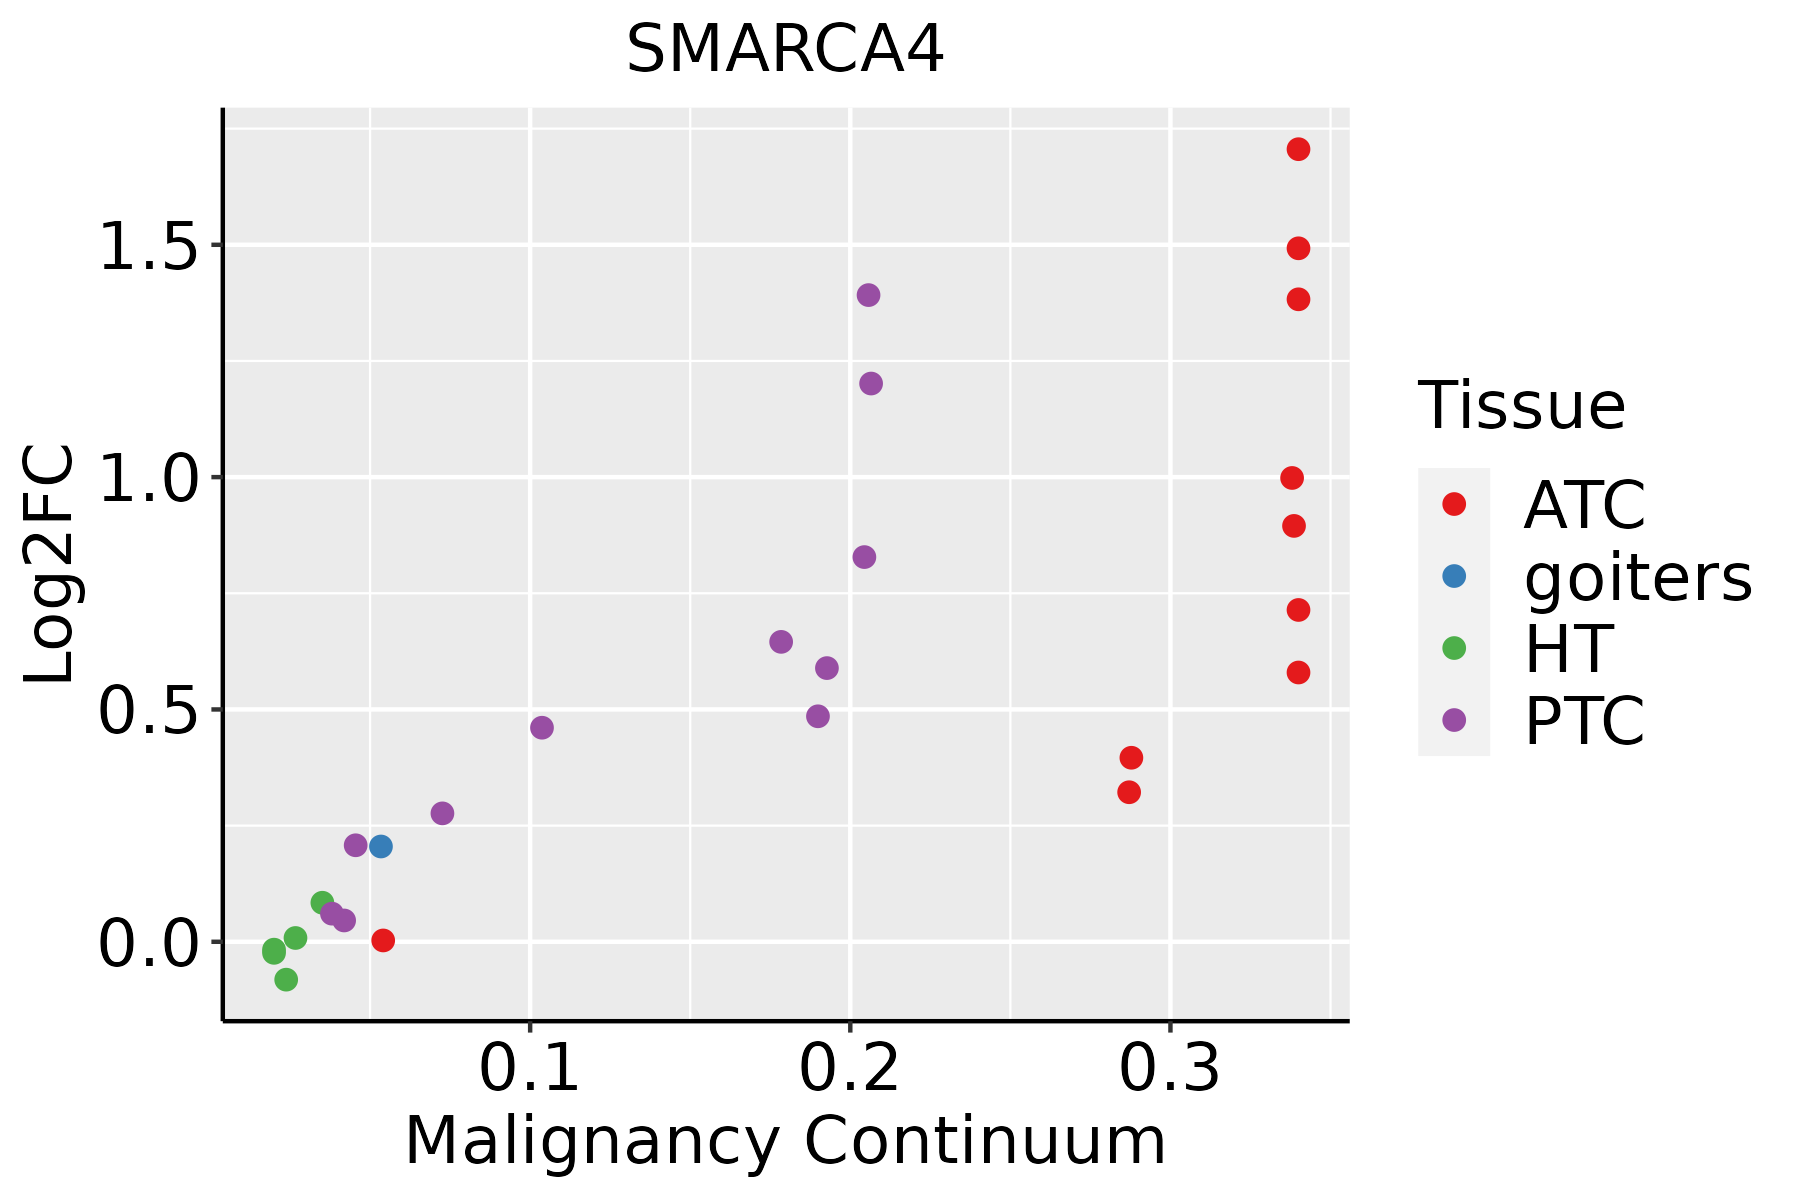 | ATC: Anaplastic thyroid cancer |
| HT: Hashimoto's thyroiditis | ||
| PTC: Papillary thyroid cancer |
| ∗log2FC in expression of this searched gene in stem-like cells from each diseased tissue sample relative to stem-like cells in normal samples in each tissue plotted against the malignancy continuum. Samples are colored based on if they are from different disease stage. |
Top |
Malignant transformation related pathway analysis |
| Find out the enriched GO biological processes and KEGG pathways involved in transition from healthy to precancer to cancer |
| Tissue | Disease Stage | Enriched GO biological Processes |
| Colorectum | AD |  |
| Colorectum | SER |  |
| Colorectum | MSS |  |
| Colorectum | MSI-H |  |
| Colorectum | FAP |  |
| ∗Top 15 enriched GO BP terms are showed in the bar plot of each disease state in each tissue. Each row represents a significant GO biological process which is colored according to the -log10(p.adjust). |
| Page: 1 2 3 4 5 6 7 8 9 |
| GO ID | Tissue | Disease Stage | Description | Gene Ratio | Bg Ratio | pvalue | p.adjust | Count |
| GO:00485459 | Breast | Precancer | response to steroid hormone | 53/1080 | 339/18723 | 3.07e-11 | 3.66e-09 | 53 |
| GO:00160329 | Breast | Precancer | viral process | 58/1080 | 415/18723 | 3.42e-10 | 3.16e-08 | 58 |
| GO:00444039 | Breast | Precancer | biological process involved in symbiotic interaction | 42/1080 | 290/18723 | 3.40e-08 | 2.11e-06 | 42 |
| GO:00713838 | Breast | Precancer | cellular response to steroid hormone stimulus | 28/1080 | 204/18723 | 1.78e-05 | 4.26e-04 | 28 |
| GO:00342849 | Breast | Precancer | response to monosaccharide | 29/1080 | 225/18723 | 4.19e-05 | 9.00e-04 | 29 |
| GO:00097439 | Breast | Precancer | response to carbohydrate | 31/1080 | 253/18723 | 6.15e-05 | 1.25e-03 | 31 |
| GO:00425938 | Breast | Precancer | glucose homeostasis | 31/1080 | 258/18723 | 8.89e-05 | 1.69e-03 | 31 |
| GO:00335008 | Breast | Precancer | carbohydrate homeostasis | 31/1080 | 259/18723 | 9.56e-05 | 1.79e-03 | 31 |
| GO:00305217 | Breast | Precancer | androgen receptor signaling pathway | 10/1080 | 44/18723 | 1.61e-04 | 2.69e-03 | 10 |
| GO:00097469 | Breast | Precancer | response to hexose | 27/1080 | 219/18723 | 1.61e-04 | 2.69e-03 | 27 |
| GO:00224119 | Breast | Precancer | cellular component disassembly | 44/1080 | 443/18723 | 3.17e-04 | 4.51e-03 | 44 |
| GO:00097498 | Breast | Precancer | response to glucose | 25/1080 | 212/18723 | 5.46e-04 | 7.00e-03 | 25 |
| GO:00160497 | Breast | Precancer | cell growth | 46/1080 | 482/18723 | 5.63e-04 | 7.16e-03 | 46 |
| GO:00329865 | Breast | Precancer | protein-DNA complex disassembly | 6/1080 | 20/18723 | 6.99e-04 | 8.43e-03 | 6 |
| GO:00016787 | Breast | Precancer | cellular glucose homeostasis | 21/1080 | 172/18723 | 9.38e-04 | 1.06e-02 | 21 |
| GO:00305187 | Breast | Precancer | intracellular steroid hormone receptor signaling pathway | 16/1080 | 116/18723 | 1.01e-03 | 1.13e-02 | 16 |
| GO:00713337 | Breast | Precancer | cellular response to glucose stimulus | 19/1080 | 151/18723 | 1.12e-03 | 1.23e-02 | 19 |
| GO:00713228 | Breast | Precancer | cellular response to carbohydrate stimulus | 20/1080 | 163/18723 | 1.15e-03 | 1.26e-02 | 20 |
| GO:00713317 | Breast | Precancer | cellular response to hexose stimulus | 19/1080 | 153/18723 | 1.31e-03 | 1.39e-02 | 19 |
| GO:00713267 | Breast | Precancer | cellular response to monosaccharide stimulus | 19/1080 | 154/18723 | 1.42e-03 | 1.48e-02 | 19 |
| Page: 1 2 3 4 5 6 7 8 9 10 11 12 13 14 15 16 17 18 19 20 21 22 23 24 25 26 27 28 29 30 31 32 33 34 35 36 37 38 39 40 41 42 43 44 |
| Pathway ID | Tissue | Disease Stage | Description | Gene Ratio | Bg Ratio | pvalue | p.adjust | qvalue | Count |
| hsa0471418 | Breast | Precancer | Thermogenesis | 68/684 | 232/8465 | 4.40e-22 | 1.26e-20 | 9.69e-21 | 68 |
| hsa0471419 | Breast | Precancer | Thermogenesis | 68/684 | 232/8465 | 4.40e-22 | 1.26e-20 | 9.69e-21 | 68 |
| hsa0471424 | Breast | IDC | Thermogenesis | 75/867 | 232/8465 | 8.41e-21 | 3.04e-19 | 2.27e-19 | 75 |
| hsa0471434 | Breast | IDC | Thermogenesis | 75/867 | 232/8465 | 8.41e-21 | 3.04e-19 | 2.27e-19 | 75 |
| hsa0471443 | Breast | DCIS | Thermogenesis | 74/846 | 232/8465 | 8.72e-21 | 3.13e-19 | 2.30e-19 | 74 |
| hsa0471453 | Breast | DCIS | Thermogenesis | 74/846 | 232/8465 | 8.72e-21 | 3.13e-19 | 2.30e-19 | 74 |
| hsa04714 | Colorectum | AD | Thermogenesis | 120/2092 | 232/8465 | 2.76e-19 | 1.16e-17 | 7.37e-18 | 120 |
| hsa05225 | Colorectum | AD | Hepatocellular carcinoma | 59/2092 | 168/8465 | 1.50e-03 | 8.69e-03 | 5.54e-03 | 59 |
| hsa047141 | Colorectum | AD | Thermogenesis | 120/2092 | 232/8465 | 2.76e-19 | 1.16e-17 | 7.37e-18 | 120 |
| hsa052251 | Colorectum | AD | Hepatocellular carcinoma | 59/2092 | 168/8465 | 1.50e-03 | 8.69e-03 | 5.54e-03 | 59 |
| hsa047144 | Colorectum | MSS | Thermogenesis | 113/1875 | 232/8465 | 1.52e-19 | 4.62e-18 | 2.83e-18 | 113 |
| hsa052252 | Colorectum | MSS | Hepatocellular carcinoma | 56/1875 | 168/8465 | 5.04e-04 | 3.45e-03 | 2.11e-03 | 56 |
| hsa047145 | Colorectum | MSS | Thermogenesis | 113/1875 | 232/8465 | 1.52e-19 | 4.62e-18 | 2.83e-18 | 113 |
| hsa052253 | Colorectum | MSS | Hepatocellular carcinoma | 56/1875 | 168/8465 | 5.04e-04 | 3.45e-03 | 2.11e-03 | 56 |
| hsa047148 | Colorectum | FAP | Thermogenesis | 70/1404 | 232/8465 | 1.38e-07 | 3.08e-06 | 1.87e-06 | 70 |
| hsa052254 | Colorectum | FAP | Hepatocellular carcinoma | 43/1404 | 168/8465 | 1.78e-03 | 8.99e-03 | 5.47e-03 | 43 |
| hsa047149 | Colorectum | FAP | Thermogenesis | 70/1404 | 232/8465 | 1.38e-07 | 3.08e-06 | 1.87e-06 | 70 |
| hsa052255 | Colorectum | FAP | Hepatocellular carcinoma | 43/1404 | 168/8465 | 1.78e-03 | 8.99e-03 | 5.47e-03 | 43 |
| hsa052256 | Colorectum | CRC | Hepatocellular carcinoma | 37/1091 | 168/8465 | 6.38e-04 | 5.89e-03 | 3.99e-03 | 37 |
| hsa052257 | Colorectum | CRC | Hepatocellular carcinoma | 37/1091 | 168/8465 | 6.38e-04 | 5.89e-03 | 3.99e-03 | 37 |
| Page: 1 2 3 |
Top |
Cell-cell communication analysis |
| Identification of potential cell-cell interactions between two cell types and their ligand-receptor pairs for different disease states |
| Ligand | Receptor | LRpair | Pathway | Tissue | Disease Stage |
| Page: 1 |
Top |
Single-cell gene regulatory network inference analysis |
| Find out the significant the regulons (TFs) and the target genes of each regulon across cell types for different disease states |
| TF | Cell Type | Tissue | Disease Stage | Target Gene | RSS | Regulon Activity |
| ∗The dot plots of a searched regulon are shown for all cell subpopulations in each disease state of each tissue based on the regulon specific score inferred using pySCENIC and by calculating the average expression. |
| Page: 1 |
Top |
Somatic mutation of malignant transformation related genes |
| Annotation of somatic variants for genes involved in malignant transformation |
| Hugo Symbol | Variant Class | Variant Classification | dbSNP RS | HGVSc | HGVSp | HGVSp Short | SWISSPROT | BIOTYPE | SIFT | PolyPhen | Tumor Sample Barcode | Tissue | Histology | Sex | Age | Stage | Therapy Types | Drugs | Outcome |
| SMARCA4 | SNV | Missense_Mutation | c.538N>T | p.Leu180Phe | p.L180F | P51532 | protein_coding | deleterious(0.02) | probably_damaging(0.992) | TCGA-A2-A0EQ-01 | Breast | breast invasive carcinoma | Female | <65 | I/II | Chemotherapy | adriamycin | SD | |
| SMARCA4 | SNV | Missense_Mutation | c.2402N>T | p.Arg801Leu | p.R801L | P51532 | protein_coding | deleterious(0.03) | possibly_damaging(0.9) | TCGA-A7-A26I-01 | Breast | breast invasive carcinoma | Female | >=65 | I/II | Chemotherapy | cytoxan | SD | |
| SMARCA4 | SNV | Missense_Mutation | c.4838G>A | p.Arg1613Gln | p.R1613Q | P51532 | protein_coding | tolerated_low_confidence(0.13) | benign(0.056) | TCGA-A8-A06Q-01 | Breast | breast invasive carcinoma | Female | <65 | III/IV | Unknown | Unknown | SD | |
| SMARCA4 | SNV | Missense_Mutation | c.2900G>A | p.Arg967His | p.R967H | P51532 | protein_coding | deleterious(0) | probably_damaging(1) | TCGA-AO-A128-01 | Breast | breast invasive carcinoma | Female | <65 | I/II | Chemotherapy | doxorubicin | SD | |
| SMARCA4 | SNV | Missense_Mutation | rs751542188 | c.254N>T | p.Ser85Leu | p.S85L | P51532 | protein_coding | tolerated_low_confidence(0.3) | benign(0.001) | TCGA-B6-A0X5-01 | Breast | breast invasive carcinoma | Female | <65 | I/II | Unknown | Unknown | PD |
| SMARCA4 | SNV | Missense_Mutation | c.2644N>A | p.Glu882Lys | p.E882K | P51532 | protein_coding | deleterious(0.02) | possibly_damaging(0.881) | TCGA-C8-A12O-01 | Breast | breast invasive carcinoma | Female | <65 | I/II | Unknown | Unknown | SD | |
| SMARCA4 | SNV | Missense_Mutation | c.3426N>A | p.Phe1142Leu | p.F1142L | P51532 | protein_coding | deleterious(0) | probably_damaging(0.983) | TCGA-D8-A1JA-01 | Breast | breast invasive carcinoma | Female | <65 | III/IV | Chemotherapy | adriamycin | PD | |
| SMARCA4 | SNV | Missense_Mutation | c.4702G>A | p.Asp1568Asn | p.D1568N | P51532 | protein_coding | tolerated(0.3) | benign(0) | TCGA-E2-A10C-01 | Breast | breast invasive carcinoma | Female | <65 | I/II | Chemotherapy | cytoxan | SD | |
| SMARCA4 | SNV | Missense_Mutation | c.3575G>A | p.Arg1192His | p.R1192H | P51532 | protein_coding | deleterious(0) | probably_damaging(1) | TCGA-E9-A228-01 | Breast | breast invasive carcinoma | Female | <65 | I/II | Chemotherapy | doxorubicin | SD | |
| SMARCA4 | insertion | Nonsense_Mutation | novel | c.3261_3262insTTGTATTTTTAGTAGAG | p.Ile1088LeufsTer4 | p.I1088Lfs*4 | P51532 | protein_coding | TCGA-A8-A095-01 | Breast | breast invasive carcinoma | Female | <65 | I/II | Chemotherapy | 5-fluorouracil | CR |
| Page: 1 2 3 4 5 6 7 8 9 10 11 12 13 14 15 16 17 18 19 20 21 22 23 24 25 26 |
Top |
Related drugs of malignant transformation related genes |
| Identification of chemicals and drugs interact with genes involved in malignant transfromation |
| (DGIdb 4.0) |
| Entrez ID | Symbol | Category | Interaction Types | Drug Claim Name | Drug Name | PMIDs |
| 6597 | SMARCA4 | CLINICALLY ACTIONABLE, TRANSCRIPTION FACTOR BINDING | inhibitor | 249565598 | ||
| 6597 | SMARCA4 | CLINICALLY ACTIONABLE, TRANSCRIPTION FACTOR BINDING | PALBOCICLIB | PALBOCICLIB | 30718512,30718506 | |
| 6597 | SMARCA4 | CLINICALLY ACTIONABLE, TRANSCRIPTION FACTOR BINDING | TOZASERTIB | TOZASERTIB | 28102363 | |
| 6597 | SMARCA4 | CLINICALLY ACTIONABLE, TRANSCRIPTION FACTOR BINDING | ABEMACICLIB | ABEMACICLIB | 30718512,30718506 | |
| 6597 | SMARCA4 | CLINICALLY ACTIONABLE, TRANSCRIPTION FACTOR BINDING | TAZEMETOSTAT | TAZEMETOSTAT | 29650362 | |
| 6597 | SMARCA4 | CLINICALLY ACTIONABLE, TRANSCRIPTION FACTOR BINDING | VINORELBINE | VINORELBINE | 26671993 | |
| 6597 | SMARCA4 | CLINICALLY ACTIONABLE, TRANSCRIPTION FACTOR BINDING | RETINOIC ACID | 9315656 | ||
| 6597 | SMARCA4 | CLINICALLY ACTIONABLE, TRANSCRIPTION FACTOR BINDING | RIBOCICLIB | RIBOCICLIB | 30718512 | |
| 6597 | SMARCA4 | CLINICALLY ACTIONABLE, TRANSCRIPTION FACTOR BINDING | CISPLATIN | CISPLATIN | 26671993 |
| Page: 1 |

Copyright 2023-Present -The University of Texas Health Science Center at Houston |