
|
|||||
|
 | |
| |
| |
| |
| |
| |
|
Gene: SMARCA2 |
Gene summary for SMARCA2 |
| Gene information | Species | Human | Gene symbol | SMARCA2 | Gene ID | 6595 |
| Gene name | SWI/SNF related, matrix associated, actin dependent regulator of chromatin, subfamily a, member 2 | |
| Gene Alias | BAF190 | |
| Cytomap | 9p24.3 | |
| Gene Type | protein-coding | GO ID | GO:0000003 | UniProtAcc | B4DSC8 |
Top |
Malignant transformation analysis |
| Identification of the aberrant gene expression in precancerous and cancerous lesions by comparing the gene expression of stem-like cells in diseased tissues with normal stem cells |
| Entrez ID | Symbol | Replicates | Species | Organ | Tissue | Adj P-value | Log2FC | Malignancy |
| 6595 | SMARCA2 | LZE2T | Human | Esophagus | ESCC | 1.27e-02 | 1.10e-01 | 0.082 |
| 6595 | SMARCA2 | LZE4T | Human | Esophagus | ESCC | 4.48e-05 | 3.78e-01 | 0.0811 |
| 6595 | SMARCA2 | LZE20T | Human | Esophagus | ESCC | 3.79e-05 | -1.33e-01 | 0.0662 |
| 6595 | SMARCA2 | LZE22T | Human | Esophagus | ESCC | 1.15e-03 | -8.42e-04 | 0.068 |
| 6595 | SMARCA2 | LZE24T | Human | Esophagus | ESCC | 1.04e-16 | 1.74e-01 | 0.0596 |
| 6595 | SMARCA2 | LZE21T | Human | Esophagus | ESCC | 7.65e-04 | 3.69e-01 | 0.0655 |
| 6595 | SMARCA2 | P1T-E | Human | Esophagus | ESCC | 1.86e-04 | 1.46e-01 | 0.0875 |
| 6595 | SMARCA2 | P2T-E | Human | Esophagus | ESCC | 2.76e-25 | 5.64e-01 | 0.1177 |
| 6595 | SMARCA2 | P4T-E | Human | Esophagus | ESCC | 2.05e-06 | 5.75e-02 | 0.1323 |
| 6595 | SMARCA2 | P5T-E | Human | Esophagus | ESCC | 4.81e-15 | -8.68e-02 | 0.1327 |
| 6595 | SMARCA2 | P8T-E | Human | Esophagus | ESCC | 2.27e-12 | 2.98e-01 | 0.0889 |
| 6595 | SMARCA2 | P9T-E | Human | Esophagus | ESCC | 1.77e-14 | 5.60e-01 | 0.1131 |
| 6595 | SMARCA2 | P10T-E | Human | Esophagus | ESCC | 1.36e-37 | 8.91e-01 | 0.116 |
| 6595 | SMARCA2 | P12T-E | Human | Esophagus | ESCC | 2.81e-16 | 2.08e-01 | 0.1122 |
| 6595 | SMARCA2 | P15T-E | Human | Esophagus | ESCC | 3.23e-13 | 4.46e-01 | 0.1149 |
| 6595 | SMARCA2 | P16T-E | Human | Esophagus | ESCC | 6.26e-20 | 3.79e-01 | 0.1153 |
| 6595 | SMARCA2 | P17T-E | Human | Esophagus | ESCC | 1.54e-04 | 1.38e-03 | 0.1278 |
| 6595 | SMARCA2 | P19T-E | Human | Esophagus | ESCC | 1.25e-06 | 1.82e-01 | 0.1662 |
| 6595 | SMARCA2 | P20T-E | Human | Esophagus | ESCC | 2.38e-07 | -2.24e-03 | 0.1124 |
| 6595 | SMARCA2 | P21T-E | Human | Esophagus | ESCC | 2.72e-16 | 1.61e-01 | 0.1617 |
| Page: 1 2 3 4 5 6 7 |
| Tissue | Expression Dynamics | Abbreviation |
| Esophagus | 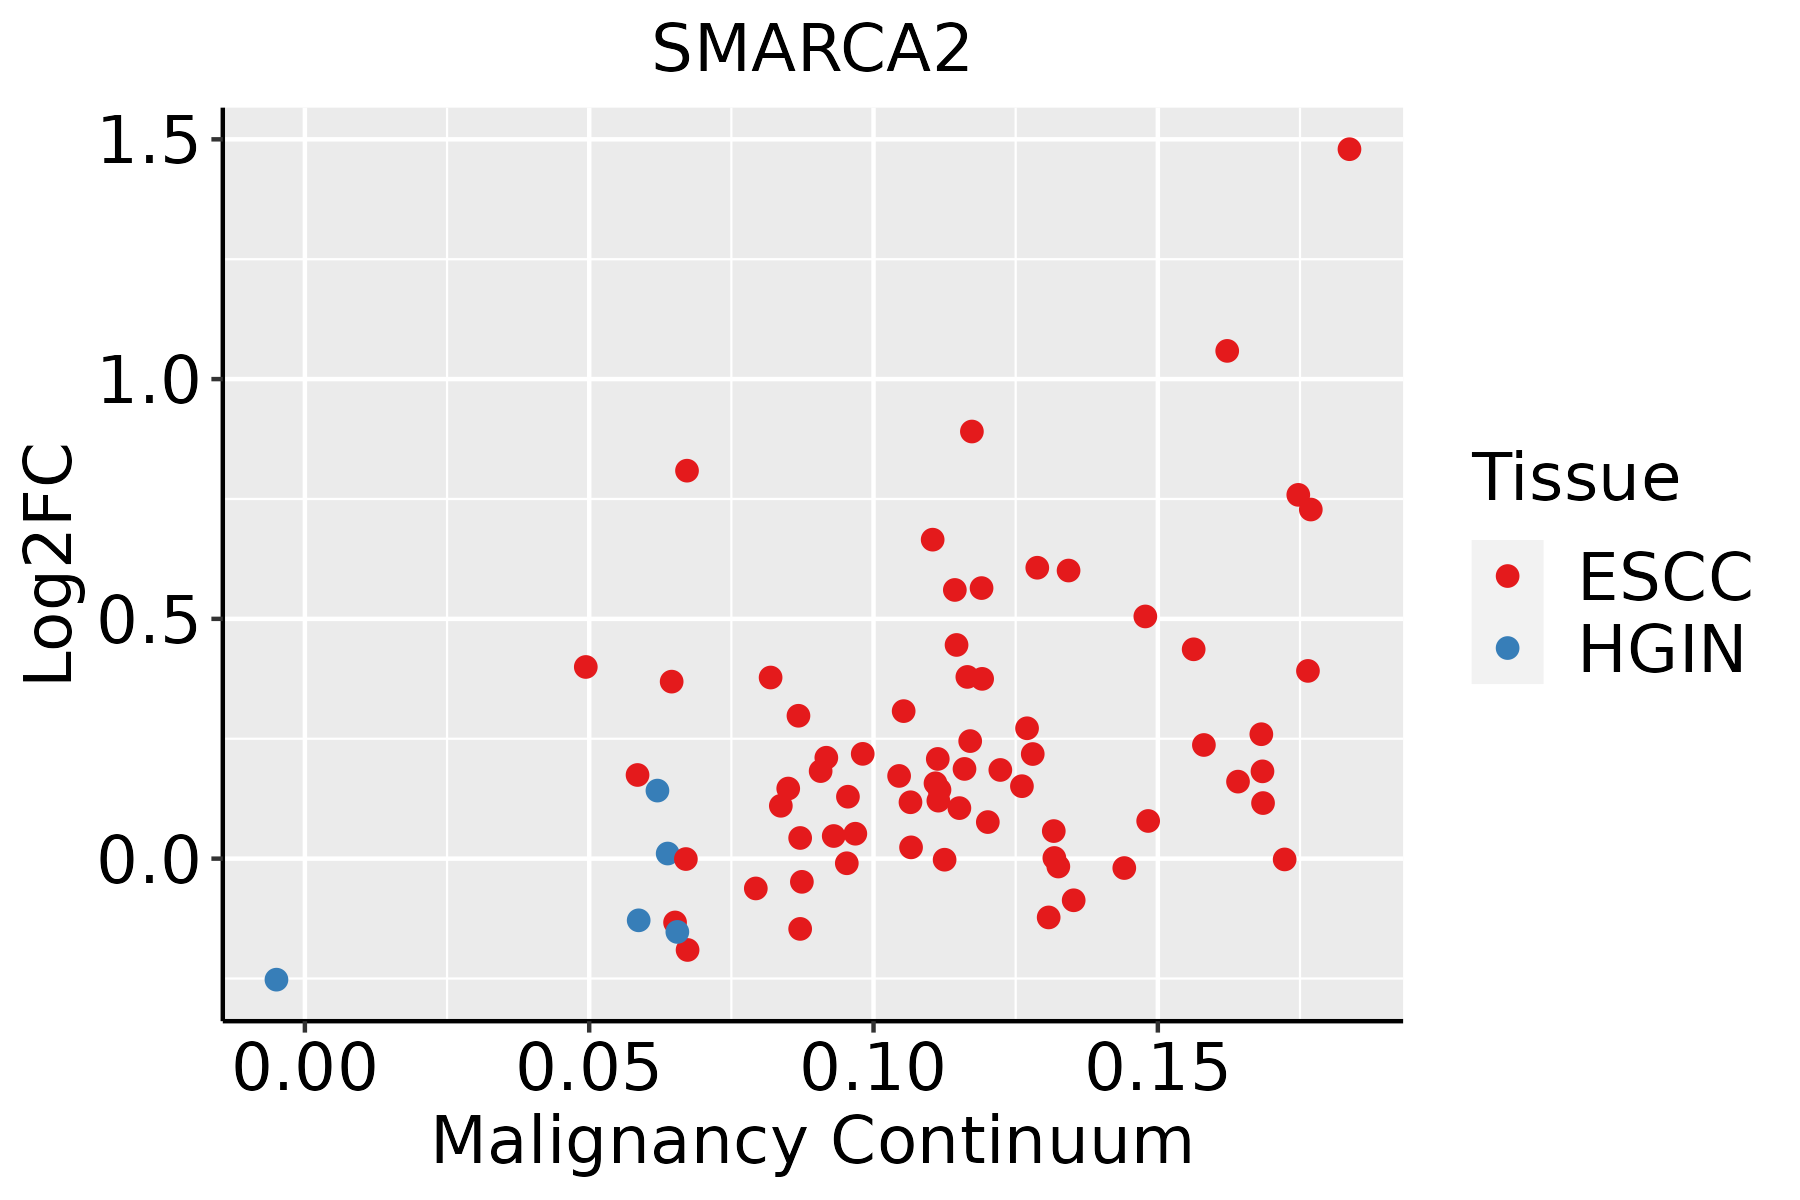 | ESCC: Esophageal squamous cell carcinoma |
| HGIN: High-grade intraepithelial neoplasias | ||
| LGIN: Low-grade intraepithelial neoplasias | ||
| Oral Cavity |  | EOLP: Erosive Oral lichen planus |
| LP: leukoplakia | ||
| NEOLP: Non-erosive oral lichen planus | ||
| OSCC: Oral squamous cell carcinoma | ||
| Prostate |  | BPH: Benign Prostatic Hyperplasia |
| Skin |  | AK: Actinic keratosis |
| cSCC: Cutaneous squamous cell carcinoma | ||
| SCCIS:squamous cell carcinoma in situ | ||
| Thyroid |  | ATC: Anaplastic thyroid cancer |
| HT: Hashimoto's thyroiditis | ||
| PTC: Papillary thyroid cancer |
| ∗log2FC in expression of this searched gene in stem-like cells from each diseased tissue sample relative to stem-like cells in normal samples in each tissue plotted against the malignancy continuum. Samples are colored based on if they are from different disease stage. |
Top |
Malignant transformation related pathway analysis |
| Find out the enriched GO biological processes and KEGG pathways involved in transition from healthy to precancer to cancer |
| Tissue | Disease Stage | Enriched GO biological Processes |
| Colorectum | AD |  |
| Colorectum | SER |  |
| Colorectum | MSS |  |
| Colorectum | MSI-H |  |
| Colorectum | FAP |  |
| ∗Top 15 enriched GO BP terms are showed in the bar plot of each disease state in each tissue. Each row represents a significant GO biological process which is colored according to the -log10(p.adjust). |
| Page: 1 2 3 4 5 6 7 8 9 |
| GO ID | Tissue | Disease Stage | Description | Gene Ratio | Bg Ratio | pvalue | p.adjust | Count |
| GO:0016049110 | Esophagus | ESCC | cell growth | 289/8552 | 482/18723 | 1.29e-10 | 3.77e-09 | 289 |
| GO:000155819 | Esophagus | ESCC | regulation of cell growth | 248/8552 | 414/18723 | 2.97e-09 | 6.45e-08 | 248 |
| GO:000632517 | Esophagus | ESCC | chromatin organization | 240/8552 | 409/18723 | 6.52e-08 | 1.14e-06 | 240 |
| GO:00459267 | Esophagus | ESCC | negative regulation of growth | 148/8552 | 249/18723 | 7.88e-06 | 7.73e-05 | 148 |
| GO:00303085 | Esophagus | ESCC | negative regulation of cell growth | 108/8552 | 188/18723 | 7.46e-04 | 3.87e-03 | 108 |
| GO:001604917 | Oral cavity | OSCC | cell growth | 268/7305 | 482/18723 | 6.55e-14 | 3.51e-12 | 268 |
| GO:000155816 | Oral cavity | OSCC | regulation of cell growth | 228/7305 | 414/18723 | 1.74e-11 | 6.09e-10 | 228 |
| GO:00459266 | Oral cavity | OSCC | negative regulation of growth | 135/7305 | 249/18723 | 7.29e-07 | 1.03e-05 | 135 |
| GO:00303084 | Oral cavity | OSCC | negative regulation of cell growth | 101/7305 | 188/18723 | 2.85e-05 | 2.63e-04 | 101 |
| GO:000632510 | Oral cavity | OSCC | chromatin organization | 190/7305 | 409/18723 | 1.17e-03 | 5.97e-03 | 190 |
| GO:001604924 | Oral cavity | EOLP | cell growth | 97/2218 | 482/18723 | 9.06e-08 | 3.15e-06 | 97 |
| GO:000632515 | Oral cavity | EOLP | chromatin organization | 84/2218 | 409/18723 | 2.68e-07 | 8.16e-06 | 84 |
| GO:000155823 | Oral cavity | EOLP | regulation of cell growth | 78/2218 | 414/18723 | 2.02e-05 | 3.19e-04 | 78 |
| GO:004592613 | Oral cavity | EOLP | negative regulation of growth | 49/2218 | 249/18723 | 2.31e-04 | 2.26e-03 | 49 |
| GO:00063383 | Oral cavity | EOLP | chromatin remodeling | 46/2218 | 255/18723 | 2.34e-03 | 1.44e-02 | 46 |
| GO:003030812 | Oral cavity | EOLP | negative regulation of cell growth | 34/2218 | 188/18723 | 7.73e-03 | 3.69e-02 | 34 |
| GO:001604910 | Prostate | BPH | cell growth | 139/3107 | 482/18723 | 7.53e-12 | 5.90e-10 | 139 |
| GO:000155810 | Prostate | BPH | regulation of cell growth | 116/3107 | 414/18723 | 2.66e-09 | 1.05e-07 | 116 |
| GO:00459265 | Prostate | BPH | negative regulation of growth | 68/3107 | 249/18723 | 1.26e-05 | 1.69e-04 | 68 |
| GO:00063259 | Prostate | BPH | chromatin organization | 101/3107 | 409/18723 | 1.52e-05 | 1.94e-04 | 101 |
| Page: 1 2 3 |
| Pathway ID | Tissue | Disease Stage | Description | Gene Ratio | Bg Ratio | pvalue | p.adjust | qvalue | Count |
| hsa04714211 | Esophagus | ESCC | Thermogenesis | 163/4205 | 232/8465 | 9.22e-11 | 1.14e-09 | 5.86e-10 | 163 |
| hsa0522518 | Esophagus | ESCC | Hepatocellular carcinoma | 109/4205 | 168/8465 | 4.27e-05 | 1.88e-04 | 9.64e-05 | 109 |
| hsa04714310 | Esophagus | ESCC | Thermogenesis | 163/4205 | 232/8465 | 9.22e-11 | 1.14e-09 | 5.86e-10 | 163 |
| hsa0522519 | Esophagus | ESCC | Hepatocellular carcinoma | 109/4205 | 168/8465 | 4.27e-05 | 1.88e-04 | 9.64e-05 | 109 |
| hsa0471430 | Oral cavity | OSCC | Thermogenesis | 138/3704 | 232/8465 | 7.67e-07 | 4.35e-06 | 2.22e-06 | 138 |
| hsa0522516 | Oral cavity | OSCC | Hepatocellular carcinoma | 97/3704 | 168/8465 | 1.63e-04 | 5.52e-04 | 2.81e-04 | 97 |
| hsa04714113 | Oral cavity | OSCC | Thermogenesis | 138/3704 | 232/8465 | 7.67e-07 | 4.35e-06 | 2.22e-06 | 138 |
| hsa0522517 | Oral cavity | OSCC | Hepatocellular carcinoma | 97/3704 | 168/8465 | 1.63e-04 | 5.52e-04 | 2.81e-04 | 97 |
| hsa0471445 | Oral cavity | EOLP | Thermogenesis | 54/1218 | 232/8465 | 1.66e-04 | 7.16e-04 | 4.22e-04 | 54 |
| hsa0522523 | Oral cavity | EOLP | Hepatocellular carcinoma | 39/1218 | 168/8465 | 1.35e-03 | 4.80e-03 | 2.83e-03 | 39 |
| hsa0471455 | Oral cavity | EOLP | Thermogenesis | 54/1218 | 232/8465 | 1.66e-04 | 7.16e-04 | 4.22e-04 | 54 |
| hsa0522533 | Oral cavity | EOLP | Hepatocellular carcinoma | 39/1218 | 168/8465 | 1.35e-03 | 4.80e-03 | 2.83e-03 | 39 |
| hsa0471428 | Prostate | BPH | Thermogenesis | 110/1718 | 232/8465 | 5.16e-21 | 1.42e-19 | 8.78e-20 | 110 |
| hsa0522514 | Prostate | BPH | Hepatocellular carcinoma | 51/1718 | 168/8465 | 1.17e-03 | 5.22e-03 | 3.23e-03 | 51 |
| hsa04714112 | Prostate | BPH | Thermogenesis | 110/1718 | 232/8465 | 5.16e-21 | 1.42e-19 | 8.78e-20 | 110 |
| hsa0522515 | Prostate | BPH | Hepatocellular carcinoma | 51/1718 | 168/8465 | 1.17e-03 | 5.22e-03 | 3.23e-03 | 51 |
| hsa0471429 | Prostate | Tumor | Thermogenesis | 110/1791 | 232/8465 | 1.56e-19 | 3.96e-18 | 2.46e-18 | 110 |
| hsa0522522 | Prostate | Tumor | Hepatocellular carcinoma | 53/1791 | 168/8465 | 9.65e-04 | 4.44e-03 | 2.75e-03 | 53 |
| hsa0471437 | Prostate | Tumor | Thermogenesis | 110/1791 | 232/8465 | 1.56e-19 | 3.96e-18 | 2.46e-18 | 110 |
| hsa0522532 | Prostate | Tumor | Hepatocellular carcinoma | 53/1791 | 168/8465 | 9.65e-04 | 4.44e-03 | 2.75e-03 | 53 |
| Page: 1 |
Top |
Cell-cell communication analysis |
| Identification of potential cell-cell interactions between two cell types and their ligand-receptor pairs for different disease states |
| Ligand | Receptor | LRpair | Pathway | Tissue | Disease Stage |
| Page: 1 |
Top |
Single-cell gene regulatory network inference analysis |
| Find out the significant the regulons (TFs) and the target genes of each regulon across cell types for different disease states |
| TF | Cell Type | Tissue | Disease Stage | Target Gene | RSS | Regulon Activity |
| ∗The dot plots of a searched regulon are shown for all cell subpopulations in each disease state of each tissue based on the regulon specific score inferred using pySCENIC and by calculating the average expression. |
| Page: 1 |
Top |
Somatic mutation of malignant transformation related genes |
| Annotation of somatic variants for genes involved in malignant transformation |
| Hugo Symbol | Variant Class | Variant Classification | dbSNP RS | HGVSc | HGVSp | HGVSp Short | SWISSPROT | BIOTYPE | SIFT | PolyPhen | Tumor Sample Barcode | Tissue | Histology | Sex | Age | Stage | Therapy Types | Drugs | Outcome |
| SMARCA2 | SNV | Missense_Mutation | c.3790N>C | p.Asp1264His | p.D1264H | P51531 | protein_coding | deleterious(0) | possibly_damaging(0.754) | TCGA-AC-A23H-01 | Breast | breast invasive carcinoma | Female | >=65 | I/II | Unknown | Unknown | PD | |
| SMARCA2 | SNV | Missense_Mutation | novel | c.4570N>A | p.Asp1524Asn | p.D1524N | P51531 | protein_coding | tolerated(0.13) | benign(0.015) | TCGA-AC-A23H-01 | Breast | breast invasive carcinoma | Female | >=65 | I/II | Unknown | Unknown | PD |
| SMARCA2 | SNV | Missense_Mutation | novel | c.3382N>A | p.Ala1128Thr | p.A1128T | P51531 | protein_coding | deleterious(0) | probably_damaging(0.996) | TCGA-AN-A046-01 | Breast | breast invasive carcinoma | Female | >=65 | I/II | Unknown | Unknown | SD |
| SMARCA2 | SNV | Missense_Mutation | c.1450N>G | p.His484Asp | p.H484D | P51531 | protein_coding | deleterious(0) | probably_damaging(0.991) | TCGA-AO-A124-01 | Breast | breast invasive carcinoma | Female | <65 | I/II | Chemotherapy | doxorubicin | SD | |
| SMARCA2 | SNV | Missense_Mutation | c.2011N>C | p.Glu671Gln | p.E671Q | P51531 | protein_coding | deleterious(0.01) | benign(0.259) | TCGA-B6-A0I2-01 | Breast | breast invasive carcinoma | Female | <65 | I/II | Unknown | Unknown | SD | |
| SMARCA2 | SNV | Missense_Mutation | c.3680A>G | p.Asn1227Ser | p.N1227S | P51531 | protein_coding | tolerated(0.16) | benign(0.112) | TCGA-B6-A0RH-01 | Breast | breast invasive carcinoma | Female | <65 | I/II | Unknown | Unknown | PD | |
| SMARCA2 | SNV | Missense_Mutation | rs267602196 | c.380N>T | p.Pro127Leu | p.P127L | P51531 | protein_coding | deleterious(0) | probably_damaging(0.966) | TCGA-BH-A0B6-01 | Breast | breast invasive carcinoma | Female | <65 | I/II | Unknown | Unknown | SD |
| SMARCA2 | SNV | Missense_Mutation | c.2853G>C | p.Lys951Asn | p.K951N | P51531 | protein_coding | deleterious(0) | probably_damaging(0.997) | TCGA-C8-A26Y-01 | Breast | breast invasive carcinoma | Female | >=65 | I/II | Unknown | Unknown | SD | |
| SMARCA2 | SNV | Missense_Mutation | c.2857N>A | p.Glu953Lys | p.E953K | P51531 | protein_coding | deleterious(0.03) | probably_damaging(0.992) | TCGA-E2-A1B4-01 | Breast | breast invasive carcinoma | Female | >=65 | III/IV | Hormone Therapy | arimidex | SD | |
| SMARCA2 | SNV | Missense_Mutation | c.1167N>T | p.Gln389His | p.Q389H | P51531 | protein_coding | deleterious(0) | benign(0.003) | TCGA-E2-A1L8-01 | Breast | breast invasive carcinoma | Female | <65 | I/II | Chemotherapy | cyclophosphamide | SD |
| Page: 1 2 3 4 5 6 7 8 9 10 11 12 13 14 15 16 17 18 19 20 21 |
Top |
Related drugs of malignant transformation related genes |
| Identification of chemicals and drugs interact with genes involved in malignant transfromation |
| (DGIdb 4.0) |
| Entrez ID | Symbol | Category | Interaction Types | Drug Claim Name | Drug Name | PMIDs |
| 6595 | SMARCA2 | NA | GNF-PF-3736 | CHEMBL583824 | ||
| 6595 | SMARCA2 | NA | NSC-69187 | CHEMBL19954 | ||
| 6595 | SMARCA2 | NA | TCMDC-125813 | CHEMBL580076 | ||
| 6595 | SMARCA2 | NA | AMINACRINE HYDROCHLORIDE | AMINACRINE HYDROCHLORIDE |
| Page: 1 |

Copyright 2023-Present -The University of Texas Health Science Center at Houston |