
|
|||||
|
 | |
| |
| |
| |
| |
| |
|
Gene: SMARCA1 |
Gene summary for SMARCA1 |
| Gene information | Species | Human | Gene symbol | SMARCA1 | Gene ID | 6594 |
| Gene name | SWI/SNF related, matrix associated, actin dependent regulator of chromatin, subfamily a, member 1 | |
| Gene Alias | ISWI | |
| Cytomap | Xq25-q26.1 | |
| Gene Type | protein-coding | GO ID | GO:0006139 | UniProtAcc | B7ZLQ5 |
Top |
Malignant transformation analysis |
| Identification of the aberrant gene expression in precancerous and cancerous lesions by comparing the gene expression of stem-like cells in diseased tissues with normal stem cells |
| Entrez ID | Symbol | Replicates | Species | Organ | Tissue | Adj P-value | Log2FC | Malignancy |
| 6594 | SMARCA1 | LZE4T | Human | Esophagus | ESCC | 6.11e-07 | 1.64e-01 | 0.0811 |
| 6594 | SMARCA1 | LZE7T | Human | Esophagus | ESCC | 1.09e-04 | 5.65e-01 | 0.0667 |
| 6594 | SMARCA1 | LZE24T | Human | Esophagus | ESCC | 6.27e-11 | 3.90e-01 | 0.0596 |
| 6594 | SMARCA1 | P1T-E | Human | Esophagus | ESCC | 1.32e-04 | 2.43e-01 | 0.0875 |
| 6594 | SMARCA1 | P2T-E | Human | Esophagus | ESCC | 6.63e-23 | 4.71e-01 | 0.1177 |
| 6594 | SMARCA1 | P4T-E | Human | Esophagus | ESCC | 3.05e-06 | 1.80e-01 | 0.1323 |
| 6594 | SMARCA1 | P8T-E | Human | Esophagus | ESCC | 2.50e-09 | 1.22e-01 | 0.0889 |
| 6594 | SMARCA1 | P9T-E | Human | Esophagus | ESCC | 6.74e-10 | 7.52e-02 | 0.1131 |
| 6594 | SMARCA1 | P10T-E | Human | Esophagus | ESCC | 2.62e-35 | 6.98e-01 | 0.116 |
| 6594 | SMARCA1 | P11T-E | Human | Esophagus | ESCC | 2.31e-04 | 2.82e-01 | 0.1426 |
| 6594 | SMARCA1 | P12T-E | Human | Esophagus | ESCC | 6.72e-04 | 9.98e-02 | 0.1122 |
| 6594 | SMARCA1 | P15T-E | Human | Esophagus | ESCC | 1.73e-07 | 1.39e-01 | 0.1149 |
| 6594 | SMARCA1 | P16T-E | Human | Esophagus | ESCC | 2.07e-15 | 1.29e-01 | 0.1153 |
| 6594 | SMARCA1 | P17T-E | Human | Esophagus | ESCC | 1.03e-03 | 2.15e-01 | 0.1278 |
| 6594 | SMARCA1 | P21T-E | Human | Esophagus | ESCC | 1.46e-04 | -5.62e-03 | 0.1617 |
| 6594 | SMARCA1 | P22T-E | Human | Esophagus | ESCC | 8.76e-21 | 4.33e-01 | 0.1236 |
| 6594 | SMARCA1 | P23T-E | Human | Esophagus | ESCC | 5.48e-12 | 3.60e-01 | 0.108 |
| 6594 | SMARCA1 | P24T-E | Human | Esophagus | ESCC | 1.28e-03 | 1.70e-02 | 0.1287 |
| 6594 | SMARCA1 | P26T-E | Human | Esophagus | ESCC | 1.03e-16 | 2.78e-01 | 0.1276 |
| 6594 | SMARCA1 | P27T-E | Human | Esophagus | ESCC | 1.46e-10 | 4.16e-02 | 0.1055 |
| Page: 1 2 3 4 5 |
| Tissue | Expression Dynamics | Abbreviation |
| Esophagus |  | ESCC: Esophageal squamous cell carcinoma |
| HGIN: High-grade intraepithelial neoplasias | ||
| LGIN: Low-grade intraepithelial neoplasias | ||
| Liver | 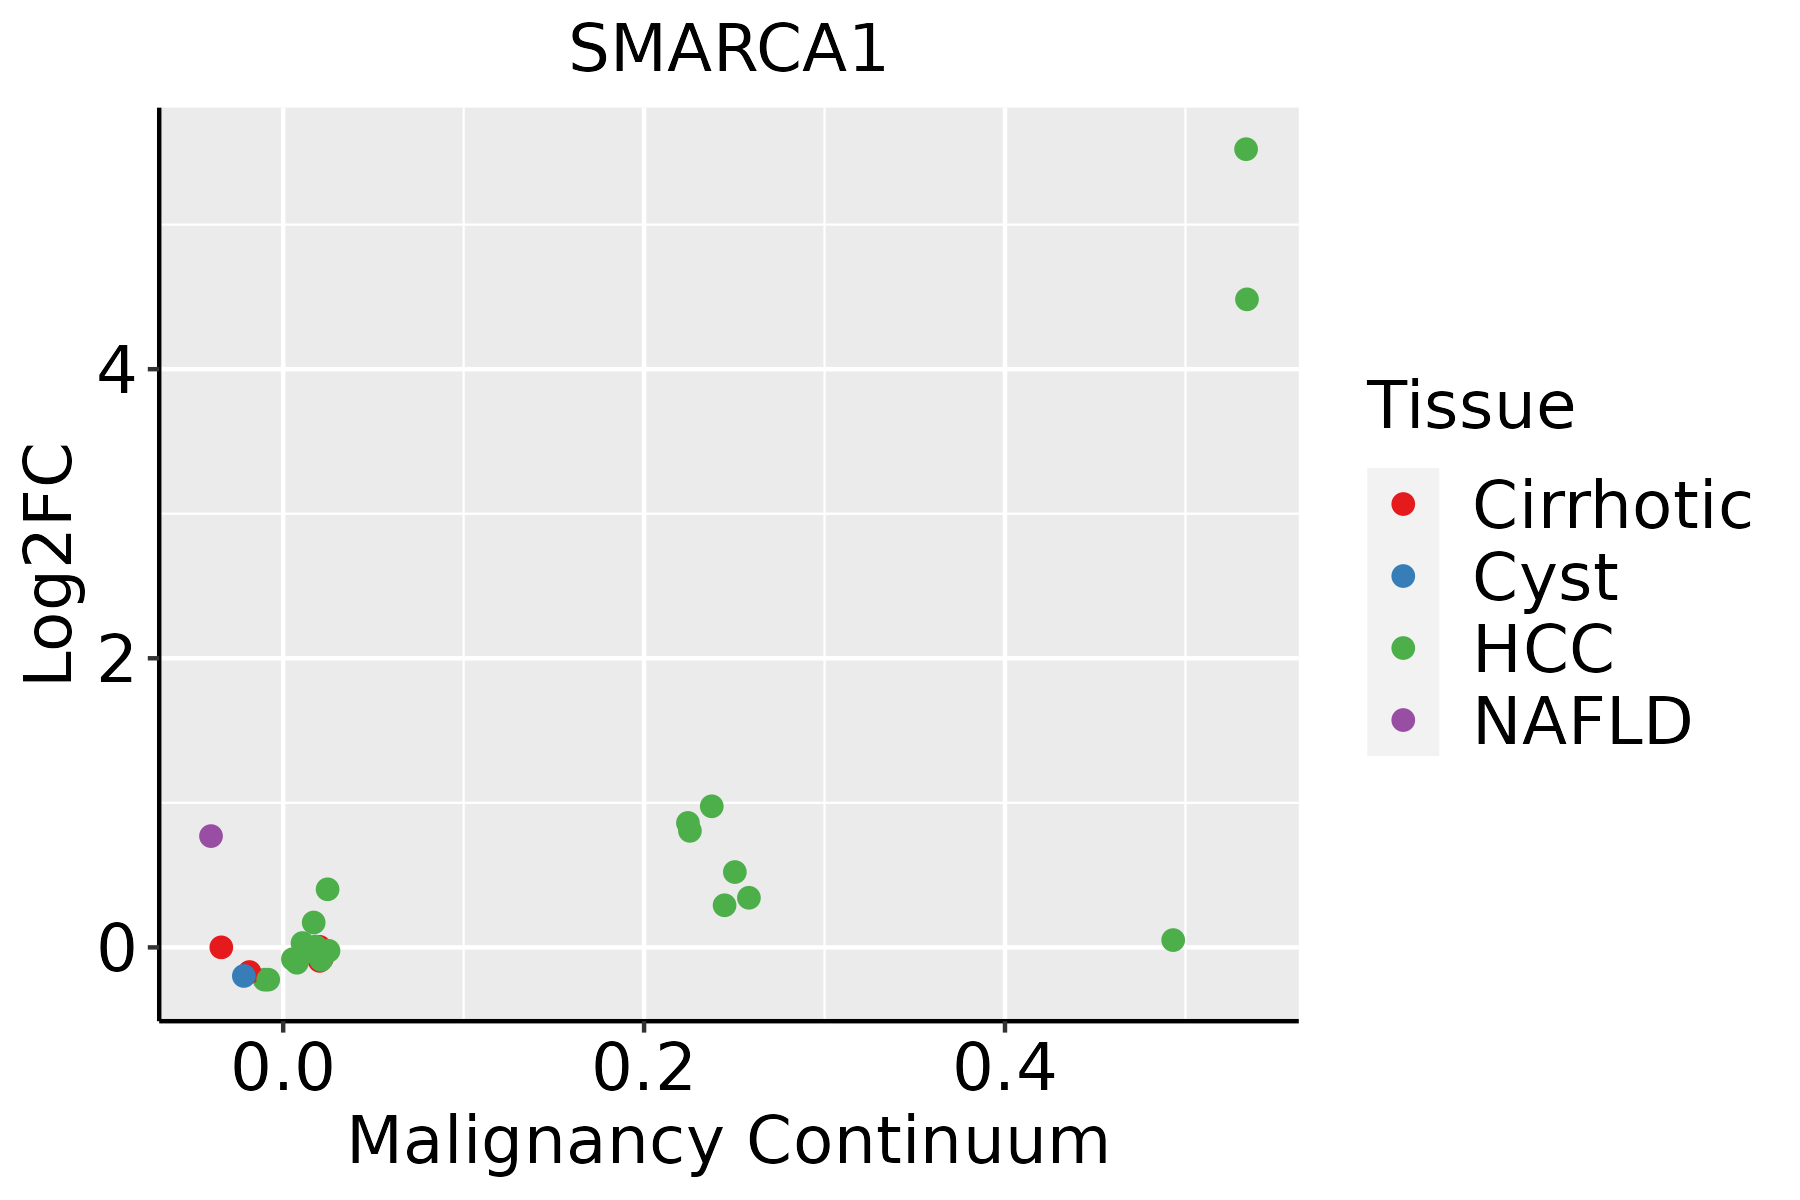 | HCC: Hepatocellular carcinoma |
| NAFLD: Non-alcoholic fatty liver disease | ||
| Oral Cavity | 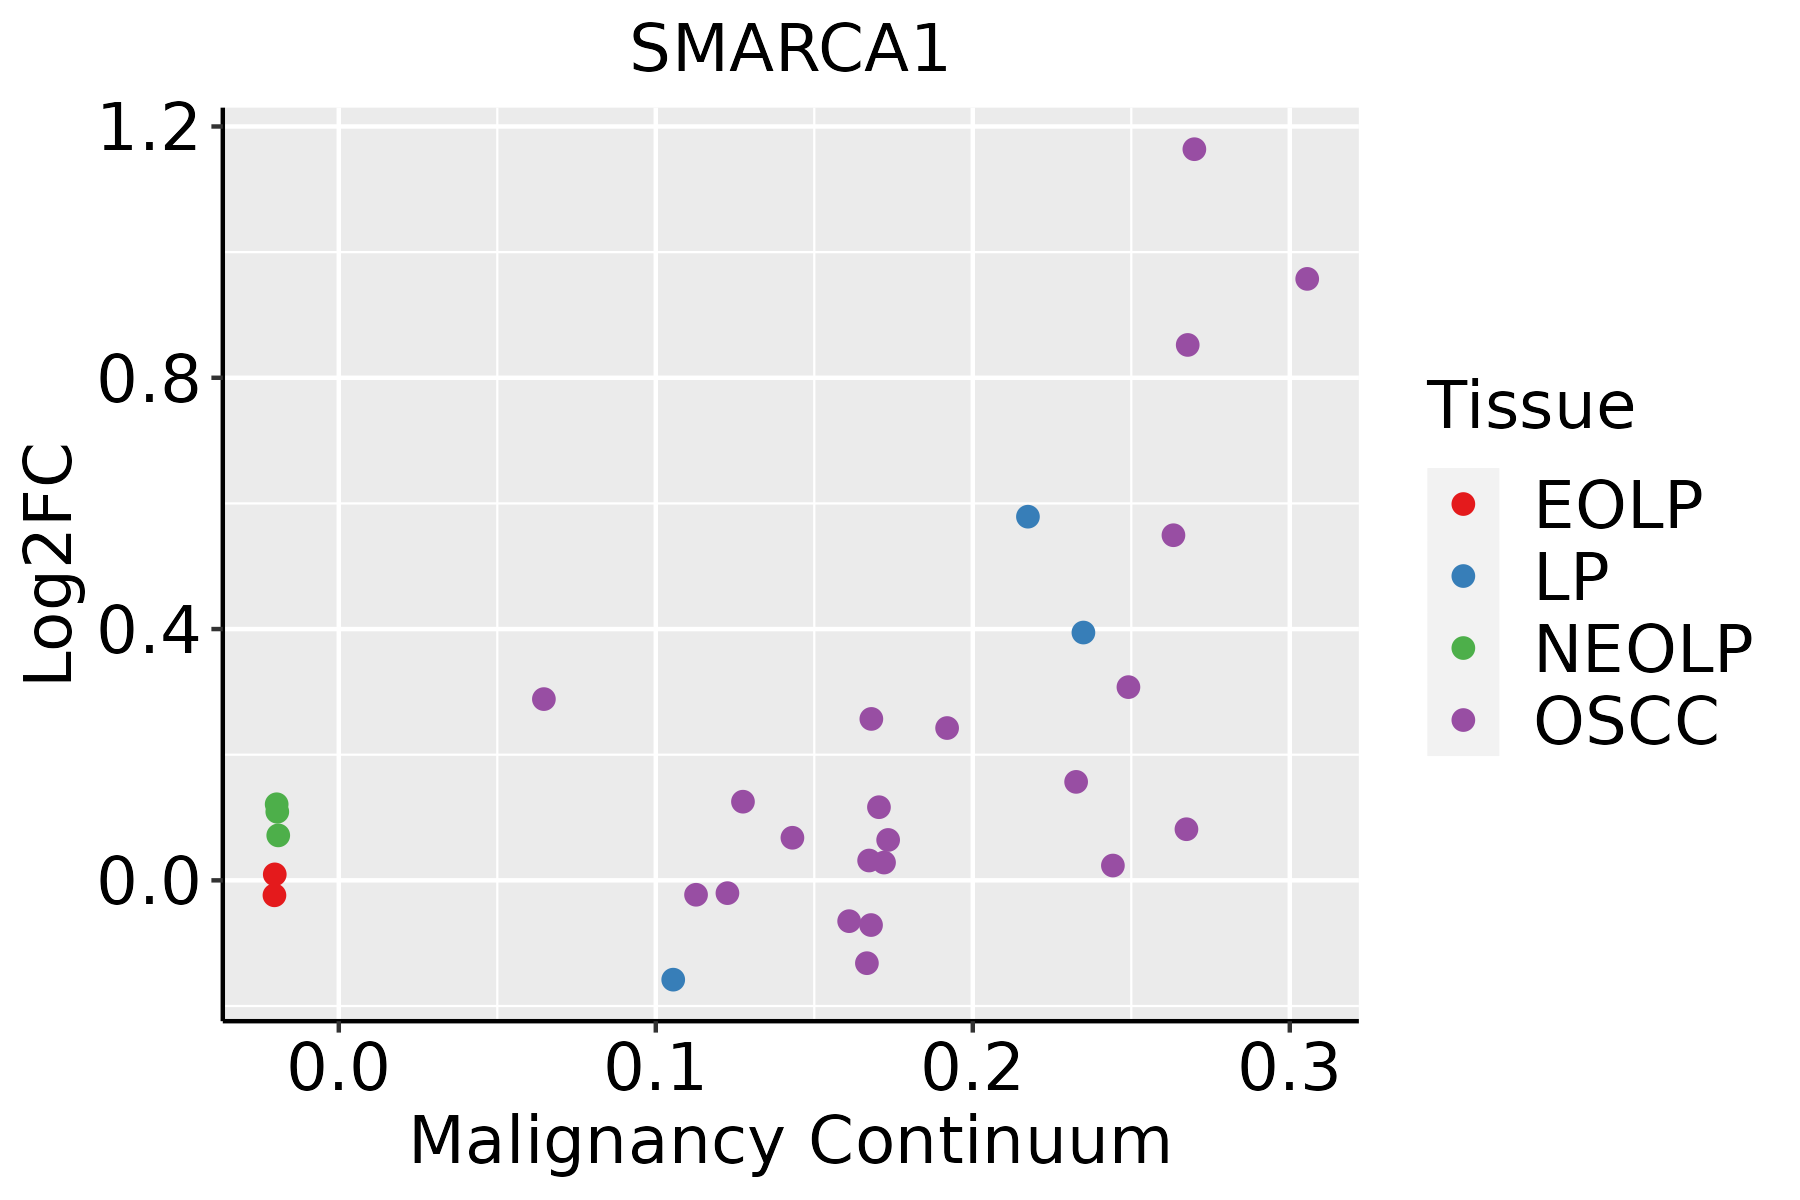 | EOLP: Erosive Oral lichen planus |
| LP: leukoplakia | ||
| NEOLP: Non-erosive oral lichen planus | ||
| OSCC: Oral squamous cell carcinoma | ||
| Prostate | 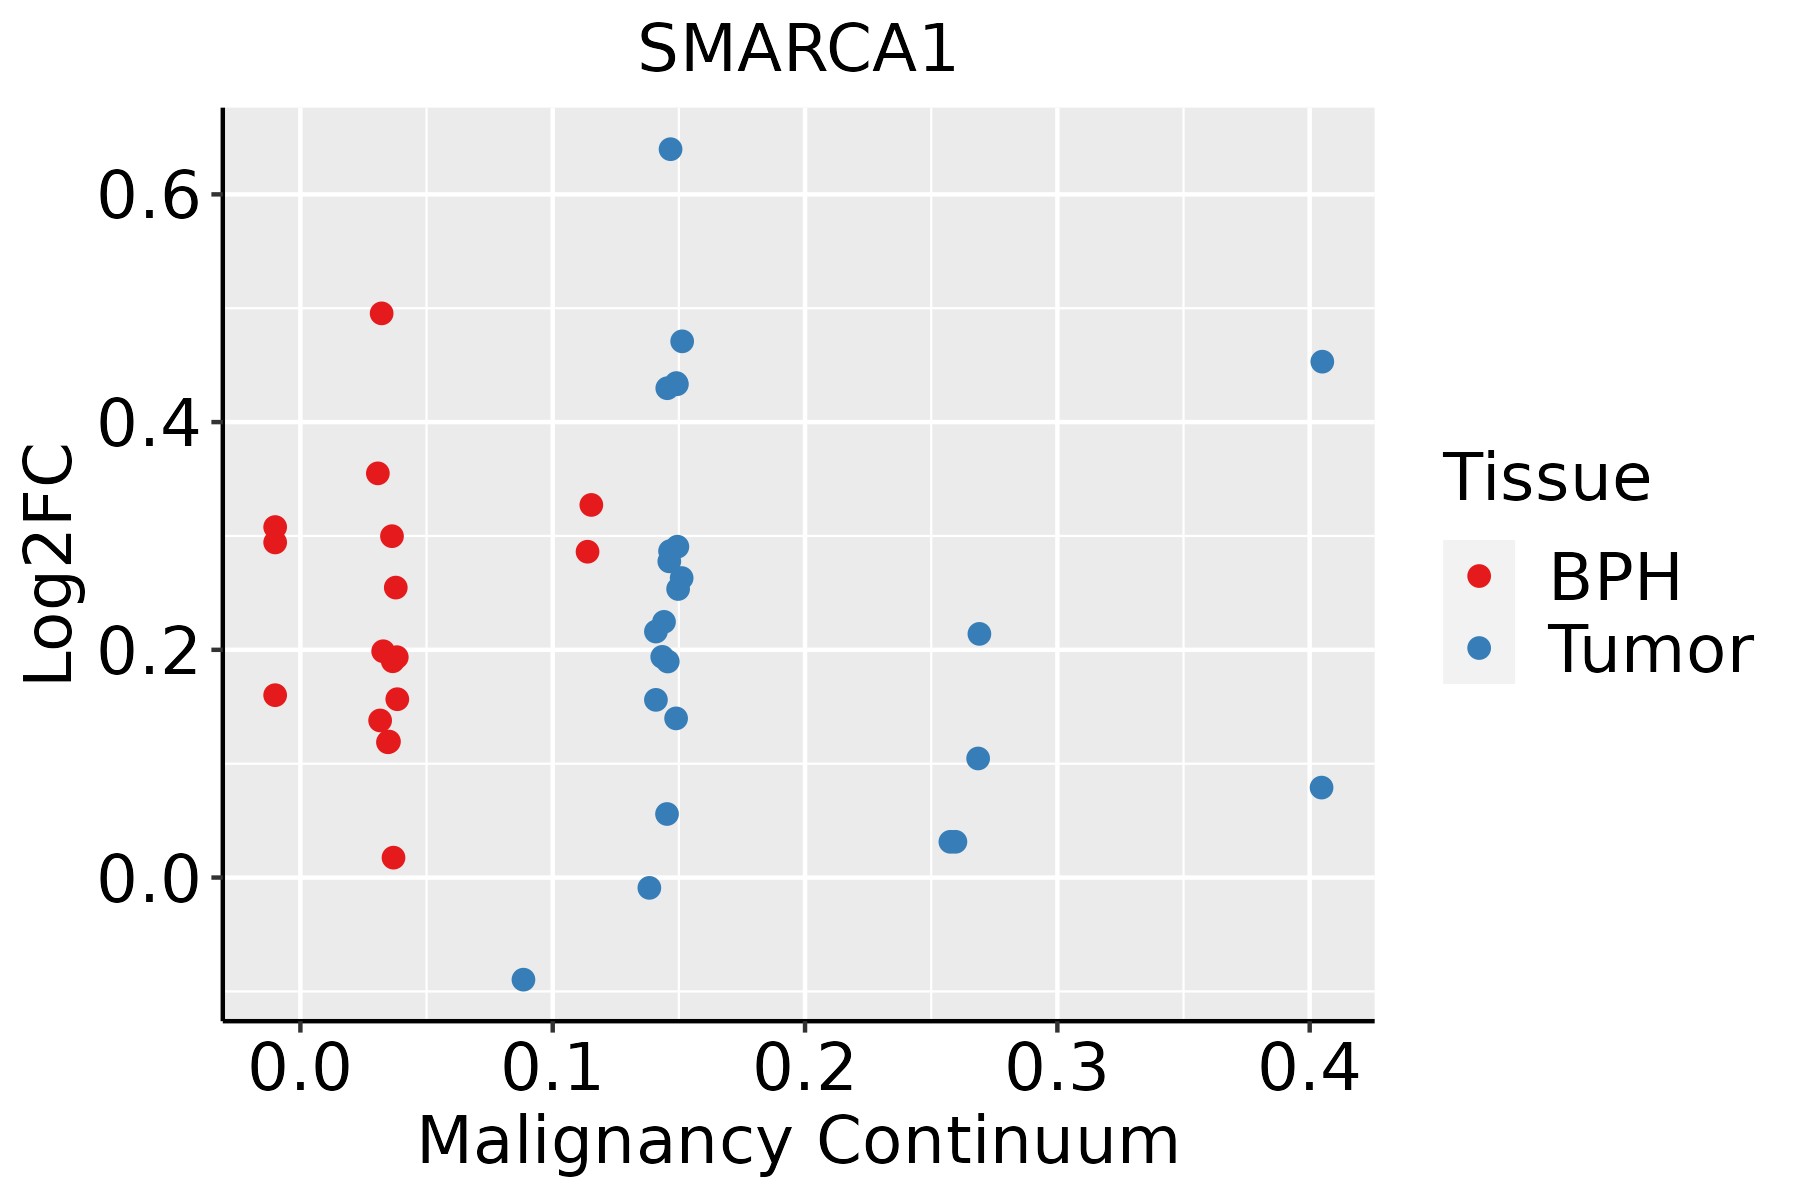 | BPH: Benign Prostatic Hyperplasia |
| Skin | 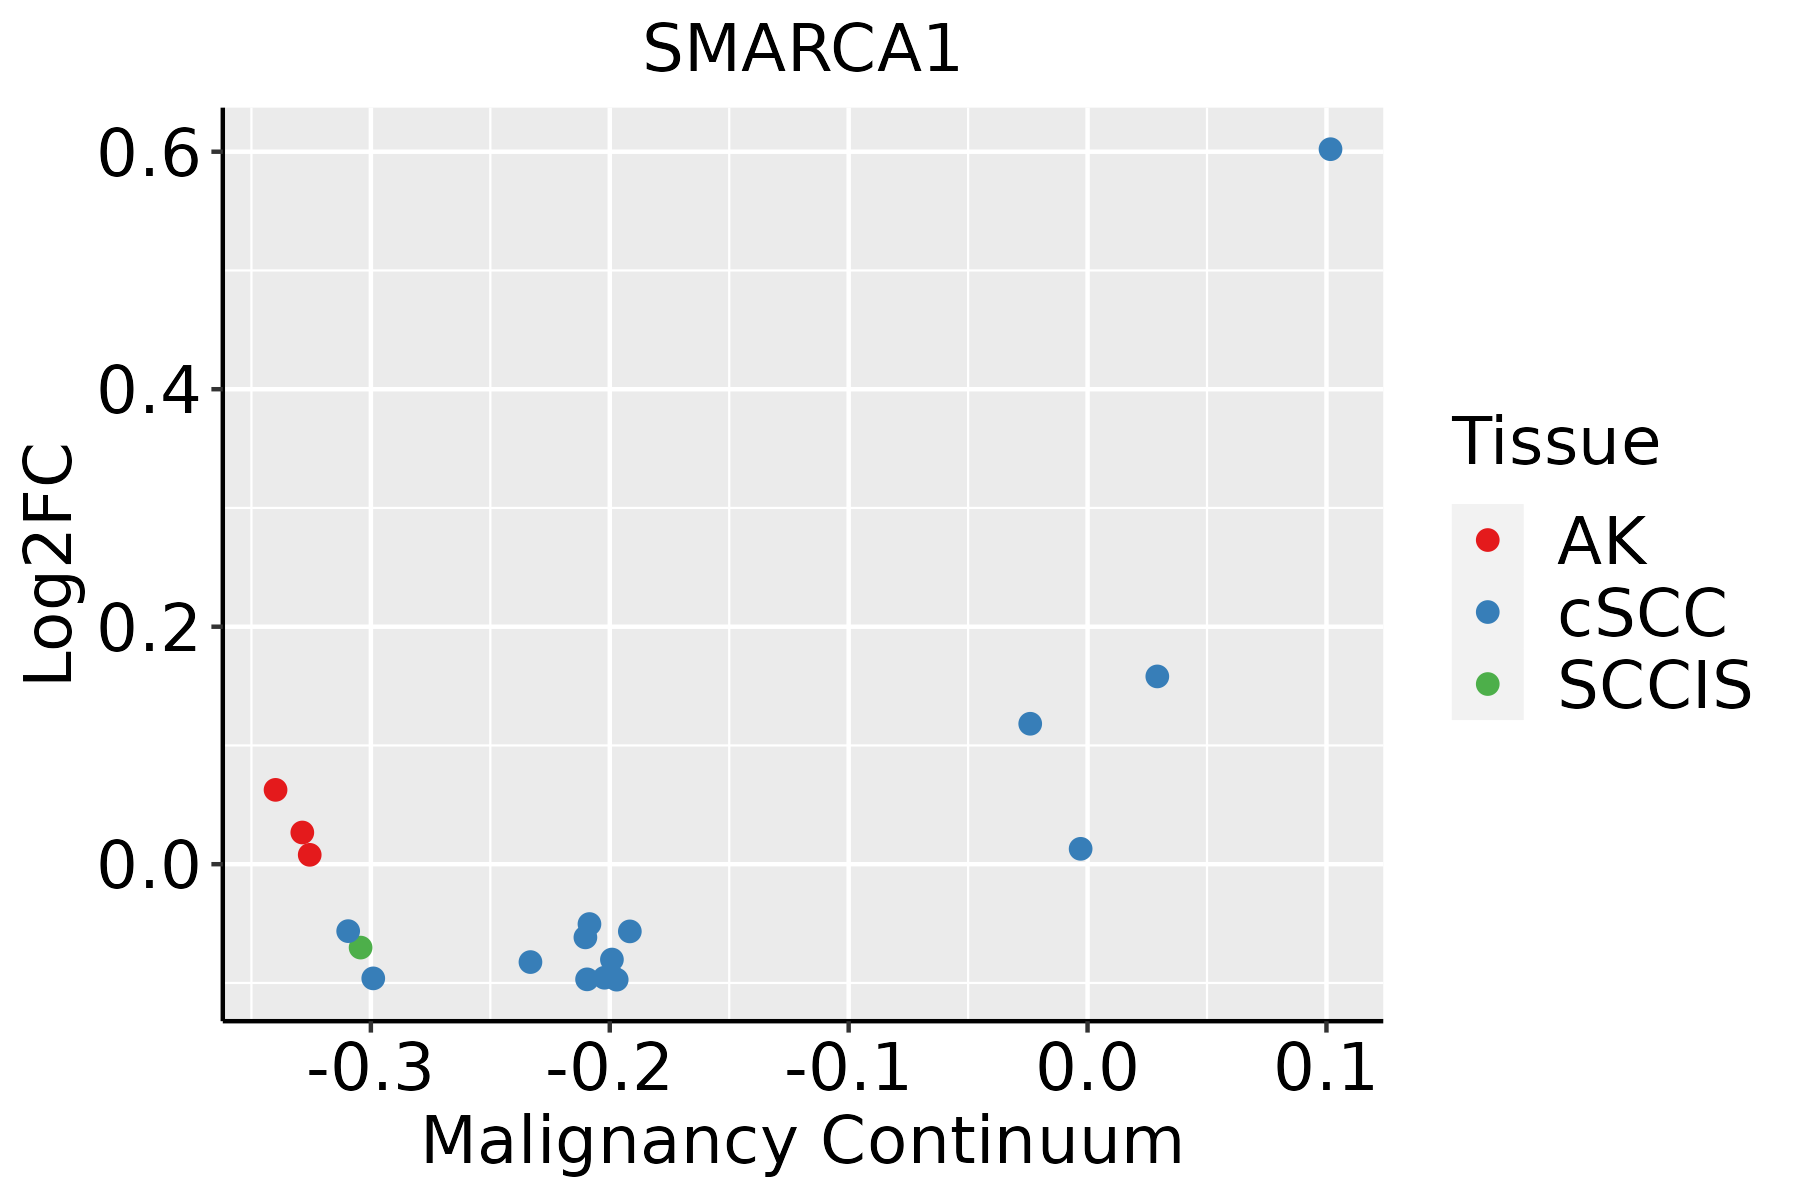 | AK: Actinic keratosis |
| cSCC: Cutaneous squamous cell carcinoma | ||
| SCCIS:squamous cell carcinoma in situ | ||
| Thyroid | 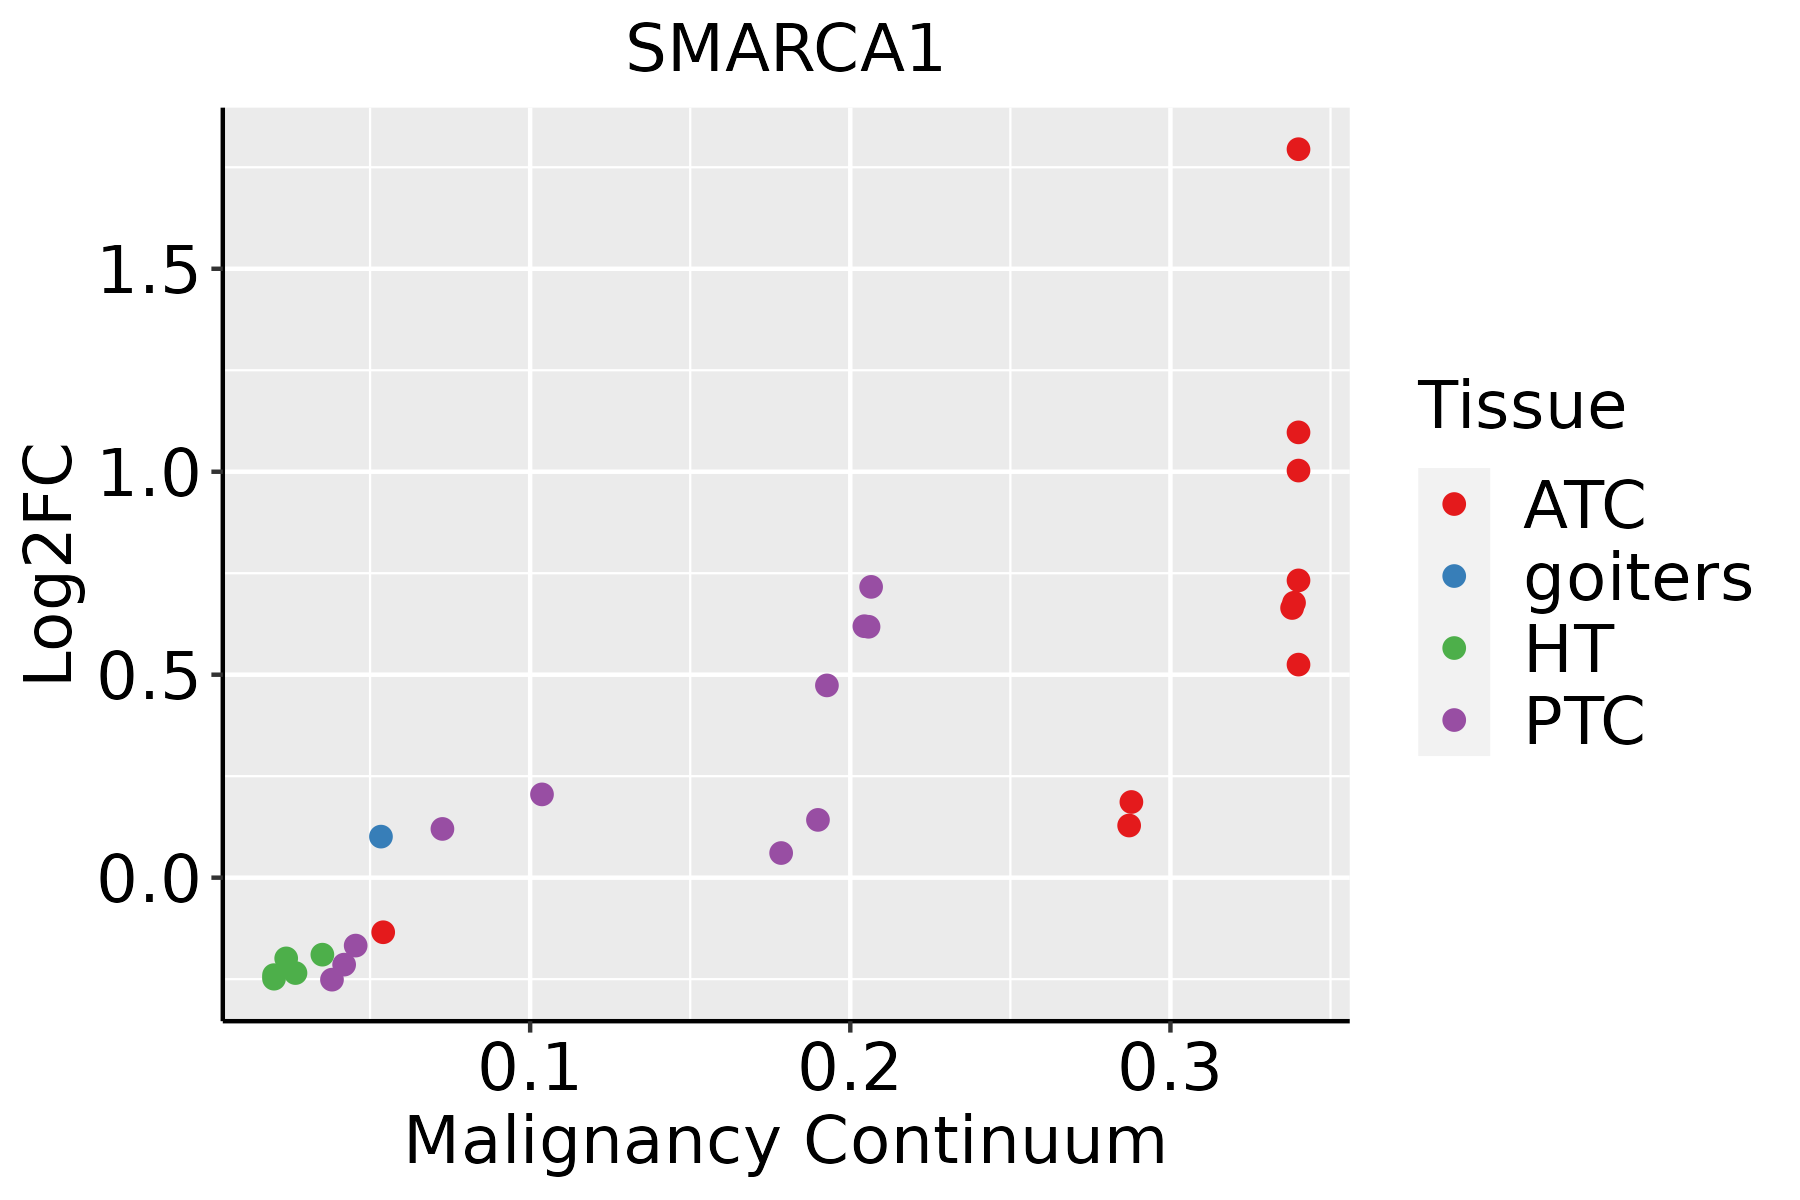 | ATC: Anaplastic thyroid cancer |
| HT: Hashimoto's thyroiditis | ||
| PTC: Papillary thyroid cancer |
| ∗log2FC in expression of this searched gene in stem-like cells from each diseased tissue sample relative to stem-like cells in normal samples in each tissue plotted against the malignancy continuum. Samples are colored based on if they are from different disease stage. |
Top |
Malignant transformation related pathway analysis |
| Find out the enriched GO biological processes and KEGG pathways involved in transition from healthy to precancer to cancer |
| Tissue | Disease Stage | Enriched GO biological Processes |
| Colorectum | AD |  |
| Colorectum | SER |  |
| Colorectum | MSS |  |
| Colorectum | MSI-H |  |
| Colorectum | FAP |  |
| ∗Top 15 enriched GO BP terms are showed in the bar plot of each disease state in each tissue. Each row represents a significant GO biological process which is colored according to the -log10(p.adjust). |
| Page: 1 2 3 4 5 6 7 8 9 |
| GO ID | Tissue | Disease Stage | Description | Gene Ratio | Bg Ratio | pvalue | p.adjust | Count |
| GO:000632517 | Esophagus | ESCC | chromatin organization | 240/8552 | 409/18723 | 6.52e-08 | 1.14e-06 | 240 |
| GO:00063255 | Liver | NAFLD | chromatin organization | 64/1882 | 409/18723 | 2.31e-04 | 3.89e-03 | 64 |
| GO:000632511 | Liver | HCC | chromatin organization | 206/7958 | 409/18723 | 7.23e-04 | 4.41e-03 | 206 |
| GO:000632510 | Oral cavity | OSCC | chromatin organization | 190/7305 | 409/18723 | 1.17e-03 | 5.97e-03 | 190 |
| GO:00063259 | Prostate | BPH | chromatin organization | 101/3107 | 409/18723 | 1.52e-05 | 1.94e-04 | 101 |
| GO:00063382 | Prostate | BPH | chromatin remodeling | 62/3107 | 255/18723 | 9.47e-04 | 5.97e-03 | 62 |
| GO:000632514 | Prostate | Tumor | chromatin organization | 104/3246 | 409/18723 | 2.02e-05 | 2.62e-04 | 104 |
| GO:000633811 | Prostate | Tumor | chromatin remodeling | 63/3246 | 255/18723 | 1.73e-03 | 1.02e-02 | 63 |
| GO:000632519 | Skin | cSCC | chromatin organization | 147/4864 | 409/18723 | 4.41e-06 | 6.52e-05 | 147 |
| GO:000633812 | Skin | cSCC | chromatin remodeling | 94/4864 | 255/18723 | 7.58e-05 | 7.26e-04 | 94 |
| GO:000632520 | Thyroid | PTC | chromatin organization | 183/5968 | 409/18723 | 2.55e-08 | 5.70e-07 | 183 |
| GO:00063385 | Thyroid | PTC | chromatin remodeling | 106/5968 | 255/18723 | 6.56e-04 | 4.13e-03 | 106 |
| GO:0006325110 | Thyroid | ATC | chromatin organization | 189/6293 | 409/18723 | 6.40e-08 | 1.13e-06 | 189 |
| GO:000633813 | Thyroid | ATC | chromatin remodeling | 109/6293 | 255/18723 | 1.38e-03 | 7.15e-03 | 109 |
| Page: 1 |
| Pathway ID | Tissue | Disease Stage | Description | Gene Ratio | Bg Ratio | pvalue | p.adjust | qvalue | Count |
| Page: 1 |
Top |
Cell-cell communication analysis |
| Identification of potential cell-cell interactions between two cell types and their ligand-receptor pairs for different disease states |
| Ligand | Receptor | LRpair | Pathway | Tissue | Disease Stage |
| Page: 1 |
Top |
Single-cell gene regulatory network inference analysis |
| Find out the significant the regulons (TFs) and the target genes of each regulon across cell types for different disease states |
| TF | Cell Type | Tissue | Disease Stage | Target Gene | RSS | Regulon Activity |
| SMARCA1 | ISLET | Pancreas | PDAC | OCRL,SSX2IP,DMD, etc. | 1.24e-01 |  |
| ∗The dot plots of a searched regulon are shown for all cell subpopulations in each disease state of each tissue based on the regulon specific score inferred using pySCENIC and by calculating the average expression. |
| Page: 1 |
Top |
Somatic mutation of malignant transformation related genes |
| Annotation of somatic variants for genes involved in malignant transformation |
| Hugo Symbol | Variant Class | Variant Classification | dbSNP RS | HGVSc | HGVSp | HGVSp Short | SWISSPROT | BIOTYPE | SIFT | PolyPhen | Tumor Sample Barcode | Tissue | Histology | Sex | Age | Stage | Therapy Types | Drugs | Outcome |
| SMARCA1 | SNV | Missense_Mutation | c.1384N>G | p.His462Asp | p.H462D | protein_coding | deleterious(0) | probably_damaging(0.911) | TCGA-A2-A0SY-01 | Breast | breast invasive carcinoma | Female | <65 | III/IV | Hormone Therapy | arimidex | SD | ||
| SMARCA1 | SNV | Missense_Mutation | c.1455N>A | p.Ser485Arg | p.S485R | protein_coding | deleterious(0) | possibly_damaging(0.786) | TCGA-A2-A1FX-01 | Breast | breast invasive carcinoma | Female | <65 | III/IV | Chemotherapy | taxotere | SD | ||
| SMARCA1 | SNV | Missense_Mutation | novel | c.2282N>A | p.Ala761Asp | p.A761D | protein_coding | tolerated(0.55) | possibly_damaging(0.716) | TCGA-A2-A25A-01 | Breast | breast invasive carcinoma | Female | <65 | I/II | Unspecific | Cytoxan | SD | |
| SMARCA1 | SNV | Missense_Mutation | c.962N>A | p.Ser321Tyr | p.S321Y | protein_coding | deleterious(0) | probably_damaging(0.997) | TCGA-A2-A25B-01 | Breast | breast invasive carcinoma | Female | <65 | I/II | Chemotherapy | taxotere | PD | ||
| SMARCA1 | SNV | Missense_Mutation | c.2665G>T | p.Gly889Cys | p.G889C | protein_coding | deleterious(0) | probably_damaging(0.987) | TCGA-A7-A26H-01 | Breast | breast invasive carcinoma | Female | >=65 | I/II | Hormone Therapy | anastrozole | PD | ||
| SMARCA1 | SNV | Missense_Mutation | novel | c.1572N>C | p.Trp524Cys | p.W524C | protein_coding | deleterious(0) | probably_damaging(1) | TCGA-AR-A0U0-01 | Breast | breast invasive carcinoma | Female | >=65 | I/II | Unknown | Unknown | SD | |
| SMARCA1 | SNV | Missense_Mutation | c.213A>T | p.Lys71Asn | p.K71N | protein_coding | tolerated(0.44) | benign(0.187) | TCGA-BH-A0E9-01 | Breast | breast invasive carcinoma | Female | <65 | I/II | Chemotherapy | taxotere | CR | ||
| SMARCA1 | SNV | Missense_Mutation | c.2542N>C | p.Glu848Gln | p.E848Q | protein_coding | tolerated(0.11) | benign(0.301) | TCGA-C8-A26Y-01 | Breast | breast invasive carcinoma | Female | >=65 | I/II | Unknown | Unknown | SD | ||
| SMARCA1 | SNV | Missense_Mutation | c.1319N>T | p.Ser440Phe | p.S440F | protein_coding | deleterious(0) | possibly_damaging(0.811) | TCGA-D8-A1JA-01 | Breast | breast invasive carcinoma | Female | <65 | III/IV | Chemotherapy | adriamycin | PD | ||
| SMARCA1 | SNV | Missense_Mutation | c.433N>T | p.Arg145Cys | p.R145C | protein_coding | deleterious(0) | probably_damaging(1) | TCGA-E9-A1RB-01 | Breast | breast invasive carcinoma | Female | <65 | I/II | Chemotherapy | methotrexate | SD |
| Page: 1 2 3 4 5 6 7 8 9 10 11 12 13 14 15 16 17 |
Top |
Related drugs of malignant transformation related genes |
| Identification of chemicals and drugs interact with genes involved in malignant transfromation |
| (DGIdb 4.0) |
| Entrez ID | Symbol | Category | Interaction Types | Drug Claim Name | Drug Name | PMIDs |
| Page: 1 |

Copyright 2023-Present -The University of Texas Health Science Center at Houston |