
|
|||||
|
 | |
| |
| |
| |
| |
| |
|
Gene: SMAP2 |
Gene summary for SMAP2 |
| Gene information | Species | Human | Gene symbol | SMAP2 | Gene ID | 64744 |
| Gene name | small ArfGAP2 | |
| Gene Alias | SMAP1L | |
| Cytomap | 1p34.2 | |
| Gene Type | protein-coding | GO ID | GO:0008150 | UniProtAcc | Q8WU79 |
Top |
Malignant transformation analysis |
| Identification of the aberrant gene expression in precancerous and cancerous lesions by comparing the gene expression of stem-like cells in diseased tissues with normal stem cells |
| Entrez ID | Symbol | Replicates | Species | Organ | Tissue | Adj P-value | Log2FC | Malignancy |
| 64744 | SMAP2 | NAFLD1 | Human | Liver | NAFLD | 3.95e-04 | 3.51e-01 | -0.04 |
| 64744 | SMAP2 | S43 | Human | Liver | Cirrhotic | 9.06e-05 | 7.59e-02 | -0.0187 |
| 64744 | SMAP2 | HCC1_Meng | Human | Liver | HCC | 1.47e-48 | 7.37e-02 | 0.0246 |
| 64744 | SMAP2 | HCC2_Meng | Human | Liver | HCC | 6.28e-08 | -3.62e-02 | 0.0107 |
| 64744 | SMAP2 | HCC1 | Human | Liver | HCC | 8.51e-03 | 3.63e+00 | 0.5336 |
| 64744 | SMAP2 | HCC2 | Human | Liver | HCC | 3.84e-19 | 3.13e+00 | 0.5341 |
| 64744 | SMAP2 | HCC5 | Human | Liver | HCC | 1.89e-04 | 2.03e+00 | 0.4932 |
| 64744 | SMAP2 | Pt13.b | Human | Liver | HCC | 1.20e-02 | 7.68e-02 | 0.0251 |
| 64744 | SMAP2 | S014 | Human | Liver | HCC | 1.76e-02 | 2.46e-01 | 0.2254 |
| 64744 | SMAP2 | S016 | Human | Liver | HCC | 2.42e-05 | 3.44e-01 | 0.2243 |
| 64744 | SMAP2 | S027 | Human | Liver | HCC | 1.19e-02 | 5.29e-01 | 0.2446 |
| 64744 | SMAP2 | S028 | Human | Liver | HCC | 1.77e-11 | 6.17e-01 | 0.2503 |
| 64744 | SMAP2 | S029 | Human | Liver | HCC | 2.66e-08 | 5.79e-01 | 0.2581 |
| 64744 | SMAP2 | C21 | Human | Oral cavity | OSCC | 1.91e-09 | 4.24e-01 | 0.2678 |
| 64744 | SMAP2 | C30 | Human | Oral cavity | OSCC | 5.07e-09 | 5.21e-01 | 0.3055 |
| 64744 | SMAP2 | C51 | Human | Oral cavity | OSCC | 1.05e-02 | 2.40e-01 | 0.2674 |
| 64744 | SMAP2 | C06 | Human | Oral cavity | OSCC | 1.65e-04 | 6.20e-01 | 0.2699 |
| 64744 | SMAP2 | C08 | Human | Oral cavity | OSCC | 5.77e-03 | 7.68e-02 | 0.1919 |
| 64744 | SMAP2 | LN22 | Human | Oral cavity | OSCC | 3.49e-02 | 7.77e-01 | 0.1733 |
| 64744 | SMAP2 | EOLP-1 | Human | Oral cavity | EOLP | 3.86e-21 | 6.18e-01 | -0.0202 |
| Page: 1 2 |
| Tissue | Expression Dynamics | Abbreviation |
| Liver |  | HCC: Hepatocellular carcinoma |
| NAFLD: Non-alcoholic fatty liver disease | ||
| Oral Cavity | 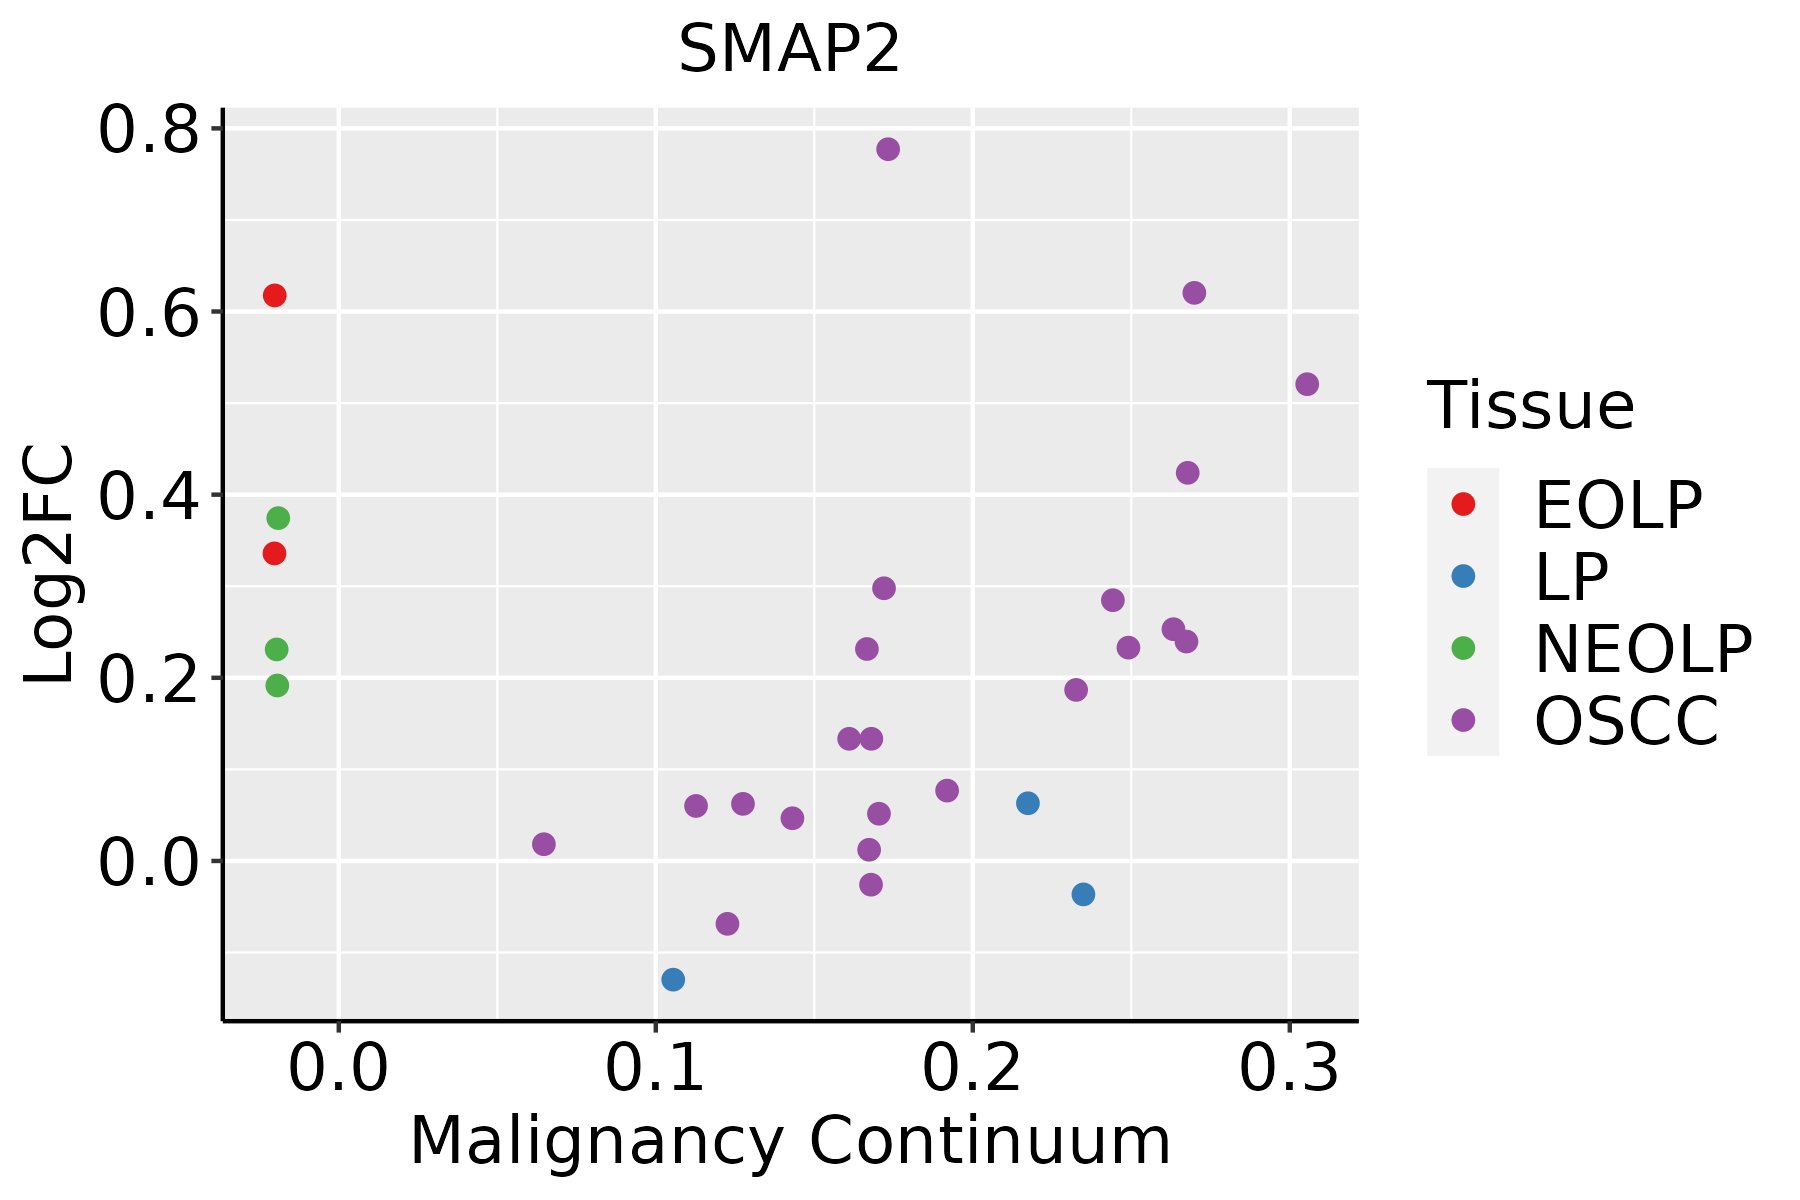 | EOLP: Erosive Oral lichen planus |
| LP: leukoplakia | ||
| NEOLP: Non-erosive oral lichen planus | ||
| OSCC: Oral squamous cell carcinoma | ||
| Prostate | 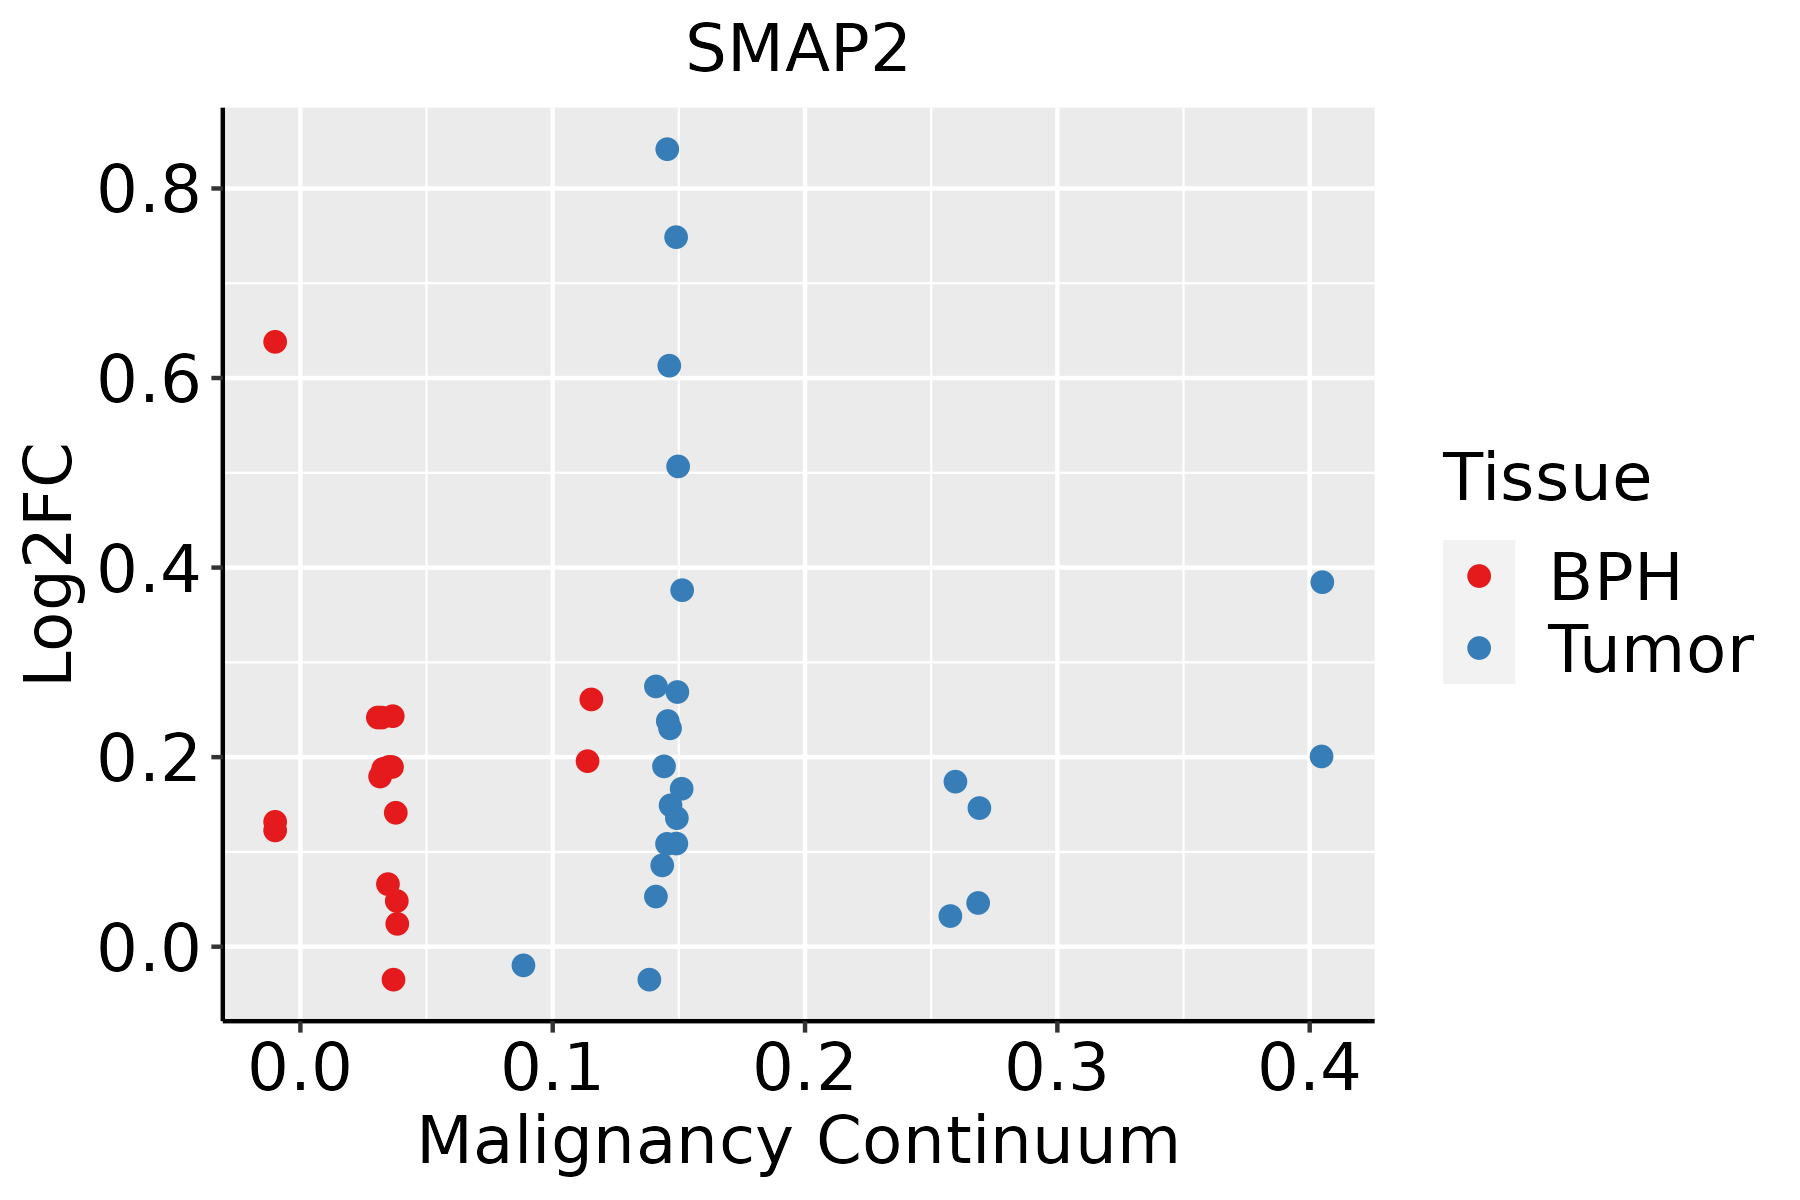 | BPH: Benign Prostatic Hyperplasia |
| ∗log2FC in expression of this searched gene in stem-like cells from each diseased tissue sample relative to stem-like cells in normal samples in each tissue plotted against the malignancy continuum. Samples are colored based on if they are from different disease stage. |
Top |
Malignant transformation related pathway analysis |
| Find out the enriched GO biological processes and KEGG pathways involved in transition from healthy to precancer to cancer |
| Tissue | Disease Stage | Enriched GO biological Processes |
| Colorectum | AD |  |
| Colorectum | SER |  |
| Colorectum | MSS |  |
| Colorectum | MSI-H |  |
| Colorectum | FAP |  |
| ∗Top 15 enriched GO BP terms are showed in the bar plot of each disease state in each tissue. Each row represents a significant GO biological process which is colored according to the -log10(p.adjust). |
| Page: 1 2 3 4 5 6 7 8 9 |
| GO ID | Tissue | Disease Stage | Description | Gene Ratio | Bg Ratio | pvalue | p.adjust | Count |
| Page: 1 |
| Pathway ID | Tissue | Disease Stage | Description | Gene Ratio | Bg Ratio | pvalue | p.adjust | qvalue | Count |
| hsa0414412 | Liver | Cirrhotic | Endocytosis | 119/2530 | 251/8465 | 2.33e-09 | 4.56e-08 | 2.81e-08 | 119 |
| hsa0414413 | Liver | Cirrhotic | Endocytosis | 119/2530 | 251/8465 | 2.33e-09 | 4.56e-08 | 2.81e-08 | 119 |
| hsa0414422 | Liver | HCC | Endocytosis | 178/4020 | 251/8465 | 2.03e-14 | 5.22e-13 | 2.91e-13 | 178 |
| hsa0414432 | Liver | HCC | Endocytosis | 178/4020 | 251/8465 | 2.03e-14 | 5.22e-13 | 2.91e-13 | 178 |
| hsa0414427 | Oral cavity | OSCC | Endocytosis | 174/3704 | 251/8465 | 9.42e-17 | 4.51e-15 | 2.29e-15 | 174 |
| hsa04144112 | Oral cavity | OSCC | Endocytosis | 174/3704 | 251/8465 | 9.42e-17 | 4.51e-15 | 2.29e-15 | 174 |
| hsa0414442 | Oral cavity | EOLP | Endocytosis | 71/1218 | 251/8465 | 5.28e-09 | 8.97e-08 | 5.29e-08 | 71 |
| hsa0414452 | Oral cavity | EOLP | Endocytosis | 71/1218 | 251/8465 | 5.28e-09 | 8.97e-08 | 5.29e-08 | 71 |
| hsa0414461 | Oral cavity | NEOLP | Endocytosis | 62/1112 | 251/8465 | 3.56e-07 | 4.92e-06 | 3.09e-06 | 62 |
| hsa0414471 | Oral cavity | NEOLP | Endocytosis | 62/1112 | 251/8465 | 3.56e-07 | 4.92e-06 | 3.09e-06 | 62 |
| hsa0414425 | Prostate | BPH | Endocytosis | 89/1718 | 251/8465 | 1.06e-08 | 1.29e-07 | 7.99e-08 | 89 |
| hsa04144111 | Prostate | BPH | Endocytosis | 89/1718 | 251/8465 | 1.06e-08 | 1.29e-07 | 7.99e-08 | 89 |
| hsa0414426 | Prostate | Tumor | Endocytosis | 92/1791 | 251/8465 | 7.83e-09 | 1.04e-07 | 6.43e-08 | 92 |
| hsa0414435 | Prostate | Tumor | Endocytosis | 92/1791 | 251/8465 | 7.83e-09 | 1.04e-07 | 6.43e-08 | 92 |
| Page: 1 |
Top |
Cell-cell communication analysis |
| Identification of potential cell-cell interactions between two cell types and their ligand-receptor pairs for different disease states |
| Ligand | Receptor | LRpair | Pathway | Tissue | Disease Stage |
| Page: 1 |
Top |
Single-cell gene regulatory network inference analysis |
| Find out the significant the regulons (TFs) and the target genes of each regulon across cell types for different disease states |
| TF | Cell Type | Tissue | Disease Stage | Target Gene | RSS | Regulon Activity |
| ∗The dot plots of a searched regulon are shown for all cell subpopulations in each disease state of each tissue based on the regulon specific score inferred using pySCENIC and by calculating the average expression. |
| Page: 1 |
Top |
Somatic mutation of malignant transformation related genes |
| Annotation of somatic variants for genes involved in malignant transformation |
| Hugo Symbol | Variant Class | Variant Classification | dbSNP RS | HGVSc | HGVSp | HGVSp Short | SWISSPROT | BIOTYPE | SIFT | PolyPhen | Tumor Sample Barcode | Tissue | Histology | Sex | Age | Stage | Therapy Types | Drugs | Outcome |
| SMAP2 | insertion | Frame_Shift_Ins | novel | c.307_308insCAGGAGTTCACAACCAGCCTAAGCAACATAGG | p.Arg103ProfsTer15 | p.R103Pfs*15 | Q8WU79 | protein_coding | TCGA-A8-A08H-01 | Breast | breast invasive carcinoma | Female | >=65 | I/II | Unknown | Unknown | SD | ||
| SMAP2 | SNV | Missense_Mutation | novel | c.692C>T | p.Ser231Phe | p.S231F | Q8WU79 | protein_coding | tolerated(0.05) | possibly_damaging(0.554) | TCGA-2W-A8YY-01 | Cervix | cervical & endocervical cancer | Female | <65 | I/II | Chemotherapy | cisplatin | CR |
| SMAP2 | SNV | Missense_Mutation | c.805C>A | p.Leu269Ile | p.L269I | Q8WU79 | protein_coding | deleterious(0) | probably_damaging(0.967) | TCGA-FU-A3HZ-01 | Cervix | cervical & endocervical cancer | Female | <65 | I/II | Chemotherapy | cisplatin | CR | |
| SMAP2 | SNV | Missense_Mutation | c.283N>A | p.Ala95Thr | p.A95T | Q8WU79 | protein_coding | deleterious(0) | benign(0.151) | TCGA-AA-3664-01 | Colorectum | colon adenocarcinoma | Female | >=65 | I/II | Unknown | Unknown | SD | |
| SMAP2 | SNV | Missense_Mutation | novel | c.1005N>A | p.Met335Ile | p.M335I | Q8WU79 | protein_coding | tolerated(0.23) | benign(0) | TCGA-AA-3947-01 | Colorectum | colon adenocarcinoma | Female | <65 | I/II | Unknown | Unknown | SD |
| SMAP2 | SNV | Missense_Mutation | rs150217633 | c.377N>A | p.Arg126Gln | p.R126Q | Q8WU79 | protein_coding | deleterious(0.02) | possibly_damaging(0.82) | TCGA-AA-A010-01 | Colorectum | colon adenocarcinoma | Female | <65 | I/II | Chemotherapy | folinic | CR |
| SMAP2 | SNV | Missense_Mutation | novel | c.208N>A | p.Leu70Ile | p.L70I | Q8WU79 | protein_coding | deleterious(0.02) | probably_damaging(0.917) | TCGA-AX-A06F-01 | Endometrium | uterine corpus endometrioid carcinoma | Female | <65 | III/IV | Chemotherapy | carboplatin | SD |
| SMAP2 | SNV | Missense_Mutation | rs374827569 | c.521N>A | p.Arg174Gln | p.R174Q | Q8WU79 | protein_coding | deleterious(0.04) | benign(0.058) | TCGA-AX-A0IZ-01 | Endometrium | uterine corpus endometrioid carcinoma | Female | <65 | I/II | Unknown | Unknown | SD |
| SMAP2 | SNV | Missense_Mutation | novel | c.77A>C | p.Lys26Thr | p.K26T | Q8WU79 | protein_coding | deleterious(0) | probably_damaging(0.996) | TCGA-AX-A2HC-01 | Endometrium | uterine corpus endometrioid carcinoma | Female | <65 | III/IV | Chemotherapy | paclitaxel | PD |
| SMAP2 | SNV | Missense_Mutation | c.35N>G | p.Tyr12Cys | p.Y12C | Q8WU79 | protein_coding | deleterious(0) | probably_damaging(0.916) | TCGA-B5-A11N-01 | Endometrium | uterine corpus endometrioid carcinoma | Female | >=65 | I/II | Unknown | Unknown | SD |
| Page: 1 2 3 4 |
Top |
Related drugs of malignant transformation related genes |
| Identification of chemicals and drugs interact with genes involved in malignant transfromation |
| (DGIdb 4.0) |
| Entrez ID | Symbol | Category | Interaction Types | Drug Claim Name | Drug Name | PMIDs |
| Page: 1 |

Copyright 2023-Present -The University of Texas Health Science Center at Houston |