
|
|||||
|
 | |
| |
| |
| |
| |
| |
|
Gene: SMAP1 |
Gene summary for SMAP1 |
| Gene information | Species | Human | Gene symbol | SMAP1 | Gene ID | 60682 |
| Gene name | small ArfGAP 1 | |
| Gene Alias | SMAP-1 | |
| Cytomap | 6q13 | |
| Gene Type | protein-coding | GO ID | GO:0002262 | UniProtAcc | Q8IYB5 |
Top |
Malignant transformation analysis |
| Identification of the aberrant gene expression in precancerous and cancerous lesions by comparing the gene expression of stem-like cells in diseased tissues with normal stem cells |
| Entrez ID | Symbol | Replicates | Species | Organ | Tissue | Adj P-value | Log2FC | Malignancy |
| 60682 | SMAP1 | LZE4T | Human | Esophagus | ESCC | 1.76e-16 | 6.98e-01 | 0.0811 |
| 60682 | SMAP1 | LZE7T | Human | Esophagus | ESCC | 4.87e-09 | 7.89e-01 | 0.0667 |
| 60682 | SMAP1 | LZE8T | Human | Esophagus | ESCC | 1.30e-03 | 1.28e-01 | 0.067 |
| 60682 | SMAP1 | LZE20T | Human | Esophagus | ESCC | 2.51e-08 | 3.24e-01 | 0.0662 |
| 60682 | SMAP1 | LZE24T | Human | Esophagus | ESCC | 1.50e-23 | 9.67e-01 | 0.0596 |
| 60682 | SMAP1 | LZE6T | Human | Esophagus | ESCC | 7.04e-05 | 9.30e-02 | 0.0845 |
| 60682 | SMAP1 | P1T-E | Human | Esophagus | ESCC | 1.64e-10 | 6.68e-01 | 0.0875 |
| 60682 | SMAP1 | P2T-E | Human | Esophagus | ESCC | 6.50e-29 | 4.97e-01 | 0.1177 |
| 60682 | SMAP1 | P4T-E | Human | Esophagus | ESCC | 9.40e-29 | 8.19e-01 | 0.1323 |
| 60682 | SMAP1 | P5T-E | Human | Esophagus | ESCC | 4.30e-37 | 6.24e-01 | 0.1327 |
| 60682 | SMAP1 | P8T-E | Human | Esophagus | ESCC | 1.22e-39 | 7.68e-01 | 0.0889 |
| 60682 | SMAP1 | P9T-E | Human | Esophagus | ESCC | 6.25e-16 | 4.49e-01 | 0.1131 |
| 60682 | SMAP1 | P10T-E | Human | Esophagus | ESCC | 2.18e-16 | 3.17e-01 | 0.116 |
| 60682 | SMAP1 | P11T-E | Human | Esophagus | ESCC | 2.98e-16 | 7.63e-01 | 0.1426 |
| 60682 | SMAP1 | P12T-E | Human | Esophagus | ESCC | 4.94e-36 | 6.62e-01 | 0.1122 |
| 60682 | SMAP1 | P15T-E | Human | Esophagus | ESCC | 1.57e-43 | 1.04e+00 | 0.1149 |
| 60682 | SMAP1 | P16T-E | Human | Esophagus | ESCC | 4.50e-31 | 6.17e-01 | 0.1153 |
| 60682 | SMAP1 | P17T-E | Human | Esophagus | ESCC | 2.74e-13 | 6.65e-01 | 0.1278 |
| 60682 | SMAP1 | P19T-E | Human | Esophagus | ESCC | 4.49e-04 | 8.23e-01 | 0.1662 |
| 60682 | SMAP1 | P20T-E | Human | Esophagus | ESCC | 3.78e-30 | 7.78e-01 | 0.1124 |
| Page: 1 2 3 4 5 6 7 |
| Tissue | Expression Dynamics | Abbreviation |
| Esophagus | 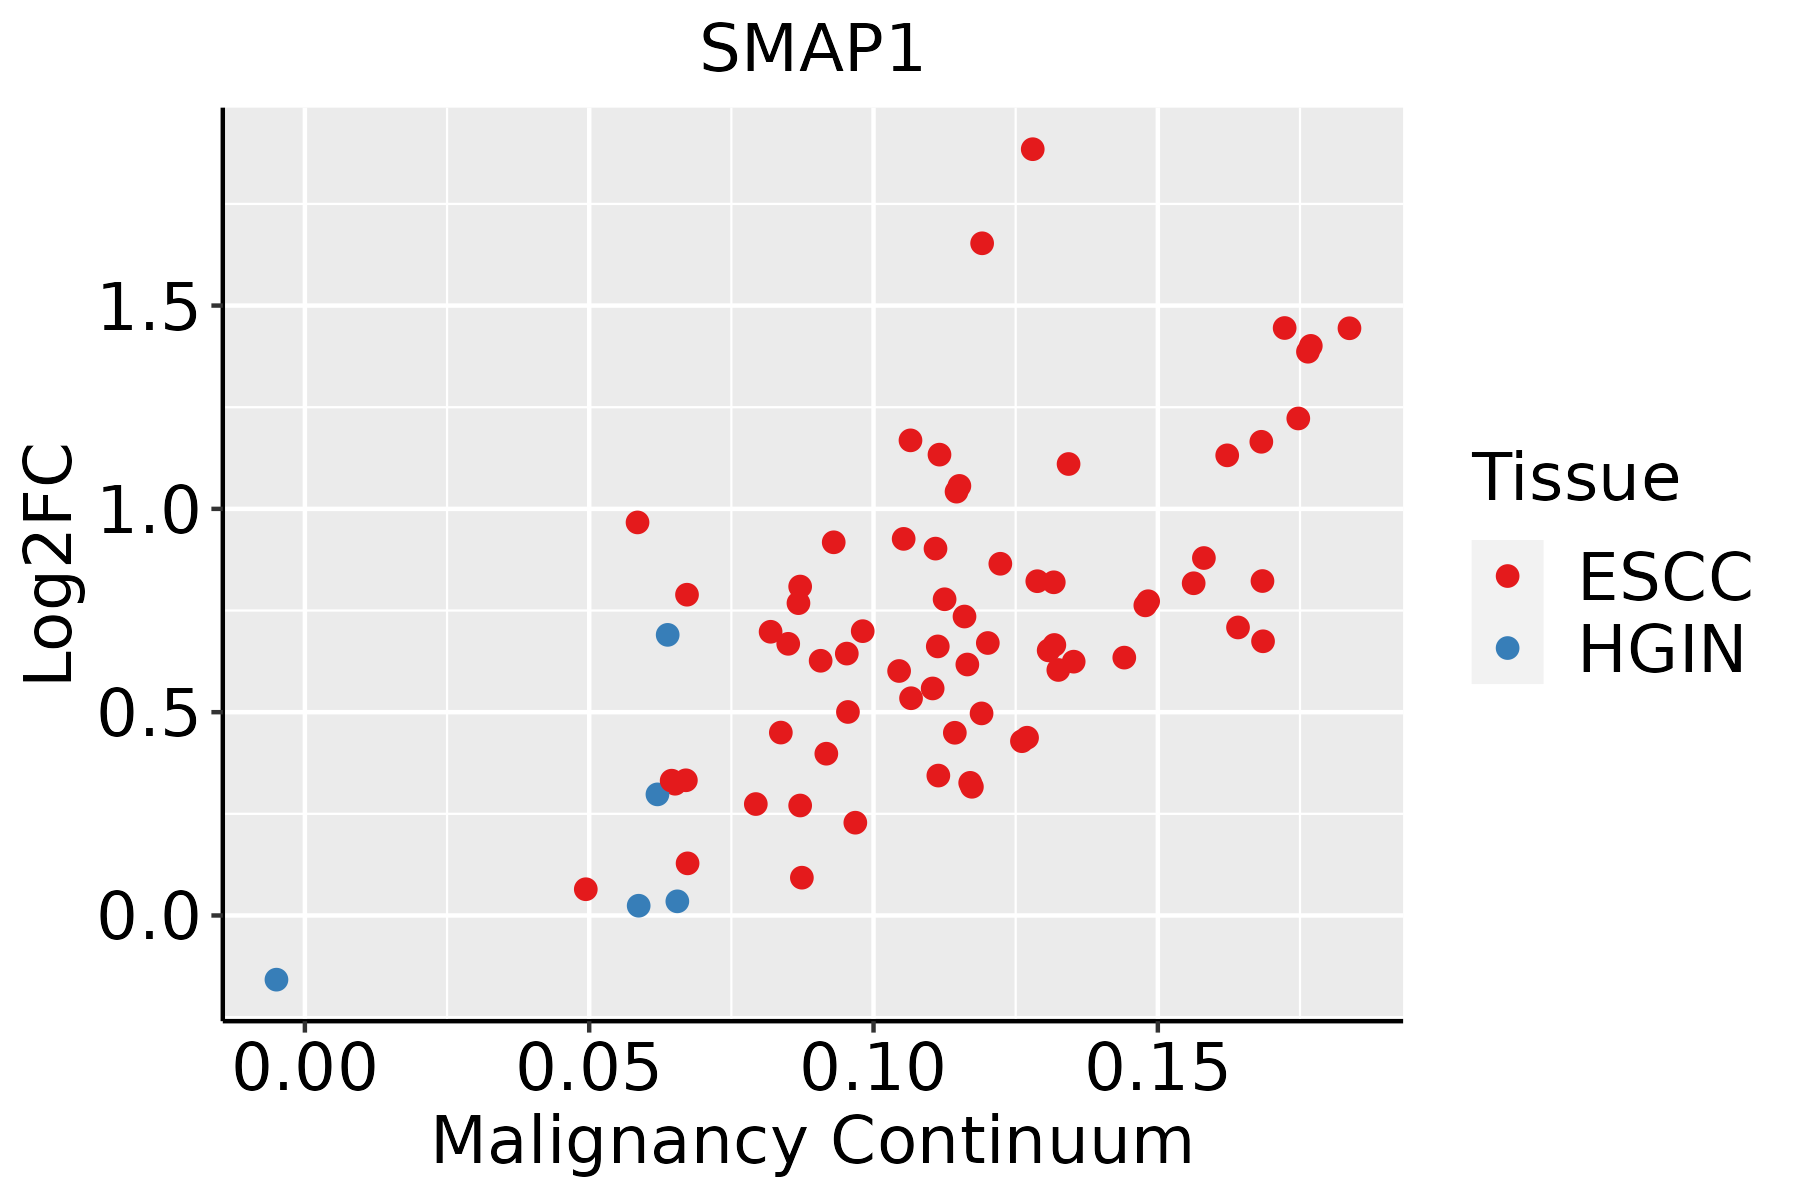 | ESCC: Esophageal squamous cell carcinoma |
| HGIN: High-grade intraepithelial neoplasias | ||
| LGIN: Low-grade intraepithelial neoplasias | ||
| Liver |  | HCC: Hepatocellular carcinoma |
| NAFLD: Non-alcoholic fatty liver disease | ||
| Lung |  | AAH: Atypical adenomatous hyperplasia |
| AIS: Adenocarcinoma in situ | ||
| IAC: Invasive lung adenocarcinoma | ||
| MIA: Minimally invasive adenocarcinoma | ||
| Oral Cavity |  | EOLP: Erosive Oral lichen planus |
| LP: leukoplakia | ||
| NEOLP: Non-erosive oral lichen planus | ||
| OSCC: Oral squamous cell carcinoma | ||
| Skin | 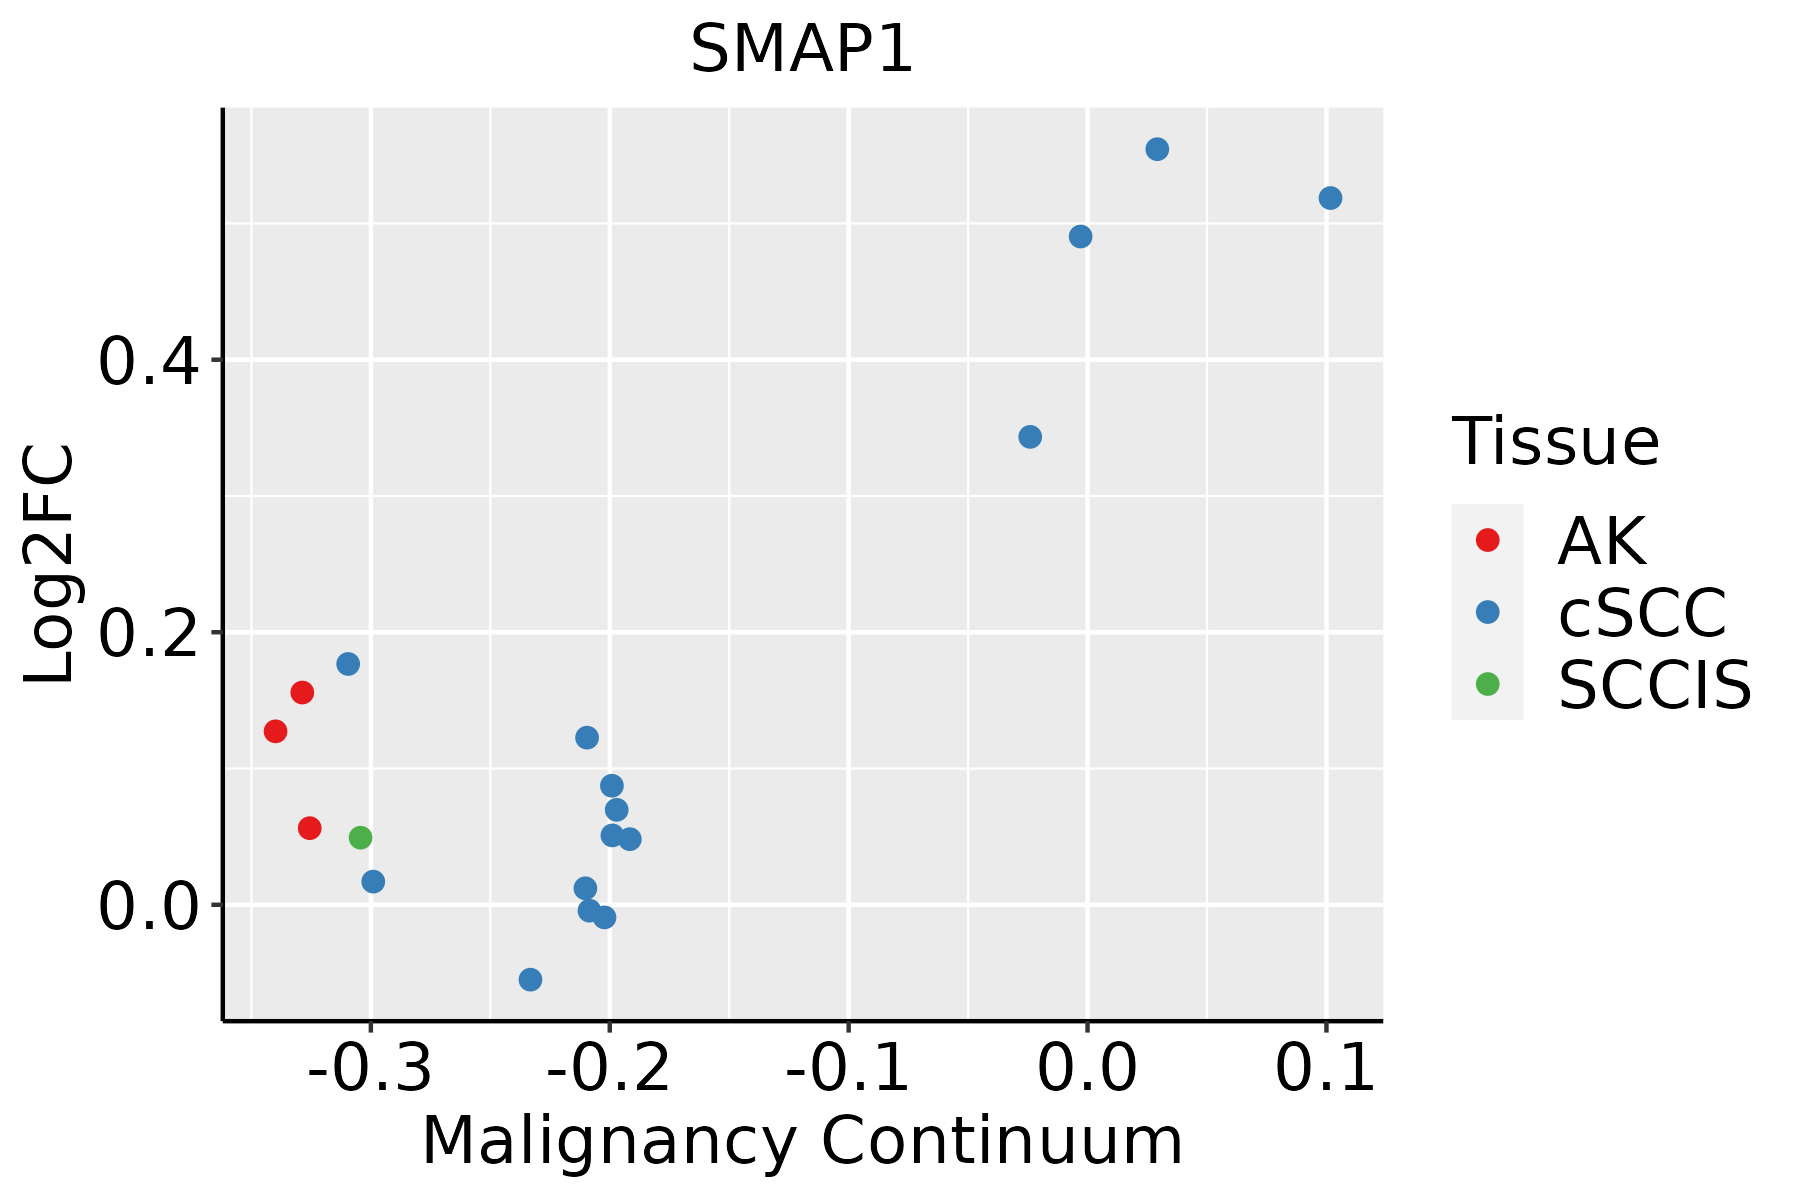 | AK: Actinic keratosis |
| cSCC: Cutaneous squamous cell carcinoma | ||
| SCCIS:squamous cell carcinoma in situ | ||
| Thyroid |  | ATC: Anaplastic thyroid cancer |
| HT: Hashimoto's thyroiditis | ||
| PTC: Papillary thyroid cancer |
| ∗log2FC in expression of this searched gene in stem-like cells from each diseased tissue sample relative to stem-like cells in normal samples in each tissue plotted against the malignancy continuum. Samples are colored based on if they are from different disease stage. |
Top |
Malignant transformation related pathway analysis |
| Find out the enriched GO biological processes and KEGG pathways involved in transition from healthy to precancer to cancer |
| Tissue | Disease Stage | Enriched GO biological Processes |
| Colorectum | AD |  |
| Colorectum | SER |  |
| Colorectum | MSS |  |
| Colorectum | MSI-H |  |
| Colorectum | FAP |  |
| ∗Top 15 enriched GO BP terms are showed in the bar plot of each disease state in each tissue. Each row represents a significant GO biological process which is colored according to the -log10(p.adjust). |
| Page: 1 2 3 4 5 6 7 8 9 |
| GO ID | Tissue | Disease Stage | Description | Gene Ratio | Bg Ratio | pvalue | p.adjust | Count |
| GO:0030099111 | Esophagus | ESCC | myeloid cell differentiation | 232/8552 | 381/18723 | 1.22e-09 | 2.90e-08 | 232 |
| GO:003010018 | Esophagus | ESCC | regulation of endocytosis | 135/8552 | 211/18723 | 5.75e-08 | 1.02e-06 | 135 |
| GO:0002262111 | Esophagus | ESCC | myeloid cell homeostasis | 104/8552 | 157/18723 | 1.49e-07 | 2.36e-06 | 104 |
| GO:0034101111 | Esophagus | ESCC | erythrocyte homeostasis | 88/8552 | 129/18723 | 1.81e-07 | 2.84e-06 | 88 |
| GO:0048872111 | Esophagus | ESCC | homeostasis of number of cells | 163/8552 | 272/18723 | 1.40e-06 | 1.69e-05 | 163 |
| GO:0030218111 | Esophagus | ESCC | erythrocyte differentiation | 80/8552 | 120/18723 | 2.69e-06 | 3.08e-05 | 80 |
| GO:000689818 | Esophagus | ESCC | receptor-mediated endocytosis | 142/8552 | 244/18723 | 5.22e-05 | 4.05e-04 | 142 |
| GO:007258314 | Esophagus | ESCC | clathrin-dependent endocytosis | 34/8552 | 47/18723 | 1.91e-04 | 1.21e-03 | 34 |
| GO:1903706110 | Esophagus | ESCC | regulation of hemopoiesis | 201/8552 | 367/18723 | 2.60e-04 | 1.58e-03 | 201 |
| GO:004563918 | Esophagus | ESCC | positive regulation of myeloid cell differentiation | 64/8552 | 103/18723 | 5.54e-04 | 3.03e-03 | 64 |
| GO:0045637111 | Esophagus | ESCC | regulation of myeloid cell differentiation | 118/8552 | 210/18723 | 1.35e-03 | 6.43e-03 | 118 |
| GO:004564619 | Esophagus | ESCC | regulation of erythrocyte differentiation | 32/8552 | 47/18723 | 1.59e-03 | 7.43e-03 | 32 |
| GO:004825916 | Esophagus | ESCC | regulation of receptor-mediated endocytosis | 66/8552 | 110/18723 | 1.72e-03 | 7.96e-03 | 66 |
| GO:003009912 | Liver | Cirrhotic | myeloid cell differentiation | 135/4634 | 381/18723 | 1.69e-06 | 3.22e-05 | 135 |
| GO:000689811 | Liver | Cirrhotic | receptor-mediated endocytosis | 91/4634 | 244/18723 | 8.13e-06 | 1.22e-04 | 91 |
| GO:003410112 | Liver | Cirrhotic | erythrocyte homeostasis | 54/4634 | 129/18723 | 1.41e-05 | 1.97e-04 | 54 |
| GO:00302187 | Liver | Cirrhotic | erythrocyte differentiation | 50/4634 | 120/18723 | 3.35e-05 | 4.13e-04 | 50 |
| GO:000226212 | Liver | Cirrhotic | myeloid cell homeostasis | 59/4634 | 157/18723 | 2.33e-04 | 2.11e-03 | 59 |
| GO:003010011 | Liver | Cirrhotic | regulation of endocytosis | 74/4634 | 211/18723 | 4.86e-04 | 3.90e-03 | 74 |
| GO:004887212 | Liver | Cirrhotic | homeostasis of number of cells | 89/4634 | 272/18723 | 1.76e-03 | 1.12e-02 | 89 |
| Page: 1 2 3 4 5 6 |
| Pathway ID | Tissue | Disease Stage | Description | Gene Ratio | Bg Ratio | pvalue | p.adjust | qvalue | Count |
| hsa04144210 | Esophagus | ESCC | Endocytosis | 186/4205 | 251/8465 | 9.74e-16 | 4.66e-14 | 2.39e-14 | 186 |
| hsa0414437 | Esophagus | ESCC | Endocytosis | 186/4205 | 251/8465 | 9.74e-16 | 4.66e-14 | 2.39e-14 | 186 |
| hsa0414412 | Liver | Cirrhotic | Endocytosis | 119/2530 | 251/8465 | 2.33e-09 | 4.56e-08 | 2.81e-08 | 119 |
| hsa0414413 | Liver | Cirrhotic | Endocytosis | 119/2530 | 251/8465 | 2.33e-09 | 4.56e-08 | 2.81e-08 | 119 |
| hsa0414422 | Liver | HCC | Endocytosis | 178/4020 | 251/8465 | 2.03e-14 | 5.22e-13 | 2.91e-13 | 178 |
| hsa0414432 | Liver | HCC | Endocytosis | 178/4020 | 251/8465 | 2.03e-14 | 5.22e-13 | 2.91e-13 | 178 |
| hsa0414414 | Lung | IAC | Endocytosis | 51/1053 | 251/8465 | 2.25e-04 | 2.54e-03 | 1.68e-03 | 51 |
| hsa0414415 | Lung | IAC | Endocytosis | 51/1053 | 251/8465 | 2.25e-04 | 2.54e-03 | 1.68e-03 | 51 |
| hsa0414423 | Lung | AIS | Endocytosis | 52/961 | 251/8465 | 9.74e-06 | 3.04e-04 | 1.95e-04 | 52 |
| hsa0414433 | Lung | AIS | Endocytosis | 52/961 | 251/8465 | 9.74e-06 | 3.04e-04 | 1.95e-04 | 52 |
| hsa0414427 | Oral cavity | OSCC | Endocytosis | 174/3704 | 251/8465 | 9.42e-17 | 4.51e-15 | 2.29e-15 | 174 |
| hsa04144112 | Oral cavity | OSCC | Endocytosis | 174/3704 | 251/8465 | 9.42e-17 | 4.51e-15 | 2.29e-15 | 174 |
| hsa0414442 | Oral cavity | EOLP | Endocytosis | 71/1218 | 251/8465 | 5.28e-09 | 8.97e-08 | 5.29e-08 | 71 |
| hsa0414452 | Oral cavity | EOLP | Endocytosis | 71/1218 | 251/8465 | 5.28e-09 | 8.97e-08 | 5.29e-08 | 71 |
| Page: 1 |
Top |
Cell-cell communication analysis |
| Identification of potential cell-cell interactions between two cell types and their ligand-receptor pairs for different disease states |
| Ligand | Receptor | LRpair | Pathway | Tissue | Disease Stage |
| Page: 1 |
Top |
Single-cell gene regulatory network inference analysis |
| Find out the significant the regulons (TFs) and the target genes of each regulon across cell types for different disease states |
| TF | Cell Type | Tissue | Disease Stage | Target Gene | RSS | Regulon Activity |
| ∗The dot plots of a searched regulon are shown for all cell subpopulations in each disease state of each tissue based on the regulon specific score inferred using pySCENIC and by calculating the average expression. |
| Page: 1 |
Top |
Somatic mutation of malignant transformation related genes |
| Annotation of somatic variants for genes involved in malignant transformation |
| Hugo Symbol | Variant Class | Variant Classification | dbSNP RS | HGVSc | HGVSp | HGVSp Short | SWISSPROT | BIOTYPE | SIFT | PolyPhen | Tumor Sample Barcode | Tissue | Histology | Sex | Age | Stage | Therapy Types | Drugs | Outcome |
| SMAP1 | SNV | Missense_Mutation | rs746425842 | c.388G>A | p.Asp130Asn | p.D130N | Q8IYB5 | protein_coding | tolerated(0.17) | benign(0.368) | TCGA-AN-A046-01 | Breast | breast invasive carcinoma | Female | >=65 | I/II | Unknown | Unknown | SD |
| SMAP1 | SNV | Missense_Mutation | novel | c.560N>A | p.Pro187Gln | p.P187Q | Q8IYB5 | protein_coding | tolerated(0.14) | benign(0.003) | TCGA-C8-A27B-01 | Breast | breast invasive carcinoma | Female | <65 | I/II | Chemotherapy | 5-fluorouracil | CR |
| SMAP1 | SNV | Missense_Mutation | c.637G>C | p.Glu213Gln | p.E213Q | Q8IYB5 | protein_coding | tolerated(0.12) | probably_damaging(0.975) | TCGA-EW-A1PB-01 | Breast | breast invasive carcinoma | Female | >=65 | III/IV | Unknown | Unknown | SD | |
| SMAP1 | insertion | Nonsense_Mutation | novel | c.660_661insCTTACACCCAGCTAATTTTTTCATTTTTTGTAGAGACAGACT | p.Leu221_Asp222insThrProSerTerPhePheHisPheLeuTerArgGlnThrLeu | p.L221_D222insTPS*FFHFL*RQTL | Q8IYB5 | protein_coding | TCGA-A2-A0EY-01 | Breast | breast invasive carcinoma | Female | <65 | I/II | Chemotherapy | adriamycin | SD | ||
| SMAP1 | SNV | Missense_Mutation | c.14N>G | p.Ser5Cys | p.S5C | Q8IYB5 | protein_coding | deleterious(0) | probably_damaging(0.981) | TCGA-EK-A2R8-01 | Cervix | cervical & endocervical cancer | Female | <65 | I/II | Unknown | Unknown | SD | |
| SMAP1 | SNV | Missense_Mutation | novel | c.815N>A | p.Ala272Glu | p.A272E | Q8IYB5 | protein_coding | tolerated(0.12) | benign(0.216) | TCGA-VS-A8QF-01 | Cervix | cervical & endocervical cancer | Female | <65 | I/II | Chemotherapy | cisplatin | CR |
| SMAP1 | SNV | Missense_Mutation | novel | c.925N>C | p.Tyr309His | p.Y309H | Q8IYB5 | protein_coding | deleterious(0) | probably_damaging(0.998) | TCGA-VS-A94Z-01 | Cervix | cervical & endocervical cancer | Female | <65 | I/II | Chemotherapy | cisplatin | CR |
| SMAP1 | SNV | Missense_Mutation | rs771006483 | c.320N>A | p.Arg107Gln | p.R107Q | Q8IYB5 | protein_coding | tolerated(0.2) | possibly_damaging(0.792) | TCGA-AG-A002-01 | Colorectum | rectum adenocarcinoma | Male | <65 | I/II | Unknown | Unknown | SD |
| SMAP1 | SNV | Missense_Mutation | novel | c.538G>A | p.Glu180Lys | p.E180K | Q8IYB5 | protein_coding | tolerated(0.24) | possibly_damaging(0.476) | TCGA-AJ-A23O-01 | Endometrium | uterine corpus endometrioid carcinoma | Female | >=65 | I/II | Unknown | Unknown | SD |
| SMAP1 | SNV | Missense_Mutation | rs771006483 | c.320N>A | p.Arg107Gln | p.R107Q | Q8IYB5 | protein_coding | tolerated(0.2) | possibly_damaging(0.792) | TCGA-AJ-A5DW-01 | Endometrium | uterine corpus endometrioid carcinoma | Female | <65 | I/II | Unknown | Unknown | SD |
| Page: 1 2 3 4 |
Top |
Related drugs of malignant transformation related genes |
| Identification of chemicals and drugs interact with genes involved in malignant transfromation |
| (DGIdb 4.0) |
| Entrez ID | Symbol | Category | Interaction Types | Drug Claim Name | Drug Name | PMIDs |
| Page: 1 |

Copyright 2023-Present -The University of Texas Health Science Center at Houston |