
|
|||||
|
 | |
| |
| |
| |
| |
| |
|
Gene: SMAD9 |
Gene summary for SMAD9 |
| Gene information | Species | Human | Gene symbol | SMAD9 | Gene ID | 4093 |
| Gene name | SMAD family member 9 | |
| Gene Alias | MADH6 | |
| Cytomap | 13q13.3 | |
| Gene Type | protein-coding | GO ID | GO:0006139 | UniProtAcc | O15198 |
Top |
Malignant transformation analysis |
| Identification of the aberrant gene expression in precancerous and cancerous lesions by comparing the gene expression of stem-like cells in diseased tissues with normal stem cells |
| Entrez ID | Symbol | Replicates | Species | Organ | Tissue | Adj P-value | Log2FC | Malignancy |
| 4093 | SMAD9 | HTA11_696_2000001011 | Human | Colorectum | AD | 8.96e-12 | 6.00e-01 | -0.1464 |
| 4093 | SMAD9 | HTA11_866_2000001011 | Human | Colorectum | AD | 1.23e-06 | 4.36e-01 | -0.1001 |
| 4093 | SMAD9 | HTA11_2992_2000001011 | Human | Colorectum | SER | 1.13e-02 | -2.59e-02 | -0.1706 |
| 4093 | SMAD9 | HTA11_866_3004761011 | Human | Colorectum | AD | 3.40e-02 | 2.11e-01 | 0.096 |
| 4093 | SMAD9 | A002-C-010 | Human | Colorectum | FAP | 5.13e-03 | 3.22e-01 | 0.242 |
| 4093 | SMAD9 | A002-C-021 | Human | Colorectum | FAP | 6.05e-08 | 4.50e-01 | 0.1171 |
| 4093 | SMAD9 | F072B | Human | Colorectum | FAP | 6.27e-07 | 5.33e-01 | 0.257 |
| 4093 | SMAD9 | AEH-subject2 | Human | Endometrium | AEH | 1.76e-07 | -2.45e-01 | -0.2525 |
| 4093 | SMAD9 | EEC-subject2 | Human | Endometrium | EEC | 4.43e-13 | -2.76e-01 | -0.2607 |
| 4093 | SMAD9 | EEC-subject3 | Human | Endometrium | EEC | 1.00e-05 | -2.20e-01 | -0.2525 |
| 4093 | SMAD9 | EEC-subject5 | Human | Endometrium | EEC | 1.75e-02 | -1.90e-01 | -0.249 |
| 4093 | SMAD9 | GSM5276934 | Human | Endometrium | EEC | 2.90e-13 | -2.95e-01 | -0.0913 |
| 4093 | SMAD9 | GSM5276937 | Human | Endometrium | EEC | 5.33e-07 | -2.57e-01 | -0.0897 |
| 4093 | SMAD9 | GSM6177620_NYU_UCEC1_lib1_lib1 | Human | Endometrium | EEC | 7.84e-10 | -2.05e-01 | -0.1869 |
| 4093 | SMAD9 | GSM6177620_NYU_UCEC1_lib2_lib2 | Human | Endometrium | EEC | 3.65e-11 | -3.00e-01 | -0.1875 |
| 4093 | SMAD9 | GSM6177620_NYU_UCEC1_lib3_lib3 | Human | Endometrium | EEC | 5.19e-09 | -2.48e-01 | -0.1883 |
| 4093 | SMAD9 | GSM6177621_NYU_UCEC2_lib1_lib1 | Human | Endometrium | EEC | 2.81e-13 | -2.33e-01 | -0.1934 |
| 4093 | SMAD9 | GSM6177622_NYU_UCEC3_lib1_lib1 | Human | Endometrium | EEC | 1.96e-15 | -2.90e-01 | -0.1917 |
| 4093 | SMAD9 | GSM6177622_NYU_UCEC3_lib2_lib2 | Human | Endometrium | EEC | 7.93e-16 | -2.89e-01 | -0.1916 |
| 4093 | SMAD9 | GSM6177623_NYU_UCEC3_Vis | Human | Endometrium | EEC | 2.76e-07 | -2.42e-01 | -0.1269 |
| Page: 1 2 |
| Tissue | Expression Dynamics | Abbreviation |
| Colorectum (GSE201348) |  | FAP: Familial adenomatous polyposis |
| CRC: Colorectal cancer | ||
| Colorectum (HTA11) |  | AD: Adenomas |
| SER: Sessile serrated lesions | ||
| MSI-H: Microsatellite-high colorectal cancer | ||
| MSS: Microsatellite stable colorectal cancer | ||
| Endometrium | 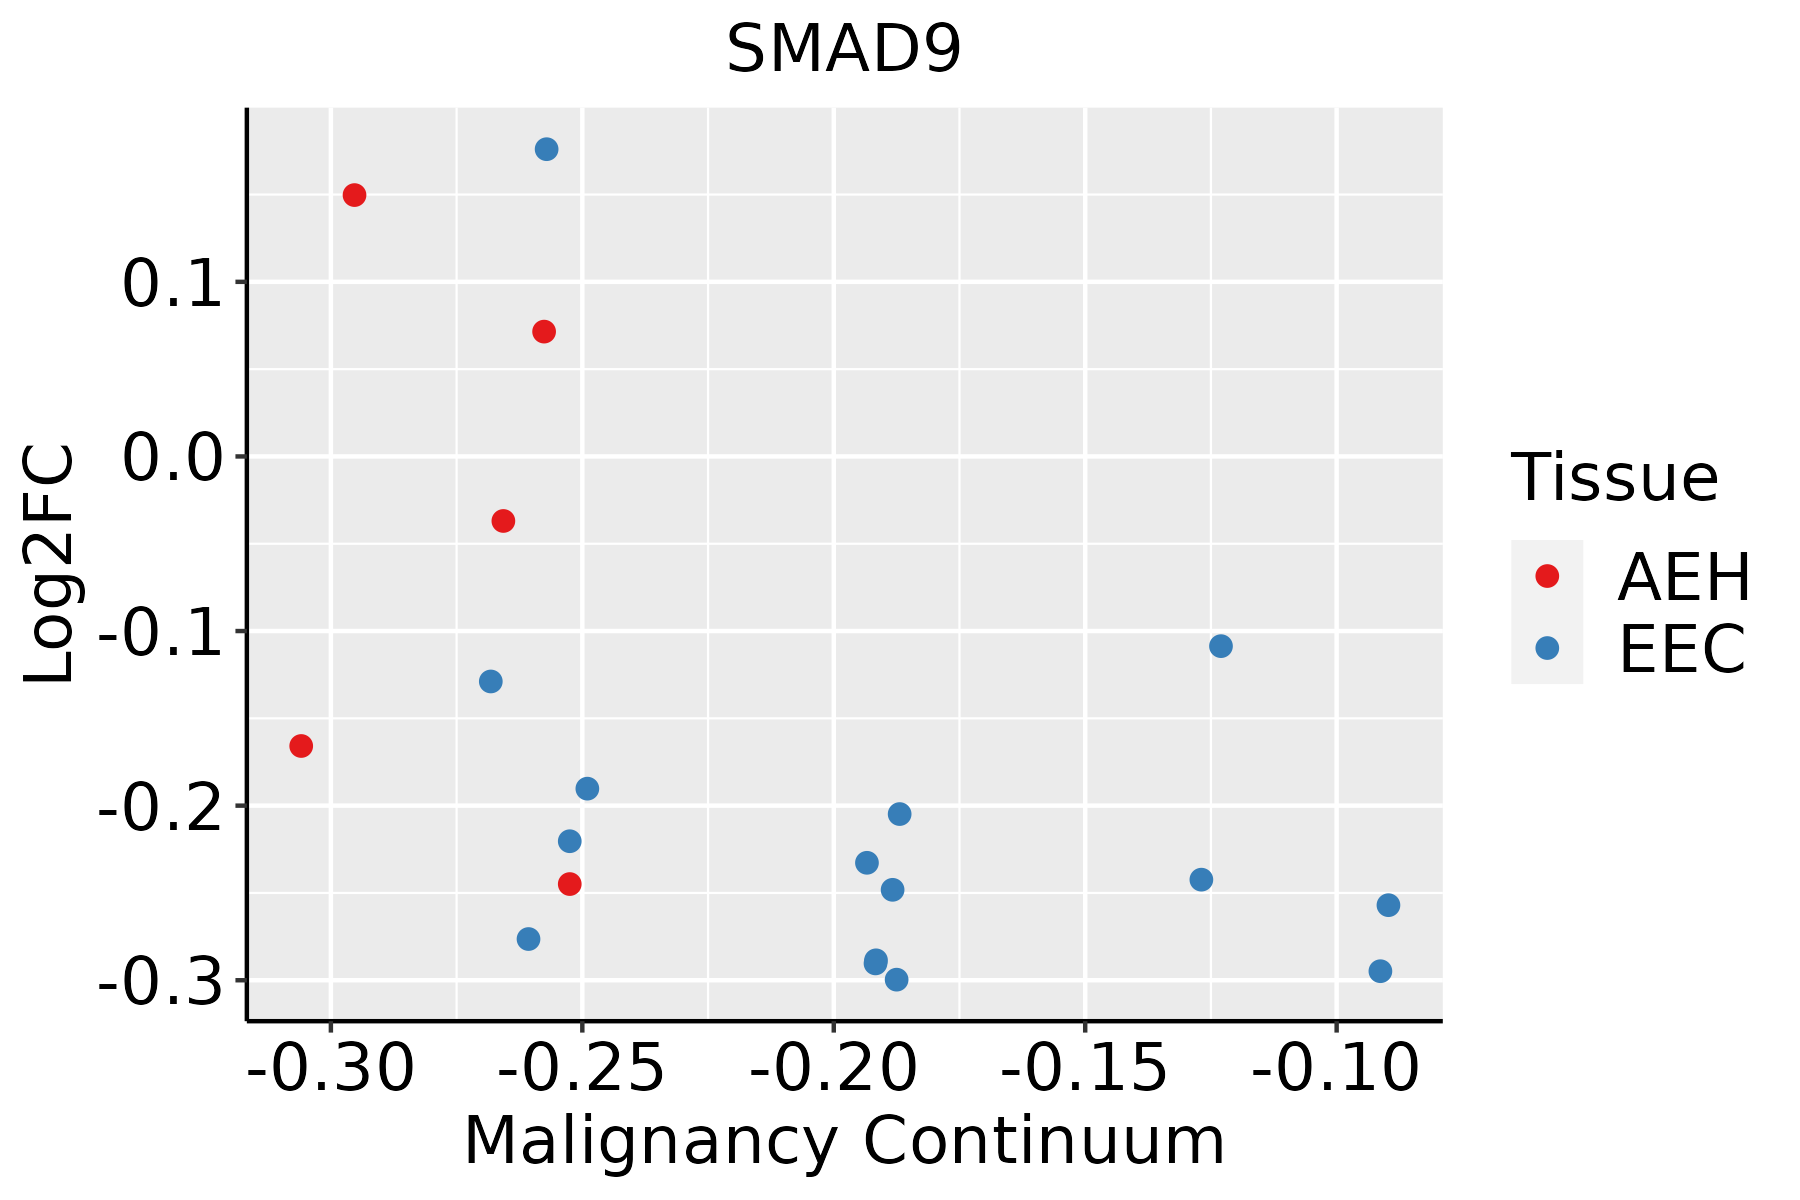 | AEH: Atypical endometrial hyperplasia |
| EEC: Endometrioid Cancer | ||
| Thyroid | 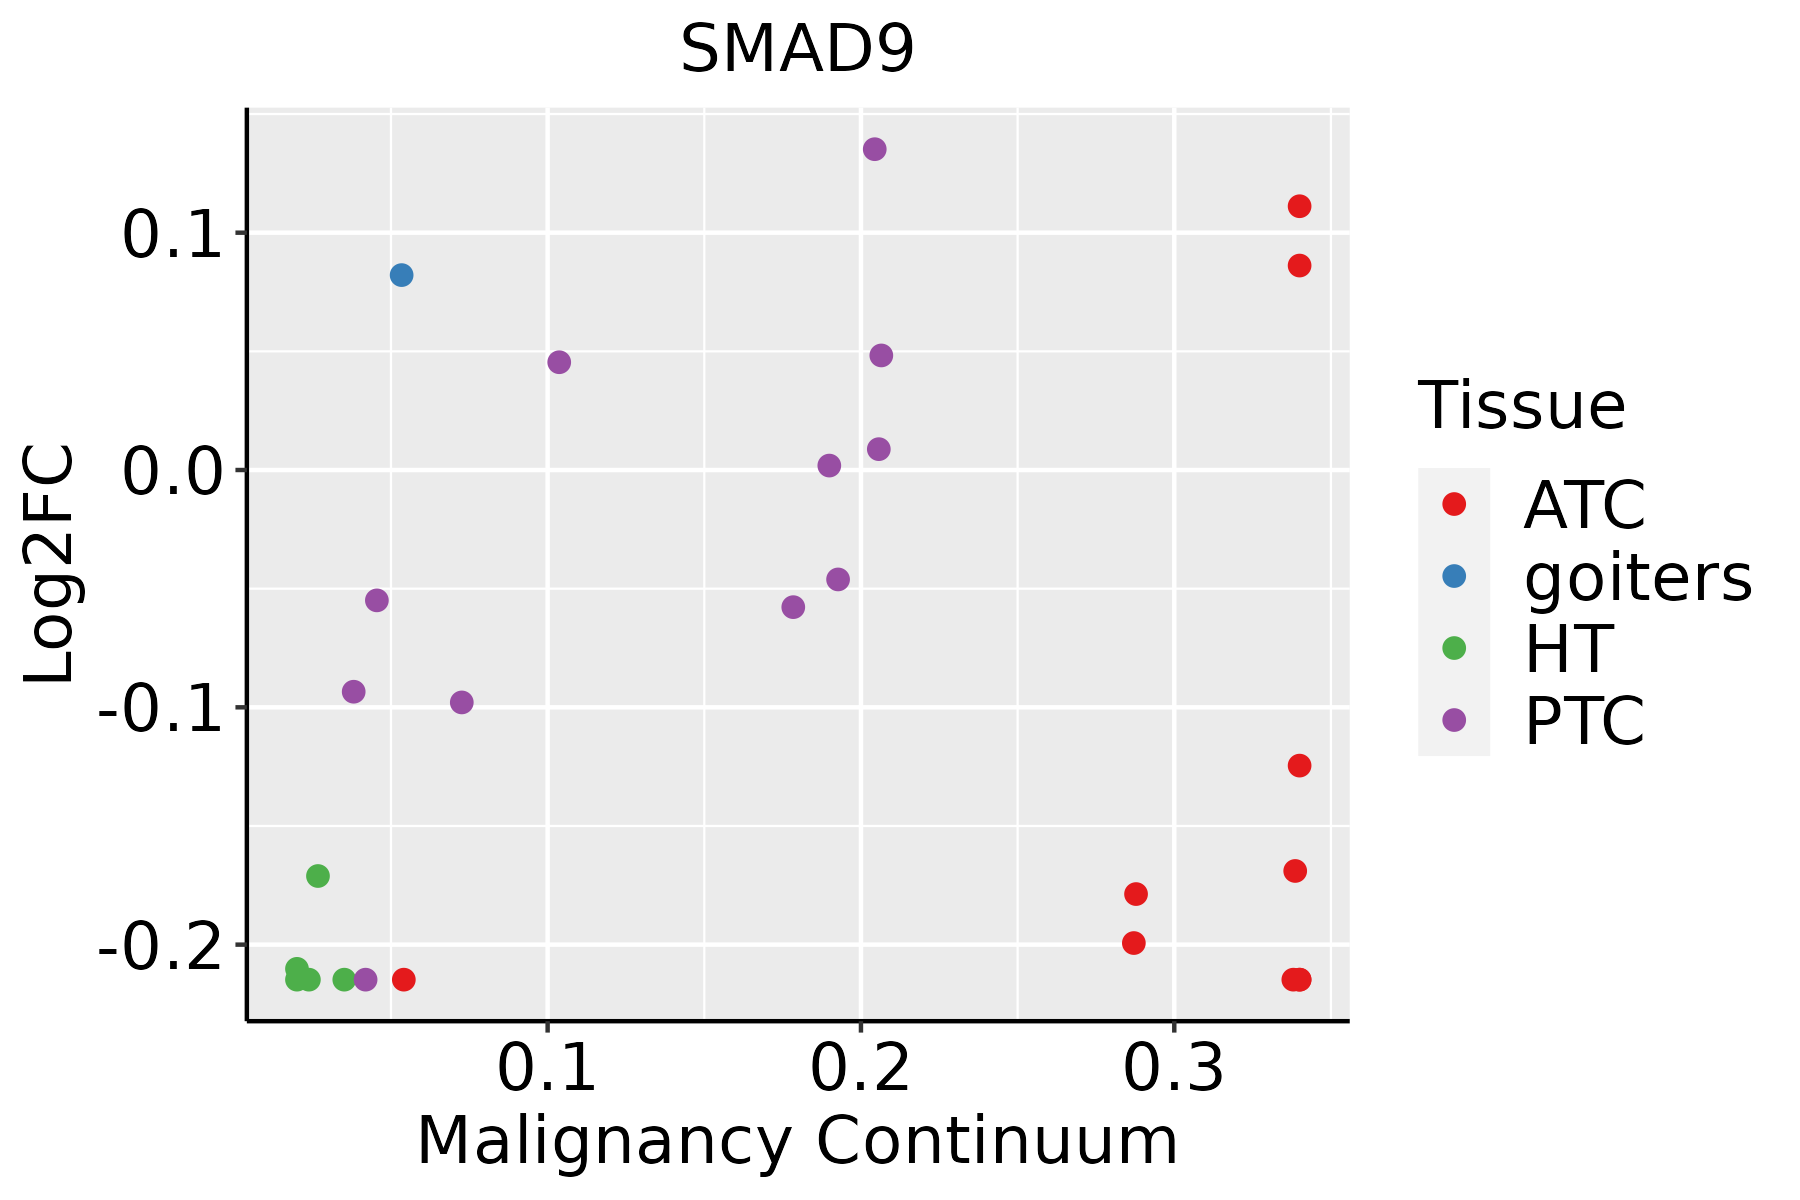 | ATC: Anaplastic thyroid cancer |
| HT: Hashimoto's thyroiditis | ||
| PTC: Papillary thyroid cancer |
| ∗log2FC in expression of this searched gene in stem-like cells from each diseased tissue sample relative to stem-like cells in normal samples in each tissue plotted against the malignancy continuum. Samples are colored based on if they are from different disease stage. |
Top |
Malignant transformation related pathway analysis |
| Find out the enriched GO biological processes and KEGG pathways involved in transition from healthy to precancer to cancer |
| Tissue | Disease Stage | Enriched GO biological Processes |
| Colorectum | AD |  |
| Colorectum | SER |  |
| Colorectum | MSS |  |
| Colorectum | MSI-H |  |
| Colorectum | FAP |  |
| ∗Top 15 enriched GO BP terms are showed in the bar plot of each disease state in each tissue. Each row represents a significant GO biological process which is colored according to the -log10(p.adjust). |
| Page: 1 2 3 4 5 6 7 8 9 |
| GO ID | Tissue | Disease Stage | Description | Gene Ratio | Bg Ratio | pvalue | p.adjust | Count |
| GO:0007178 | Colorectum | AD | transmembrane receptor protein serine/threonine kinase signaling pathway | 99/3918 | 355/18723 | 9.92e-04 | 9.28e-03 | 99 |
| GO:0071559 | Colorectum | AD | response to transforming growth factor beta | 74/3918 | 256/18723 | 1.45e-03 | 1.23e-02 | 74 |
| GO:0071560 | Colorectum | AD | cellular response to transforming growth factor beta stimulus | 72/3918 | 250/18723 | 1.85e-03 | 1.52e-02 | 72 |
| GO:0007179 | Colorectum | AD | transforming growth factor beta receptor signaling pathway | 59/3918 | 198/18723 | 1.94e-03 | 1.58e-02 | 59 |
| GO:0060395 | Colorectum | AD | SMAD protein signal transduction | 28/3918 | 82/18723 | 3.73e-03 | 2.63e-02 | 28 |
| GO:00715591 | Colorectum | FAP | response to transforming growth factor beta | 63/2622 | 256/18723 | 3.82e-06 | 1.32e-04 | 63 |
| GO:00071782 | Colorectum | FAP | transmembrane receptor protein serine/threonine kinase signaling pathway | 81/2622 | 355/18723 | 4.28e-06 | 1.46e-04 | 81 |
| GO:00715601 | Colorectum | FAP | cellular response to transforming growth factor beta stimulus | 61/2622 | 250/18723 | 7.22e-06 | 2.19e-04 | 61 |
| GO:00071791 | Colorectum | FAP | transforming growth factor beta receptor signaling pathway | 50/2622 | 198/18723 | 1.75e-05 | 4.44e-04 | 50 |
| GO:00603951 | Colorectum | FAP | SMAD protein signal transduction | 24/2622 | 82/18723 | 2.55e-04 | 3.51e-03 | 24 |
| GO:1901522 | Colorectum | FAP | positive regulation of transcription from RNA polymerase II promoter involved in cellular response to chemical stimulus | 9/2622 | 22/18723 | 1.81e-03 | 1.55e-02 | 9 |
| GO:0071772 | Colorectum | FAP | response to BMP | 37/2622 | 165/18723 | 2.20e-03 | 1.80e-02 | 37 |
| GO:0071773 | Colorectum | FAP | cellular response to BMP stimulus | 37/2622 | 165/18723 | 2.20e-03 | 1.80e-02 | 37 |
| GO:0030509 | Colorectum | FAP | BMP signaling pathway | 34/2622 | 152/18723 | 3.38e-03 | 2.47e-02 | 34 |
| GO:00715596 | Endometrium | AEH | response to transforming growth factor beta | 53/2100 | 256/18723 | 7.01e-06 | 1.69e-04 | 53 |
| GO:00071787 | Endometrium | AEH | transmembrane receptor protein serine/threonine kinase signaling pathway | 67/2100 | 355/18723 | 1.28e-05 | 2.80e-04 | 67 |
| GO:00715606 | Endometrium | AEH | cellular response to transforming growth factor beta stimulus | 51/2100 | 250/18723 | 1.59e-05 | 3.32e-04 | 51 |
| GO:00305092 | Endometrium | AEH | BMP signaling pathway | 32/2100 | 152/18723 | 3.15e-04 | 3.54e-03 | 32 |
| GO:00071796 | Endometrium | AEH | transforming growth factor beta receptor signaling pathway | 38/2100 | 198/18723 | 6.41e-04 | 6.23e-03 | 38 |
| GO:00717722 | Endometrium | AEH | response to BMP | 32/2100 | 165/18723 | 1.38e-03 | 1.16e-02 | 32 |
| Page: 1 2 3 |
| Pathway ID | Tissue | Disease Stage | Description | Gene Ratio | Bg Ratio | pvalue | p.adjust | qvalue | Count |
| hsa04350 | Colorectum | SER | TGF-beta signaling pathway | 31/1580 | 108/8465 | 7.00e-03 | 3.77e-02 | 2.74e-02 | 31 |
| hsa043501 | Colorectum | SER | TGF-beta signaling pathway | 31/1580 | 108/8465 | 7.00e-03 | 3.77e-02 | 2.74e-02 | 31 |
| hsa043504 | Endometrium | AEH | TGF-beta signaling pathway | 26/1197 | 108/8465 | 3.82e-03 | 2.18e-02 | 1.59e-02 | 26 |
| hsa0435011 | Endometrium | AEH | TGF-beta signaling pathway | 26/1197 | 108/8465 | 3.82e-03 | 2.18e-02 | 1.59e-02 | 26 |
| hsa043502 | Endometrium | EEC | TGF-beta signaling pathway | 26/1237 | 108/8465 | 5.95e-03 | 3.12e-02 | 2.33e-02 | 26 |
| hsa043503 | Endometrium | EEC | TGF-beta signaling pathway | 26/1237 | 108/8465 | 5.95e-03 | 3.12e-02 | 2.33e-02 | 26 |
| Page: 1 |
Top |
Cell-cell communication analysis |
| Identification of potential cell-cell interactions between two cell types and their ligand-receptor pairs for different disease states |
| Ligand | Receptor | LRpair | Pathway | Tissue | Disease Stage |
| Page: 1 |
Top |
Single-cell gene regulatory network inference analysis |
| Find out the significant the regulons (TFs) and the target genes of each regulon across cell types for different disease states |
| TF | Cell Type | Tissue | Disease Stage | Target Gene | RSS | Regulon Activity |
| SMAD9 | GC | Colorectum | ADJ | BMP7,BAD,MBD6, etc. | 2.01e-01 |  |
| SMAD9 | MSC | Esophagus | ESCC | C4B,TSPAN8,ZNF630, etc. | 2.70e-01 |  |
| SMAD9 | LUM | Prostate | Healthy | IL6ST,ODC1,TPD52, etc. | 3.16e-01 |  |
| ∗The dot plots of a searched regulon are shown for all cell subpopulations in each disease state of each tissue based on the regulon specific score inferred using pySCENIC and by calculating the average expression. |
| Page: 1 |
Top |
Somatic mutation of malignant transformation related genes |
| Annotation of somatic variants for genes involved in malignant transformation |
| Hugo Symbol | Variant Class | Variant Classification | dbSNP RS | HGVSc | HGVSp | HGVSp Short | SWISSPROT | BIOTYPE | SIFT | PolyPhen | Tumor Sample Barcode | Tissue | Histology | Sex | Age | Stage | Therapy Types | Drugs | Outcome |
| SMAD9 | SNV | Missense_Mutation | rs769199234 | c.250N>T | p.Arg84Cys | p.R84C | O15198 | protein_coding | deleterious(0) | probably_damaging(0.982) | TCGA-A7-A26F-01 | Breast | breast invasive carcinoma | Female | <65 | I/II | Chemotherapy | taxotere | SD |
| SMAD9 | SNV | Missense_Mutation | c.374G>A | p.Cys125Tyr | p.C125Y | O15198 | protein_coding | deleterious(0) | probably_damaging(0.999) | TCGA-AN-A0AK-01 | Breast | breast invasive carcinoma | Female | >=65 | I/II | Unknown | Unknown | SD | |
| SMAD9 | SNV | Missense_Mutation | c.49G>A | p.Ala17Thr | p.A17T | O15198 | protein_coding | tolerated(0.19) | benign(0.271) | TCGA-B6-A0WV-01 | Breast | breast invasive carcinoma | Female | >=65 | I/II | Unknown | Unknown | SD | |
| SMAD9 | SNV | Missense_Mutation | rs200651392 | c.482G>A | p.Arg161His | p.R161H | O15198 | protein_coding | tolerated(0.13) | benign(0.014) | TCGA-E2-A1BC-01 | Breast | breast invasive carcinoma | Female | <65 | I/II | Hormone Therapy | arimidex | SD |
| SMAD9 | insertion | Nonsense_Mutation | novel | c.531_532insATGCCTGCATCCTTTGAGTGAGGCAGAAAGTGAAGCC | p.Pro178MetfsTer7 | p.P178Mfs*7 | O15198 | protein_coding | TCGA-A8-A08H-01 | Breast | breast invasive carcinoma | Female | >=65 | I/II | Unknown | Unknown | SD | ||
| SMAD9 | SNV | Missense_Mutation | c.289N>T | p.Arg97Cys | p.R97C | O15198 | protein_coding | deleterious(0.01) | probably_damaging(0.93) | TCGA-AA-3662-01 | Colorectum | colon adenocarcinoma | Female | >=65 | III/IV | Chemotherapy | capecitabine | PR | |
| SMAD9 | SNV | Missense_Mutation | c.283N>A | p.Val95Met | p.V95M | O15198 | protein_coding | tolerated(0.09) | probably_damaging(0.995) | TCGA-AA-3845-01 | Colorectum | colon adenocarcinoma | Female | >=65 | I/II | Unknown | Unknown | PD | |
| SMAD9 | SNV | Missense_Mutation | rs148698551 | c.1171N>A | p.Ala391Thr | p.A391T | O15198 | protein_coding | deleterious(0.02) | benign(0.215) | TCGA-AA-A01R-01 | Colorectum | colon adenocarcinoma | Male | <65 | III/IV | Chemotherapy | 5-fluorouracil | PD |
| SMAD9 | SNV | Missense_Mutation | rs368154262 | c.824N>T | p.Ser275Leu | p.S275L | O15198 | protein_coding | deleterious(0.03) | possibly_damaging(0.58) | TCGA-CK-5916-01 | Colorectum | colon adenocarcinoma | Female | >=65 | I/II | Unknown | Unknown | PD |
| SMAD9 | SNV | Missense_Mutation | c.680C>A | p.Pro227Gln | p.P227Q | O15198 | protein_coding | deleterious(0.02) | possibly_damaging(0.628) | TCGA-DM-A1D8-01 | Colorectum | colon adenocarcinoma | Female | <65 | III/IV | Unknown | Unknown | SD |
| Page: 1 2 3 4 5 6 |
Top |
Related drugs of malignant transformation related genes |
| Identification of chemicals and drugs interact with genes involved in malignant transfromation |
| (DGIdb 4.0) |
| Entrez ID | Symbol | Category | Interaction Types | Drug Claim Name | Drug Name | PMIDs |
| Page: 1 |

Copyright 2023-Present -The University of Texas Health Science Center at Houston |