
|
|||||
|
 | |
| |
| |
| |
| |
| |
|
Gene: SMAD5 |
Gene summary for SMAD5 |
| Gene information | Species | Human | Gene symbol | SMAD5 | Gene ID | 4090 |
| Gene name | SMAD family member 5 | |
| Gene Alias | DWFC | |
| Cytomap | 5q31.1 | |
| Gene Type | protein-coding | GO ID | GO:0000003 | UniProtAcc | Q68DB7 |
Top |
Malignant transformation analysis |
| Identification of the aberrant gene expression in precancerous and cancerous lesions by comparing the gene expression of stem-like cells in diseased tissues with normal stem cells |
| Entrez ID | Symbol | Replicates | Species | Organ | Tissue | Adj P-value | Log2FC | Malignancy |
| 4090 | SMAD5 | LZE4T | Human | Esophagus | ESCC | 6.08e-22 | 6.27e-01 | 0.0811 |
| 4090 | SMAD5 | LZE5T | Human | Esophagus | ESCC | 1.80e-04 | 3.17e-01 | 0.0514 |
| 4090 | SMAD5 | LZE7T | Human | Esophagus | ESCC | 1.13e-04 | 3.07e-01 | 0.0667 |
| 4090 | SMAD5 | LZE20T | Human | Esophagus | ESCC | 4.53e-06 | 2.08e-01 | 0.0662 |
| 4090 | SMAD5 | LZE21D1 | Human | Esophagus | HGIN | 3.68e-03 | 2.70e-01 | 0.0632 |
| 4090 | SMAD5 | LZE24T | Human | Esophagus | ESCC | 1.61e-16 | 6.96e-01 | 0.0596 |
| 4090 | SMAD5 | P1T-E | Human | Esophagus | ESCC | 6.11e-10 | 4.32e-01 | 0.0875 |
| 4090 | SMAD5 | P2T-E | Human | Esophagus | ESCC | 1.30e-60 | 1.03e+00 | 0.1177 |
| 4090 | SMAD5 | P4T-E | Human | Esophagus | ESCC | 2.19e-37 | 9.06e-01 | 0.1323 |
| 4090 | SMAD5 | P5T-E | Human | Esophagus | ESCC | 2.20e-17 | 3.25e-01 | 0.1327 |
| 4090 | SMAD5 | P8T-E | Human | Esophagus | ESCC | 1.81e-22 | 3.79e-01 | 0.0889 |
| 4090 | SMAD5 | P9T-E | Human | Esophagus | ESCC | 2.11e-17 | 3.92e-01 | 0.1131 |
| 4090 | SMAD5 | P10T-E | Human | Esophagus | ESCC | 2.37e-41 | 8.23e-01 | 0.116 |
| 4090 | SMAD5 | P11T-E | Human | Esophagus | ESCC | 2.07e-14 | 4.73e-01 | 0.1426 |
| 4090 | SMAD5 | P12T-E | Human | Esophagus | ESCC | 5.24e-62 | 1.33e+00 | 0.1122 |
| 4090 | SMAD5 | P15T-E | Human | Esophagus | ESCC | 2.12e-30 | 7.90e-01 | 0.1149 |
| 4090 | SMAD5 | P16T-E | Human | Esophagus | ESCC | 2.44e-34 | 6.21e-01 | 0.1153 |
| 4090 | SMAD5 | P17T-E | Human | Esophagus | ESCC | 3.81e-04 | 3.85e-01 | 0.1278 |
| 4090 | SMAD5 | P19T-E | Human | Esophagus | ESCC | 2.27e-05 | 5.49e-01 | 0.1662 |
| 4090 | SMAD5 | P20T-E | Human | Esophagus | ESCC | 5.25e-40 | 8.76e-01 | 0.1124 |
| Page: 1 2 3 4 5 6 7 |
| Tissue | Expression Dynamics | Abbreviation |
| Esophagus | 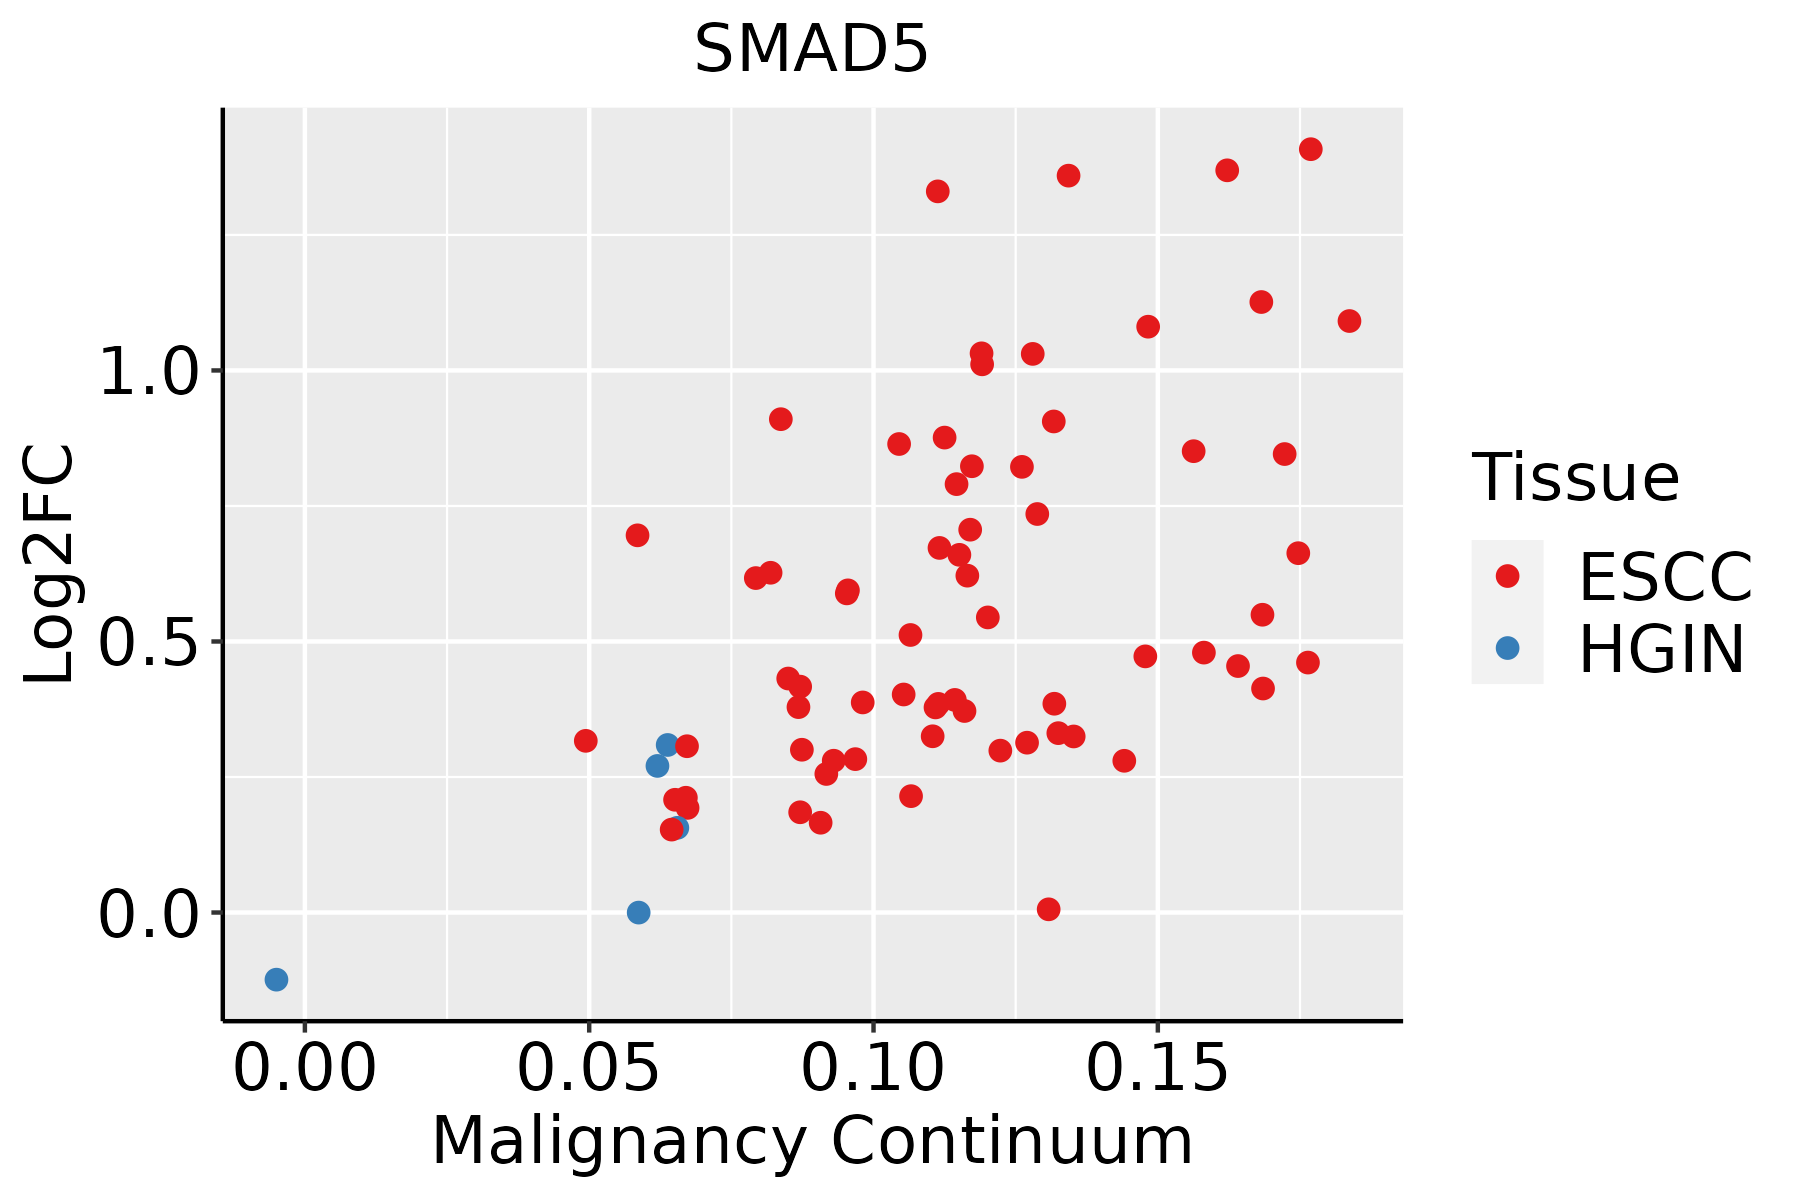 | ESCC: Esophageal squamous cell carcinoma |
| HGIN: High-grade intraepithelial neoplasias | ||
| LGIN: Low-grade intraepithelial neoplasias | ||
| Liver | 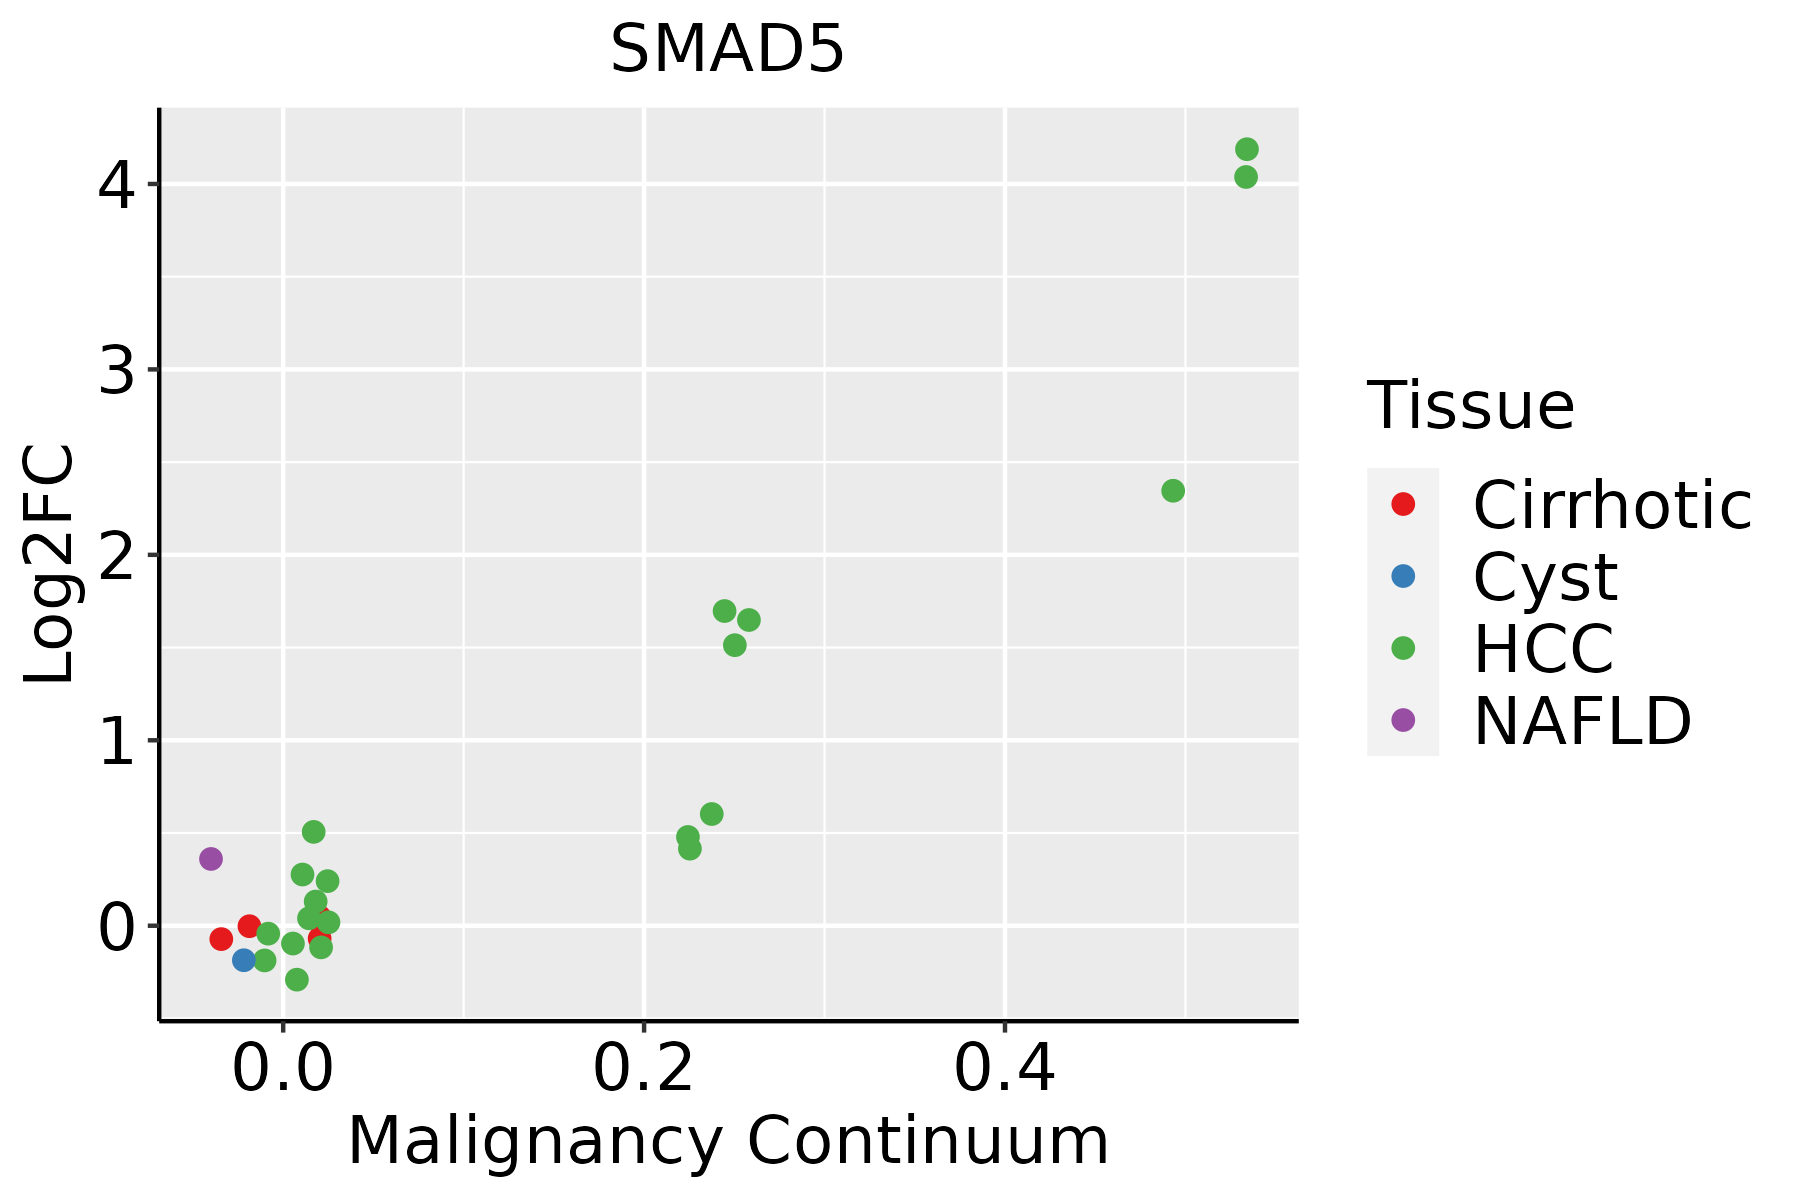 | HCC: Hepatocellular carcinoma |
| NAFLD: Non-alcoholic fatty liver disease | ||
| Oral Cavity | 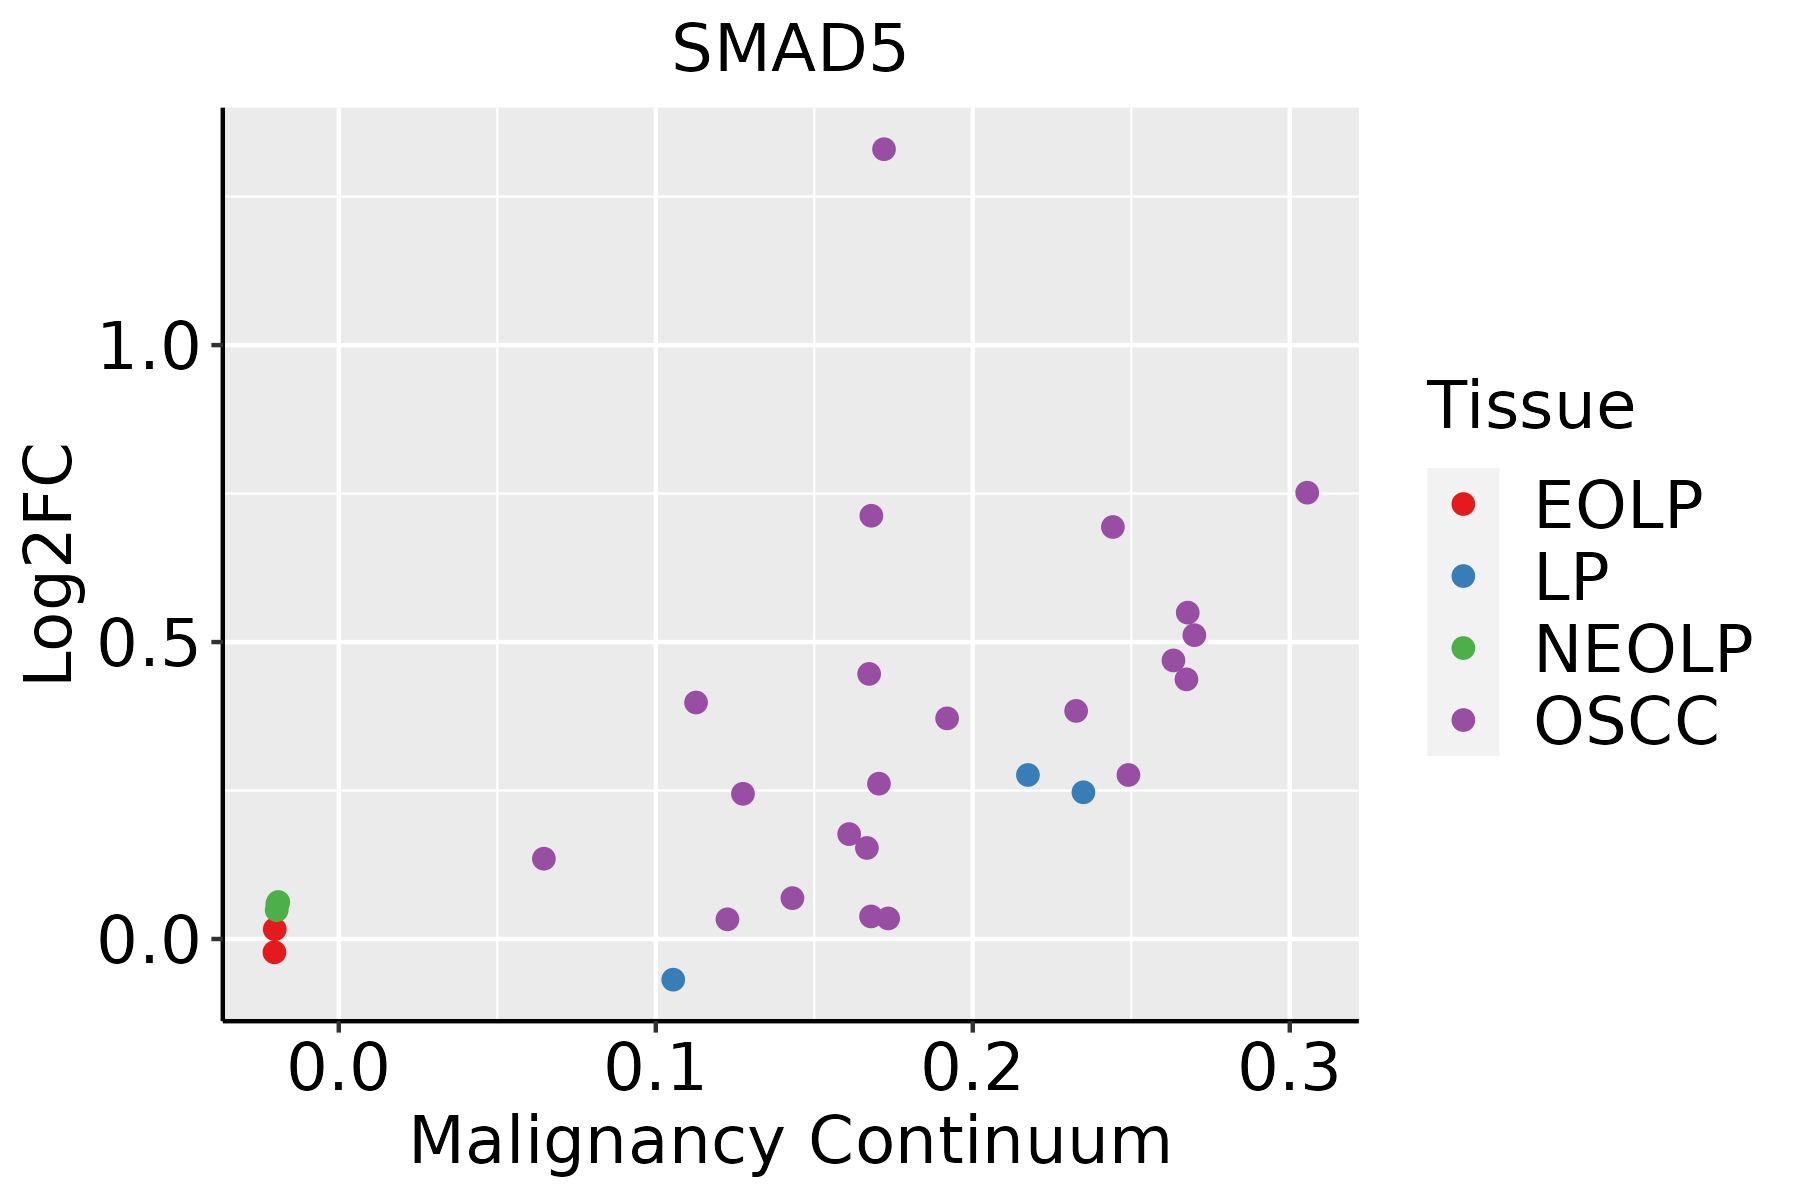 | EOLP: Erosive Oral lichen planus |
| LP: leukoplakia | ||
| NEOLP: Non-erosive oral lichen planus | ||
| OSCC: Oral squamous cell carcinoma | ||
| Prostate | 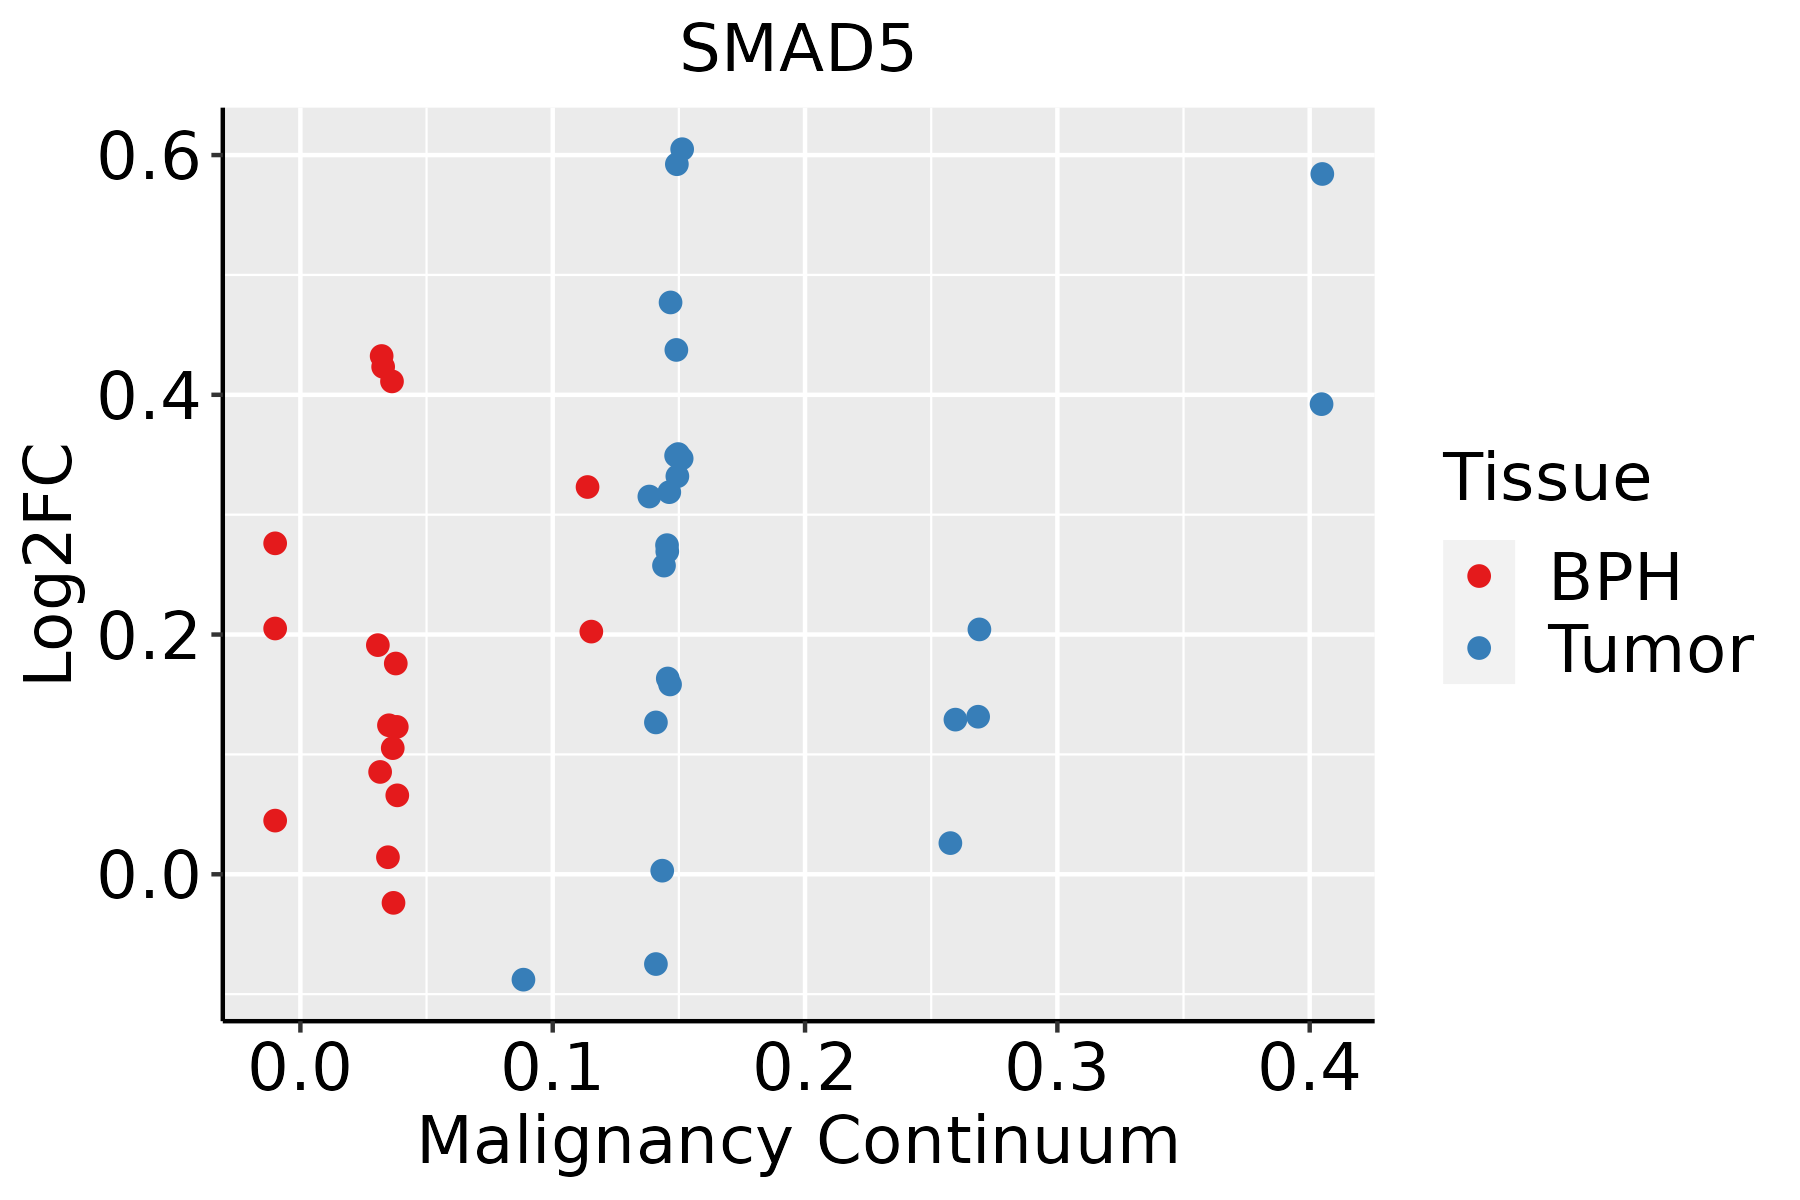 | BPH: Benign Prostatic Hyperplasia |
| Skin | 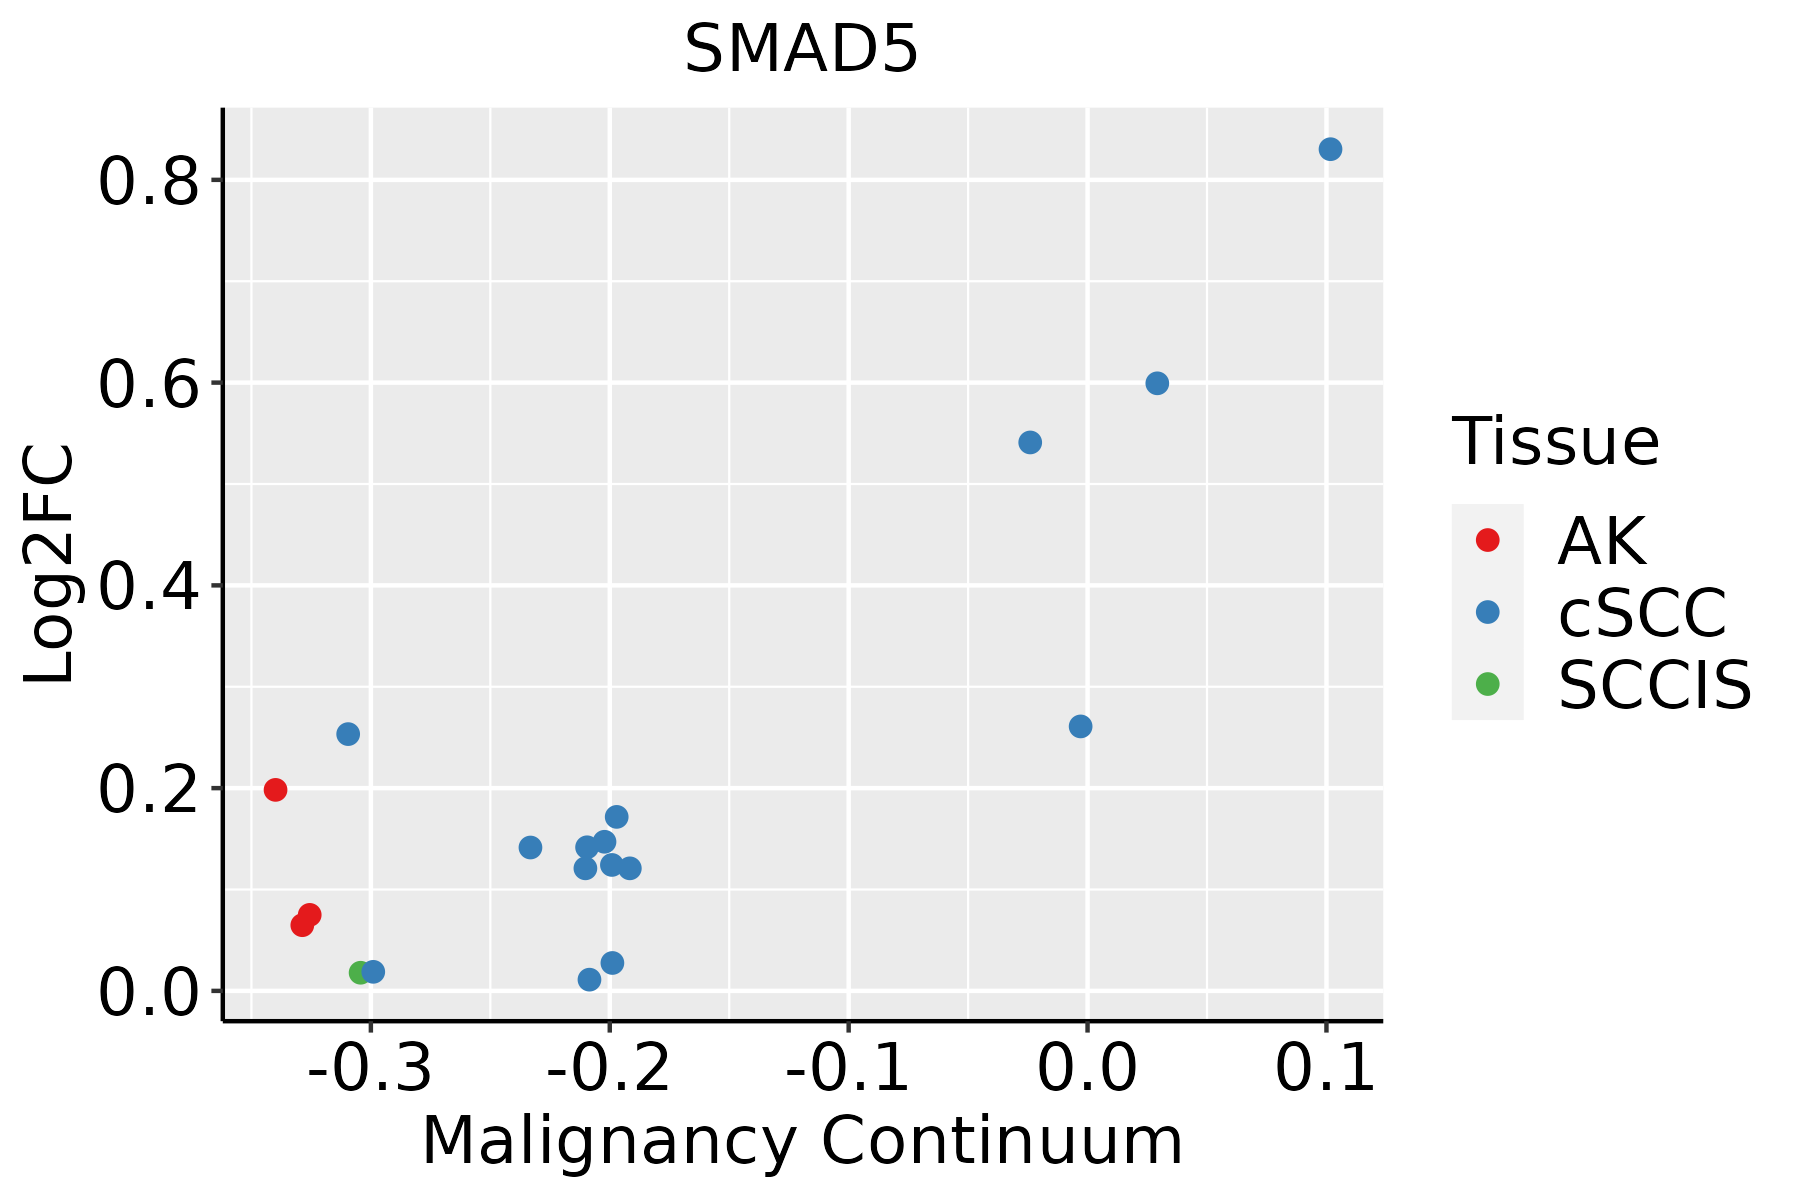 | AK: Actinic keratosis |
| cSCC: Cutaneous squamous cell carcinoma | ||
| SCCIS:squamous cell carcinoma in situ | ||
| Thyroid | 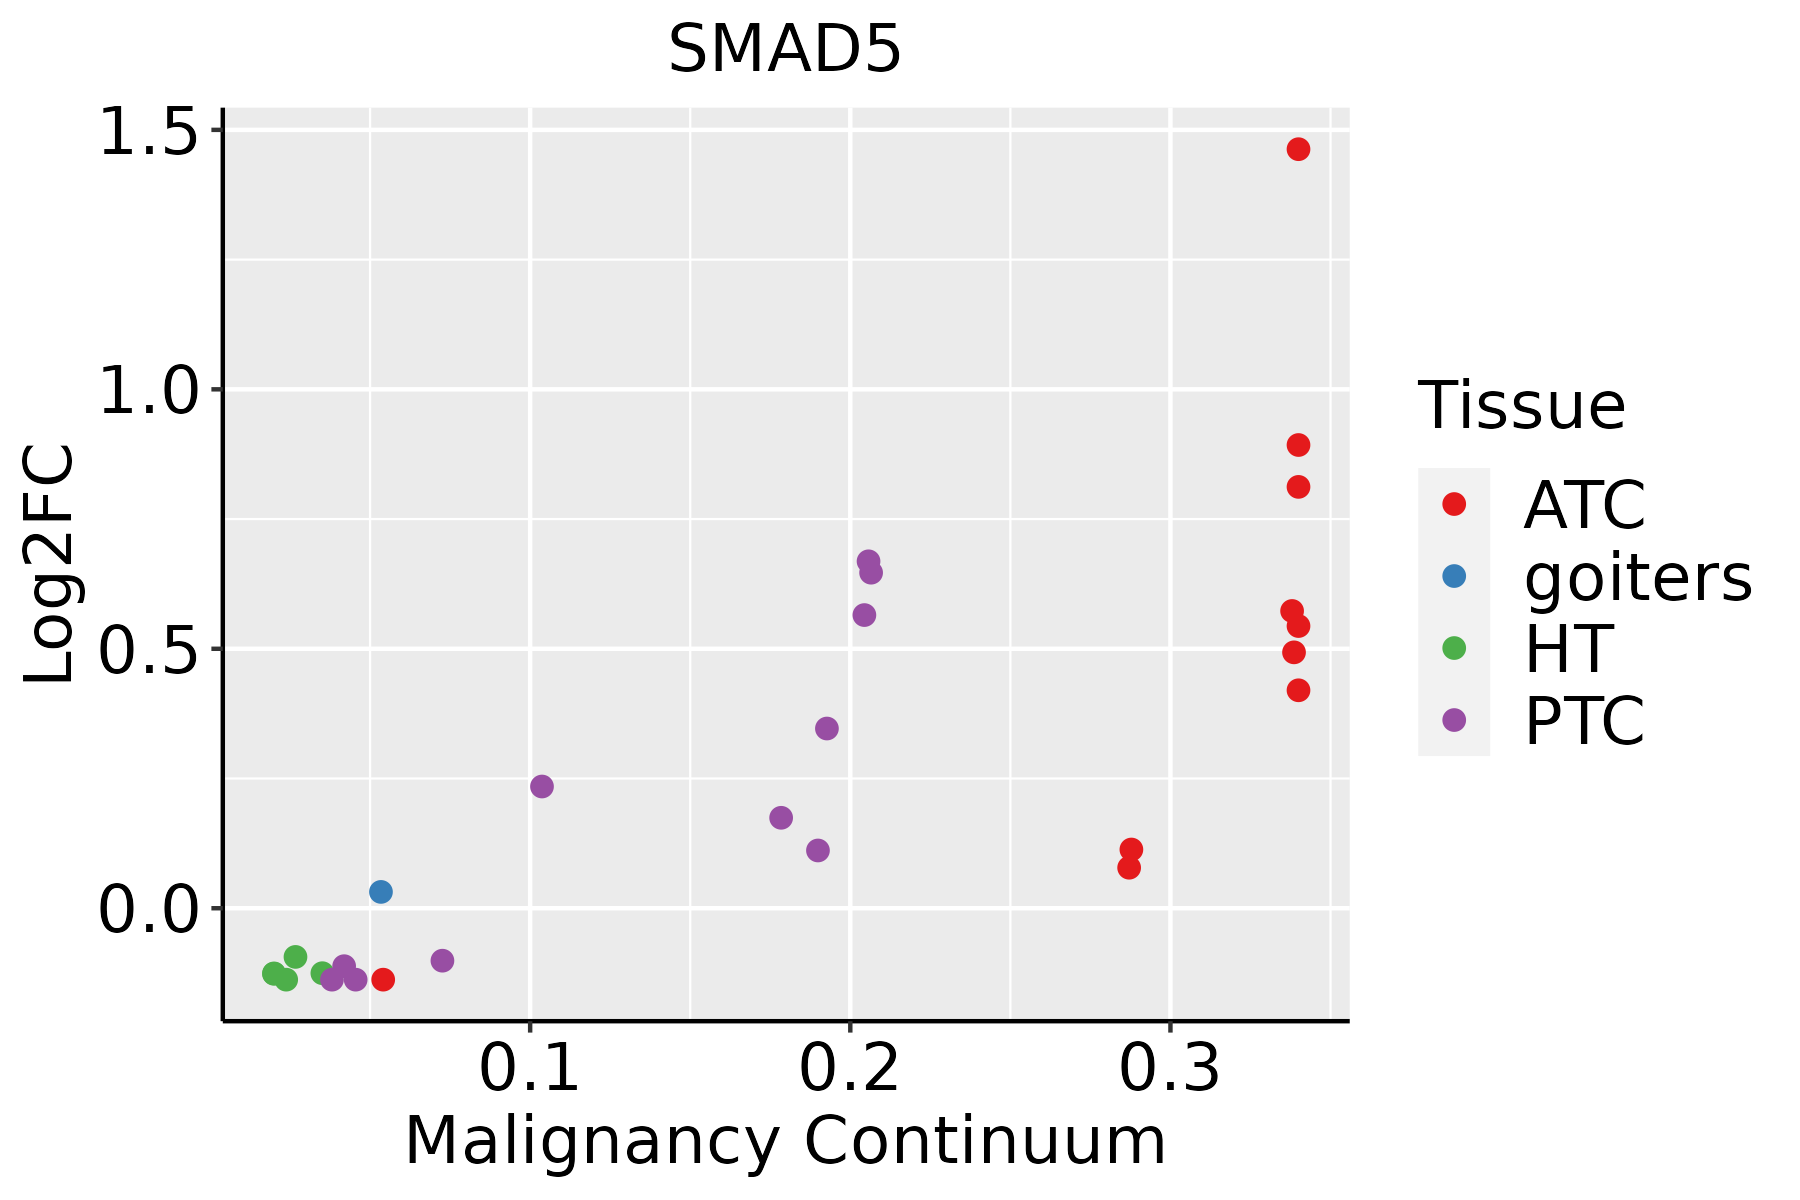 | ATC: Anaplastic thyroid cancer |
| HT: Hashimoto's thyroiditis | ||
| PTC: Papillary thyroid cancer |
| ∗log2FC in expression of this searched gene in stem-like cells from each diseased tissue sample relative to stem-like cells in normal samples in each tissue plotted against the malignancy continuum. Samples are colored based on if they are from different disease stage. |
Top |
Malignant transformation related pathway analysis |
| Find out the enriched GO biological processes and KEGG pathways involved in transition from healthy to precancer to cancer |
| Tissue | Disease Stage | Enriched GO biological Processes |
| Colorectum | AD |  |
| Colorectum | SER |  |
| Colorectum | MSS |  |
| Colorectum | MSI-H |  |
| Colorectum | FAP |  |
| ∗Top 15 enriched GO BP terms are showed in the bar plot of each disease state in each tissue. Each row represents a significant GO biological process which is colored according to the -log10(p.adjust). |
| Page: 1 2 3 4 5 6 7 8 9 |
| GO ID | Tissue | Disease Stage | Description | Gene Ratio | Bg Ratio | pvalue | p.adjust | Count |
| GO:003009927 | Esophagus | HGIN | myeloid cell differentiation | 83/2587 | 381/18723 | 1.26e-05 | 3.52e-04 | 83 |
| GO:003410127 | Esophagus | HGIN | erythrocyte homeostasis | 34/2587 | 129/18723 | 1.16e-04 | 2.43e-03 | 34 |
| GO:003021826 | Esophagus | HGIN | erythrocyte differentiation | 31/2587 | 120/18723 | 3.35e-04 | 5.50e-03 | 31 |
| GO:000164917 | Esophagus | HGIN | osteoblast differentiation | 50/2587 | 229/18723 | 5.88e-04 | 8.30e-03 | 50 |
| GO:000226227 | Esophagus | HGIN | myeloid cell homeostasis | 37/2587 | 157/18723 | 6.63e-04 | 9.04e-03 | 37 |
| GO:00605379 | Esophagus | HGIN | muscle tissue development | 76/2587 | 403/18723 | 2.67e-03 | 2.63e-02 | 76 |
| GO:004887227 | Esophagus | HGIN | homeostasis of number of cells | 54/2587 | 272/18723 | 3.50e-03 | 3.23e-02 | 54 |
| GO:00147068 | Esophagus | HGIN | striated muscle tissue development | 72/2587 | 384/18723 | 3.94e-03 | 3.56e-02 | 72 |
| GO:000150316 | Esophagus | HGIN | ossification | 75/2587 | 408/18723 | 5.49e-03 | 4.49e-02 | 75 |
| GO:0030099111 | Esophagus | ESCC | myeloid cell differentiation | 232/8552 | 381/18723 | 1.22e-09 | 2.90e-08 | 232 |
| GO:0002262111 | Esophagus | ESCC | myeloid cell homeostasis | 104/8552 | 157/18723 | 1.49e-07 | 2.36e-06 | 104 |
| GO:0034101111 | Esophagus | ESCC | erythrocyte homeostasis | 88/8552 | 129/18723 | 1.81e-07 | 2.84e-06 | 88 |
| GO:00715599 | Esophagus | ESCC | response to transforming growth factor beta | 157/8552 | 256/18723 | 2.95e-07 | 4.23e-06 | 157 |
| GO:0048872111 | Esophagus | ESCC | homeostasis of number of cells | 163/8552 | 272/18723 | 1.40e-06 | 1.69e-05 | 163 |
| GO:000164918 | Esophagus | ESCC | osteoblast differentiation | 140/8552 | 229/18723 | 1.63e-06 | 1.95e-05 | 140 |
| GO:00715609 | Esophagus | ESCC | cellular response to transforming growth factor beta stimulus | 151/8552 | 250/18723 | 1.78e-06 | 2.10e-05 | 151 |
| GO:0030218111 | Esophagus | ESCC | erythrocyte differentiation | 80/8552 | 120/18723 | 2.69e-06 | 3.08e-05 | 80 |
| GO:000150317 | Esophagus | ESCC | ossification | 232/8552 | 408/18723 | 3.00e-06 | 3.40e-05 | 232 |
| GO:00071799 | Esophagus | ESCC | transforming growth factor beta receptor signaling pathway | 121/8552 | 198/18723 | 8.26e-06 | 8.03e-05 | 121 |
| GO:000717810 | Esophagus | ESCC | transmembrane receptor protein serine/threonine kinase signaling pathway | 195/8552 | 355/18723 | 2.58e-04 | 1.58e-03 | 195 |
| Page: 1 2 3 4 5 6 7 8 9 10 11 |
| Pathway ID | Tissue | Disease Stage | Description | Gene Ratio | Bg Ratio | pvalue | p.adjust | qvalue | Count |
| hsa043507 | Esophagus | ESCC | TGF-beta signaling pathway | 69/4205 | 108/8465 | 1.92e-03 | 5.54e-03 | 2.84e-03 | 69 |
| hsa0435014 | Esophagus | ESCC | TGF-beta signaling pathway | 69/4205 | 108/8465 | 1.92e-03 | 5.54e-03 | 2.84e-03 | 69 |
| hsa043506 | Oral cavity | OSCC | TGF-beta signaling pathway | 60/3704 | 108/8465 | 8.66e-03 | 1.97e-02 | 1.00e-02 | 60 |
| hsa0435013 | Oral cavity | OSCC | TGF-beta signaling pathway | 60/3704 | 108/8465 | 8.66e-03 | 1.97e-02 | 1.00e-02 | 60 |
| hsa043505 | Prostate | BPH | TGF-beta signaling pathway | 35/1718 | 108/8465 | 1.98e-03 | 7.92e-03 | 4.90e-03 | 35 |
| hsa0435012 | Prostate | BPH | TGF-beta signaling pathway | 35/1718 | 108/8465 | 1.98e-03 | 7.92e-03 | 4.90e-03 | 35 |
| hsa0435021 | Prostate | Tumor | TGF-beta signaling pathway | 39/1791 | 108/8465 | 2.33e-04 | 1.35e-03 | 8.39e-04 | 39 |
| hsa0435031 | Prostate | Tumor | TGF-beta signaling pathway | 39/1791 | 108/8465 | 2.33e-04 | 1.35e-03 | 8.39e-04 | 39 |
| Page: 1 |
Top |
Cell-cell communication analysis |
| Identification of potential cell-cell interactions between two cell types and their ligand-receptor pairs for different disease states |
| Ligand | Receptor | LRpair | Pathway | Tissue | Disease Stage |
| Page: 1 |
Top |
Single-cell gene regulatory network inference analysis |
| Find out the significant the regulons (TFs) and the target genes of each regulon across cell types for different disease states |
| TF | Cell Type | Tissue | Disease Stage | Target Gene | RSS | Regulon Activity |
| SMAD5 | SMC | Esophagus | Healthy | RUNX3,DNAH1,STAT4, etc. | 5.56e-02 |  |
| SMAD5 | CAF | Liver | Cirrhotic | TNFAIP8,PLA2G4C,CACHD1, etc. | 2.91e-02 |  |
| SMAD5 | AT1 | Lung | ADJ | PEX3,KIAA0408,MDP1, etc. | 2.26e-01 |  |
| SMAD5 | MVA | Skin | Healthy | STARD7,CEP295,CACNB3, etc. | 1.38e-02 |  |
| SMAD5 | SMC | Skin | SCCIS | STARD7,CEP295,CACNB3, etc. | 6.15e-03 |  |
| ∗The dot plots of a searched regulon are shown for all cell subpopulations in each disease state of each tissue based on the regulon specific score inferred using pySCENIC and by calculating the average expression. |
| Page: 1 |
Top |
Somatic mutation of malignant transformation related genes |
| Annotation of somatic variants for genes involved in malignant transformation |
| Hugo Symbol | Variant Class | Variant Classification | dbSNP RS | HGVSc | HGVSp | HGVSp Short | SWISSPROT | BIOTYPE | SIFT | PolyPhen | Tumor Sample Barcode | Tissue | Histology | Sex | Age | Stage | Therapy Types | Drugs | Outcome |
| SMAD5 | SNV | Missense_Mutation | c.1394N>T | p.Ser465Leu | p.S465L | Q99717 | protein_coding | deleterious(0) | probably_damaging(0.99) | TCGA-IR-A3LH-01 | Cervix | cervical & endocervical cancer | Female | <65 | I/II | Chemotherapy | cisplatin | CR | |
| SMAD5 | SNV | Missense_Mutation | novel | c.396N>C | p.Glu132Asp | p.E132D | Q99717 | protein_coding | deleterious(0.04) | benign(0.311) | TCGA-IR-A3LK-01 | Cervix | cervical & endocervical cancer | Female | >=65 | I/II | Chemotherapy | cisplatin | PD |
| SMAD5 | SNV | Missense_Mutation | novel | c.1367N>G | p.Ser456Cys | p.S456C | Q99717 | protein_coding | deleterious(0) | benign(0.443) | TCGA-VS-A9UZ-01 | Cervix | cervical & endocervical cancer | Female | <65 | I/II | Unknown | Unknown | SD |
| SMAD5 | SNV | Missense_Mutation | novel | c.224G>A | p.Arg75His | p.R75H | Q99717 | protein_coding | deleterious(0) | probably_damaging(1) | TCGA-AA-3950-01 | Colorectum | colon adenocarcinoma | Female | >=65 | I/II | Unknown | Unknown | SD |
| SMAD5 | SNV | Missense_Mutation | c.853G>A | p.Glu285Lys | p.E285K | Q99717 | protein_coding | deleterious(0.03) | possibly_damaging(0.602) | TCGA-CA-6718-01 | Colorectum | colon adenocarcinoma | Male | <65 | I/II | Unknown | Unknown | PD | |
| SMAD5 | SNV | Missense_Mutation | novel | c.692A>T | p.Asp231Val | p.D231V | Q99717 | protein_coding | tolerated(0.25) | benign(0.027) | TCGA-CK-4951-01 | Colorectum | colon adenocarcinoma | Female | >=65 | I/II | Unknown | Unknown | PD |
| SMAD5 | SNV | Missense_Mutation | c.328N>C | p.Cys110Arg | p.C110R | Q99717 | protein_coding | deleterious(0) | probably_damaging(1) | TCGA-CM-6674-01 | Colorectum | colon adenocarcinoma | Male | <65 | I/II | Unknown | Unknown | SD | |
| SMAD5 | SNV | Missense_Mutation | novel | c.77A>G | p.Glu26Gly | p.E26G | Q99717 | protein_coding | tolerated(0.07) | probably_damaging(0.992) | TCGA-AG-A002-01 | Colorectum | rectum adenocarcinoma | Male | <65 | I/II | Unknown | Unknown | SD |
| SMAD5 | SNV | Missense_Mutation | c.1171N>A | p.Leu391Ile | p.L391I | Q99717 | protein_coding | tolerated(0.06) | benign(0.115) | TCGA-EI-6513-01 | Colorectum | rectum adenocarcinoma | Male | <65 | III/IV | Unknown | Unknown | SD | |
| SMAD5 | SNV | Missense_Mutation | c.356N>G | p.Lys119Arg | p.K119R | Q99717 | protein_coding | deleterious(0.03) | possibly_damaging(0.906) | TCGA-F5-6813-01 | Colorectum | rectum adenocarcinoma | Male | >=65 | III/IV | Unknown | Unknown | PD |
| Page: 1 2 3 4 5 |
Top |
Related drugs of malignant transformation related genes |
| Identification of chemicals and drugs interact with genes involved in malignant transfromation |
| (DGIdb 4.0) |
| Entrez ID | Symbol | Category | Interaction Types | Drug Claim Name | Drug Name | PMIDs |
| Page: 1 |

Copyright 2023-Present -The University of Texas Health Science Center at Houston |