
|
|||||
|
 | |
| |
| |
| |
| |
| |
|
Gene: SMAD4 |
Gene summary for SMAD4 |
| Gene information | Species | Human | Gene symbol | SMAD4 | Gene ID | 4089 |
| Gene name | SMAD family member 4 | |
| Gene Alias | DPC4 | |
| Cytomap | 18q21.2 | |
| Gene Type | protein-coding | GO ID | GO:0000003 | UniProtAcc | A0A024R274 |
Top |
Malignant transformation analysis |
| Identification of the aberrant gene expression in precancerous and cancerous lesions by comparing the gene expression of stem-like cells in diseased tissues with normal stem cells |
| Entrez ID | Symbol | Replicates | Species | Organ | Tissue | Adj P-value | Log2FC | Malignancy |
| 4089 | SMAD4 | HCC1_Meng | Human | Liver | HCC | 4.80e-56 | 5.74e-02 | 0.0246 |
| 4089 | SMAD4 | HCC2_Meng | Human | Liver | HCC | 4.12e-11 | 2.45e-02 | 0.0107 |
| 4089 | SMAD4 | HCC1 | Human | Liver | HCC | 4.37e-02 | 2.62e+00 | 0.5336 |
| 4089 | SMAD4 | HCC2 | Human | Liver | HCC | 1.13e-14 | 3.38e+00 | 0.5341 |
| 4089 | SMAD4 | Pt13.b | Human | Liver | HCC | 1.50e-04 | 4.96e-02 | 0.0251 |
| 4089 | SMAD4 | S028 | Human | Liver | HCC | 1.19e-10 | 6.69e-01 | 0.2503 |
| 4089 | SMAD4 | S029 | Human | Liver | HCC | 3.58e-04 | 4.31e-01 | 0.2581 |
| 4089 | SMAD4 | GSM5252132_BPH389PrGF | Human | Prostate | BPH | 9.68e-04 | 2.77e-01 | -0.2247 |
| 4089 | SMAD4 | 048752_1579-all-cells | Human | Prostate | BPH | 1.87e-10 | 3.34e-01 | 0.1008 |
| 4089 | SMAD4 | 052095_1628-all-cells | Human | Prostate | BPH | 4.23e-13 | 3.50e-01 | 0.1032 |
| 4089 | SMAD4 | 052097_1595-all-cells | Human | Prostate | BPH | 9.47e-22 | 4.51e-01 | 0.0972 |
| 4089 | SMAD4 | 052099_1652-all-cells | Human | Prostate | BPH | 7.28e-13 | 3.61e-01 | 0.1038 |
| 4089 | SMAD4 | Dong_P1 | Human | Prostate | Tumor | 1.76e-15 | 1.23e-01 | 0.035 |
| 4089 | SMAD4 | Dong_P3 | Human | Prostate | Tumor | 1.25e-17 | 1.96e-01 | 0.0278 |
| 4089 | SMAD4 | Dong_P5 | Human | Prostate | Tumor | 7.90e-09 | -5.35e-02 | 0.053 |
| 4089 | SMAD4 | GSM5353221_PA_PB2A_Pool_1_3_S25_L001 | Human | Prostate | Tumor | 8.76e-08 | 5.48e-01 | 0.1633 |
| 4089 | SMAD4 | GSM5353224_PA_PR5186_Pool_1_2_3_S27_L001 | Human | Prostate | Tumor | 7.32e-05 | 4.19e-01 | 0.1621 |
| 4089 | SMAD4 | GSM5353227_PA_PR5199-193K_Pool_1_2_3_S55_L002 | Human | Prostate | Tumor | 4.15e-03 | 4.19e-01 | 0.1602 |
| 4089 | SMAD4 | GSM5353237_PA_PR5251_T2_S8_L001 | Human | Prostate | Tumor | 2.27e-04 | 6.56e-01 | 0.1622 |
| 4089 | SMAD4 | Adj_PTCwithHT_6 | Human | Thyroid | HT | 2.29e-02 | -1.92e-01 | 0.02 |
| Page: 1 2 |
| Tissue | Expression Dynamics | Abbreviation |
| Liver | 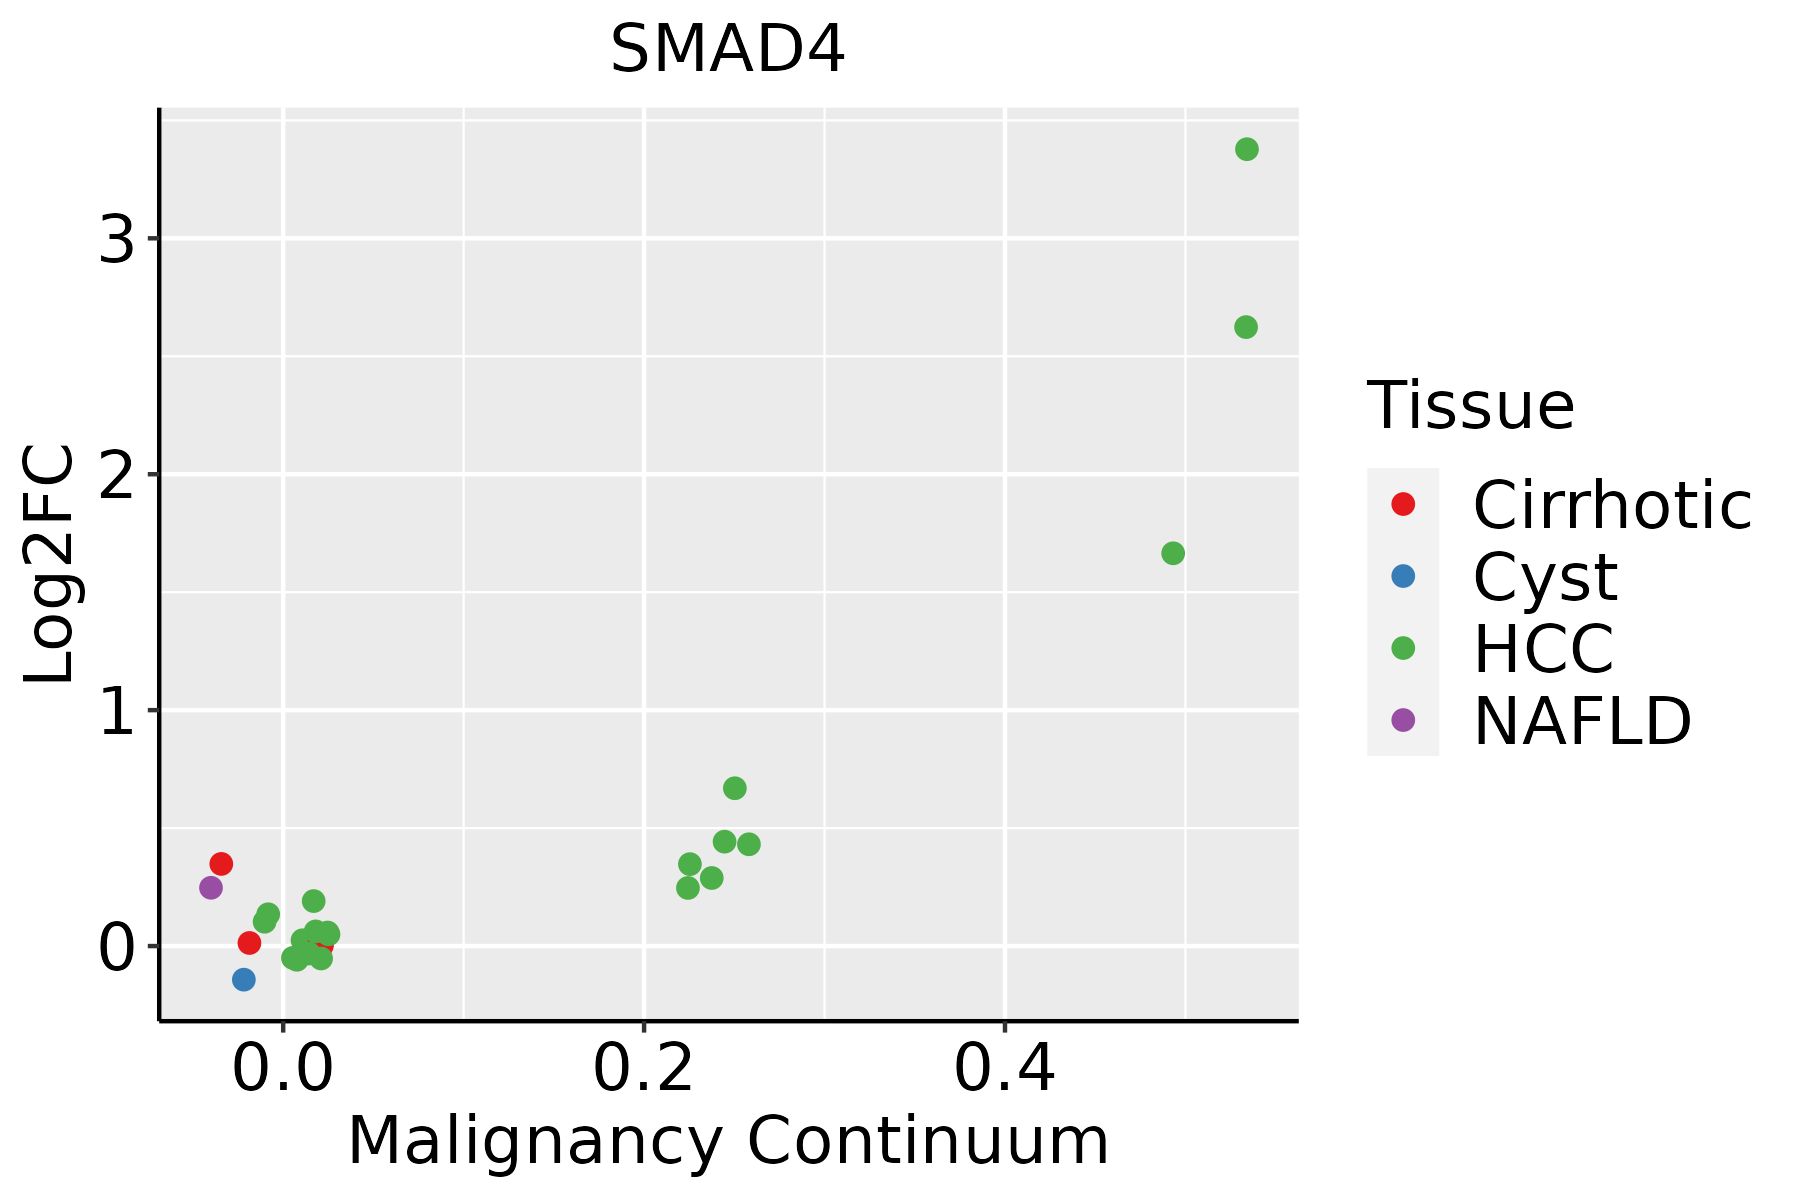 | HCC: Hepatocellular carcinoma |
| NAFLD: Non-alcoholic fatty liver disease | ||
| Prostate | 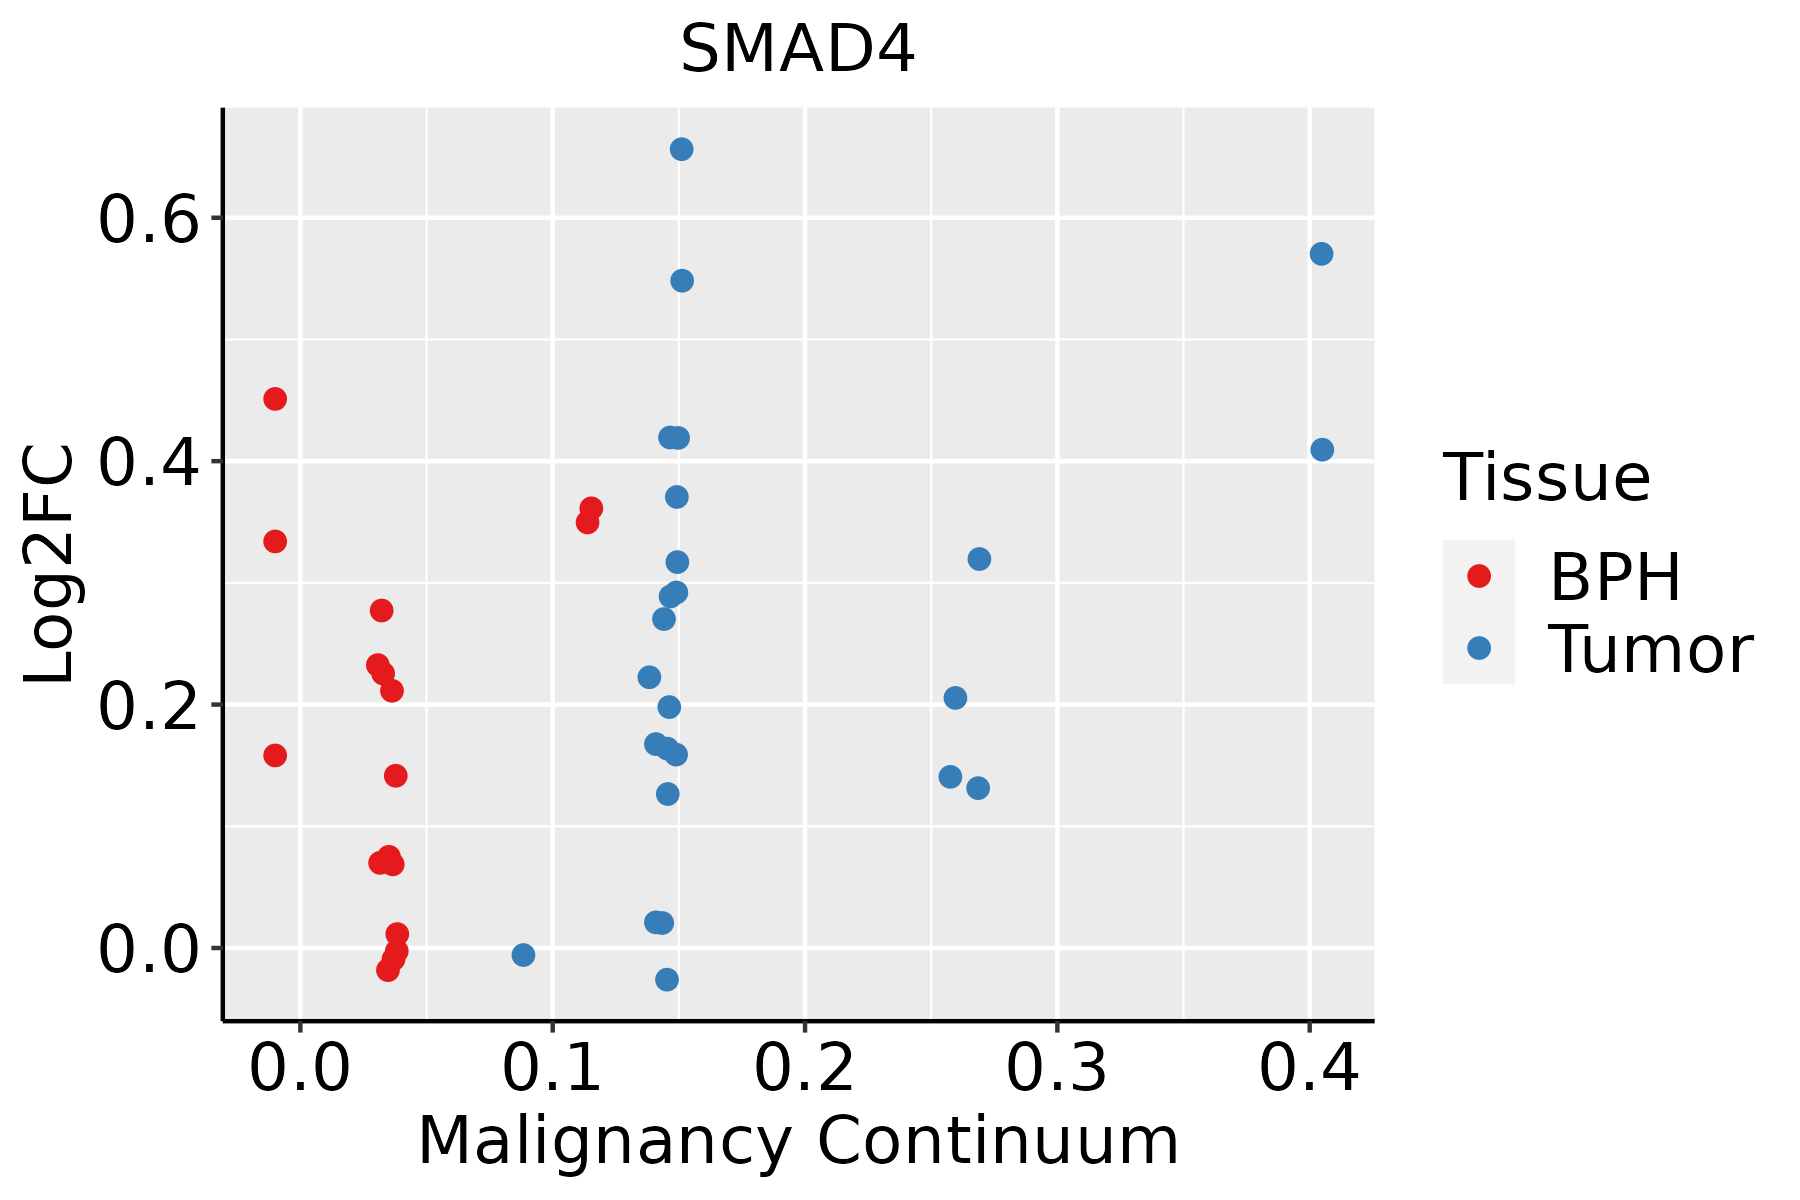 | BPH: Benign Prostatic Hyperplasia |
| Thyroid | 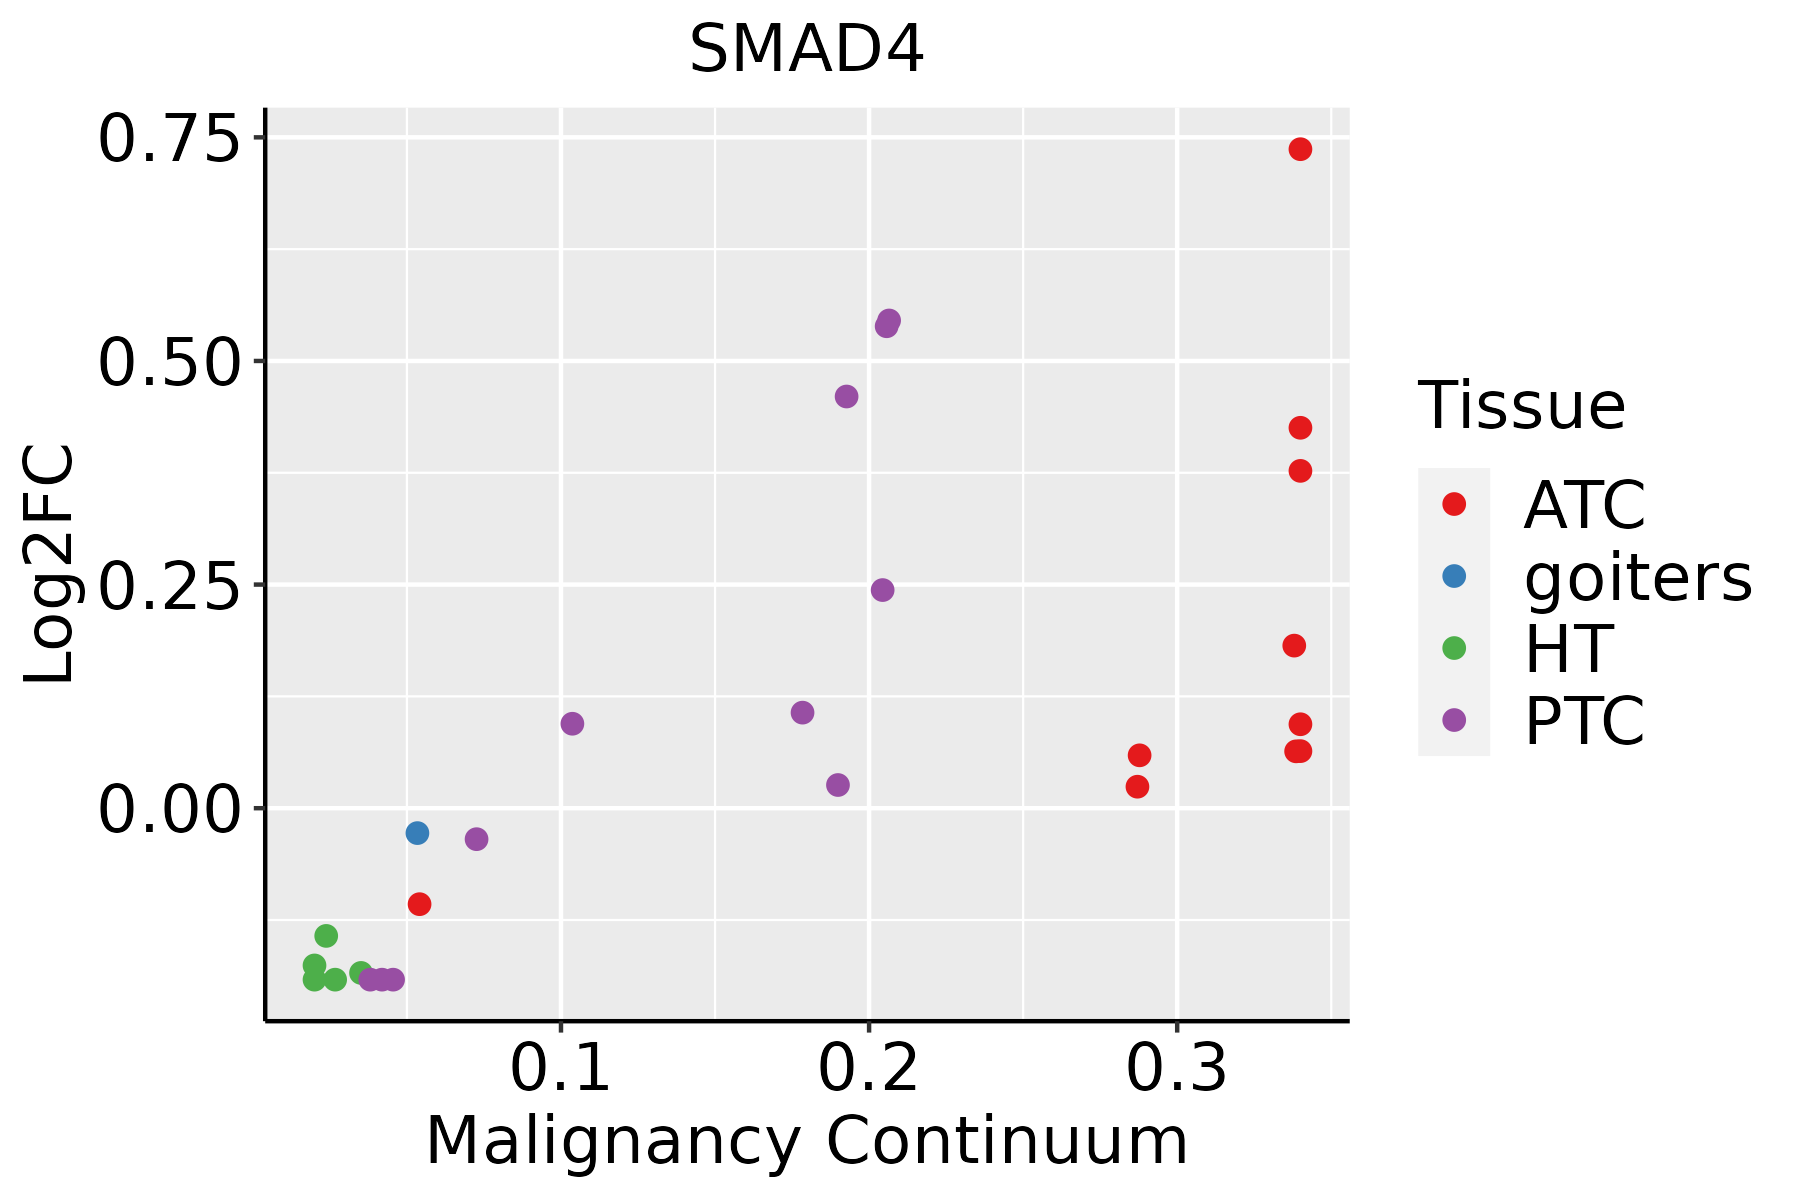 | ATC: Anaplastic thyroid cancer |
| HT: Hashimoto's thyroiditis | ||
| PTC: Papillary thyroid cancer |
| ∗log2FC in expression of this searched gene in stem-like cells from each diseased tissue sample relative to stem-like cells in normal samples in each tissue plotted against the malignancy continuum. Samples are colored based on if they are from different disease stage. |
Top |
Malignant transformation related pathway analysis |
| Find out the enriched GO biological processes and KEGG pathways involved in transition from healthy to precancer to cancer |
| Tissue | Disease Stage | Enriched GO biological Processes |
| Colorectum | AD |  |
| Colorectum | SER |  |
| Colorectum | MSS |  |
| Colorectum | MSI-H |  |
| Colorectum | FAP |  |
| ∗Top 15 enriched GO BP terms are showed in the bar plot of each disease state in each tissue. Each row represents a significant GO biological process which is colored according to the -log10(p.adjust). |
| Page: 1 2 3 4 5 6 7 8 9 |
| GO ID | Tissue | Disease Stage | Description | Gene Ratio | Bg Ratio | pvalue | p.adjust | Count |
| GO:001657021 | Liver | HCC | histone modification | 283/7958 | 463/18723 | 2.68e-16 | 2.33e-14 | 283 |
| GO:005109822 | Liver | HCC | regulation of binding | 225/7958 | 363/18723 | 3.78e-14 | 2.37e-12 | 225 |
| GO:00182052 | Liver | HCC | peptidyl-lysine modification | 230/7958 | 376/18723 | 1.51e-13 | 8.32e-12 | 230 |
| GO:00064732 | Liver | HCC | protein acetylation | 135/7958 | 201/18723 | 1.20e-12 | 5.92e-11 | 135 |
| GO:00435432 | Liver | HCC | protein acylation | 157/7958 | 243/18723 | 2.40e-12 | 1.12e-10 | 157 |
| GO:00183942 | Liver | HCC | peptidyl-lysine acetylation | 116/7958 | 169/18723 | 5.11e-12 | 2.23e-10 | 116 |
| GO:190290322 | Liver | HCC | regulation of supramolecular fiber organization | 224/7958 | 383/18723 | 1.54e-10 | 5.33e-09 | 224 |
| GO:00064752 | Liver | HCC | internal protein amino acid acetylation | 107/7958 | 160/18723 | 3.77e-10 | 1.23e-08 | 107 |
| GO:001063912 | Liver | HCC | negative regulation of organelle organization | 204/7958 | 348/18723 | 7.67e-10 | 2.37e-08 | 204 |
| GO:00183932 | Liver | HCC | internal peptidyl-lysine acetylation | 105/7958 | 158/18723 | 9.48e-10 | 2.90e-08 | 105 |
| GO:001604921 | Liver | HCC | cell growth | 269/7958 | 482/18723 | 1.84e-09 | 5.35e-08 | 269 |
| GO:00165732 | Liver | HCC | histone acetylation | 101/7958 | 152/18723 | 1.99e-09 | 5.63e-08 | 101 |
| GO:003105621 | Liver | HCC | regulation of histone modification | 99/7958 | 152/18723 | 1.40e-08 | 3.40e-07 | 99 |
| GO:00434141 | Liver | HCC | macromolecule methylation | 183/7958 | 316/18723 | 2.00e-08 | 4.72e-07 | 183 |
| GO:004873222 | Liver | HCC | gland development | 242/7958 | 436/18723 | 2.26e-08 | 5.28e-07 | 242 |
| GO:0032259 | Liver | HCC | methylation | 206/7958 | 364/18723 | 3.35e-08 | 7.53e-07 | 206 |
| GO:003297022 | Liver | HCC | regulation of actin filament-based process | 222/7958 | 397/18723 | 3.81e-08 | 8.30e-07 | 222 |
| GO:003295622 | Liver | HCC | regulation of actin cytoskeleton organization | 202/7958 | 358/18723 | 6.18e-08 | 1.29e-06 | 202 |
| GO:000155821 | Liver | HCC | regulation of cell growth | 228/7958 | 414/18723 | 1.34e-07 | 2.55e-06 | 228 |
| GO:00064792 | Liver | HCC | protein methylation | 111/7958 | 181/18723 | 2.36e-07 | 4.18e-06 | 111 |
| Page: 1 2 3 4 5 6 7 8 9 10 11 12 13 14 15 16 17 18 19 20 21 22 23 24 25 26 27 28 29 30 31 32 33 34 |
| Pathway ID | Tissue | Disease Stage | Description | Gene Ratio | Bg Ratio | pvalue | p.adjust | qvalue | Count |
| hsa0521022 | Liver | HCC | Colorectal cancer | 65/4020 | 86/8465 | 8.85e-08 | 1.23e-06 | 6.87e-07 | 65 |
| hsa041102 | Liver | HCC | Cell cycle | 106/4020 | 157/8465 | 2.54e-07 | 3.04e-06 | 1.69e-06 | 106 |
| hsa0452042 | Liver | HCC | Adherens junction | 68/4020 | 93/8465 | 3.99e-07 | 4.46e-06 | 2.48e-06 | 68 |
| hsa0516622 | Liver | HCC | Human T-cell leukemia virus 1 infection | 139/4020 | 222/8465 | 3.17e-06 | 2.79e-05 | 1.55e-05 | 139 |
| hsa0522021 | Liver | HCC | Chronic myeloid leukemia | 55/4020 | 76/8465 | 8.67e-06 | 6.91e-05 | 3.84e-05 | 55 |
| hsa0521221 | Liver | HCC | Pancreatic cancer | 54/4020 | 76/8465 | 2.50e-05 | 1.64e-04 | 9.12e-05 | 54 |
| hsa052258 | Liver | HCC | Hepatocellular carcinoma | 106/4020 | 168/8465 | 2.87e-05 | 1.85e-04 | 1.03e-04 | 106 |
| hsa040684 | Liver | HCC | FoxO signaling pathway | 85/4020 | 131/8465 | 3.99e-05 | 2.16e-04 | 1.20e-04 | 85 |
| hsa049334 | Liver | HCC | AGE-RAGE signaling pathway in diabetic complications | 62/4020 | 100/8465 | 2.35e-03 | 7.95e-03 | 4.42e-03 | 62 |
| hsa051612 | Liver | HCC | Hepatitis B | 91/4020 | 162/8465 | 1.56e-02 | 3.76e-02 | 2.09e-02 | 91 |
| hsa0521032 | Liver | HCC | Colorectal cancer | 65/4020 | 86/8465 | 8.85e-08 | 1.23e-06 | 6.87e-07 | 65 |
| hsa041103 | Liver | HCC | Cell cycle | 106/4020 | 157/8465 | 2.54e-07 | 3.04e-06 | 1.69e-06 | 106 |
| hsa0452052 | Liver | HCC | Adherens junction | 68/4020 | 93/8465 | 3.99e-07 | 4.46e-06 | 2.48e-06 | 68 |
| hsa0516632 | Liver | HCC | Human T-cell leukemia virus 1 infection | 139/4020 | 222/8465 | 3.17e-06 | 2.79e-05 | 1.55e-05 | 139 |
| hsa0522031 | Liver | HCC | Chronic myeloid leukemia | 55/4020 | 76/8465 | 8.67e-06 | 6.91e-05 | 3.84e-05 | 55 |
| hsa0521231 | Liver | HCC | Pancreatic cancer | 54/4020 | 76/8465 | 2.50e-05 | 1.64e-04 | 9.12e-05 | 54 |
| hsa0522511 | Liver | HCC | Hepatocellular carcinoma | 106/4020 | 168/8465 | 2.87e-05 | 1.85e-04 | 1.03e-04 | 106 |
| hsa040685 | Liver | HCC | FoxO signaling pathway | 85/4020 | 131/8465 | 3.99e-05 | 2.16e-04 | 1.20e-04 | 85 |
| hsa0493311 | Liver | HCC | AGE-RAGE signaling pathway in diabetic complications | 62/4020 | 100/8465 | 2.35e-03 | 7.95e-03 | 4.42e-03 | 62 |
| hsa0516111 | Liver | HCC | Hepatitis B | 91/4020 | 162/8465 | 1.56e-02 | 3.76e-02 | 2.09e-02 | 91 |
| Page: 1 2 3 4 |
Top |
Cell-cell communication analysis |
| Identification of potential cell-cell interactions between two cell types and their ligand-receptor pairs for different disease states |
| Ligand | Receptor | LRpair | Pathway | Tissue | Disease Stage |
| Page: 1 |
Top |
Single-cell gene regulatory network inference analysis |
| Find out the significant the regulons (TFs) and the target genes of each regulon across cell types for different disease states |
| TF | Cell Type | Tissue | Disease Stage | Target Gene | RSS | Regulon Activity |
| SMAD4 | BMEM | Breast | ADJ | FEZ2,CTHRC1,CRYBG3, etc. | 2.43e-01 |  |
| SMAD4 | PLA | Breast | Healthy | FEZ2,CTHRC1,CRYBG3, etc. | 8.04e-02 |  |
| SMAD4 | PLA | Breast | Precancer | FEZ2,CTHRC1,CRYBG3, etc. | 1.23e-01 |  |
| SMAD4 | BMEM | Breast | Precancer | FEZ2,CTHRC1,CRYBG3, etc. | 1.07e-01 | |
| SMAD4 | MES | Cervix | N_HPV | TSPAN2,SERPINE2,LOXL1-AS1, etc. | 3.04e-02 |  |
| SMAD4 | ILC | Colorectum | CRC | EFCAB5,NIPSNAP1,CBR4, etc. | 1.96e-02 |  |
| SMAD4 | ILC | Colorectum | FAP | EFCAB5,NIPSNAP1,CBR4, etc. | 2.35e-02 |  |
| SMAD4 | CD8TCM | Colorectum | Healthy | EFCAB5,NIPSNAP1,CBR4, etc. | 7.71e-03 |  |
| SMAD4 | TFH | Colorectum | SER | EFCAB5,NIPSNAP1,CBR4, etc. | 0.00e+00 |  |
| SMAD4 | TH17 | Endometrium | ADJ | ATRX,RABEPK,ZNF615, etc. | 6.78e-02 |  |
| ∗The dot plots of a searched regulon are shown for all cell subpopulations in each disease state of each tissue based on the regulon specific score inferred using pySCENIC and by calculating the average expression. |
| Page: 1 2 |
Top |
Somatic mutation of malignant transformation related genes |
| Annotation of somatic variants for genes involved in malignant transformation |
| Hugo Symbol | Variant Class | Variant Classification | dbSNP RS | HGVSc | HGVSp | HGVSp Short | SWISSPROT | BIOTYPE | SIFT | PolyPhen | Tumor Sample Barcode | Tissue | Histology | Sex | Age | Stage | Therapy Types | Drugs | Outcome |
| SMAD4 | SNV | Missense_Mutation | c.326N>G | p.Leu109Arg | p.L109R | Q13485 | protein_coding | deleterious(0.03) | probably_damaging(1) | TCGA-A2-A25B-01 | Breast | breast invasive carcinoma | Female | <65 | I/II | Chemotherapy | taxotere | PD | |
| SMAD4 | SNV | Missense_Mutation | c.394C>T | p.His132Tyr | p.H132Y | Q13485 | protein_coding | deleterious(0) | probably_damaging(0.999) | TCGA-AC-A23H-01 | Breast | breast invasive carcinoma | Female | >=65 | I/II | Unknown | Unknown | PD | |
| SMAD4 | SNV | Missense_Mutation | rs377767347 | c.1082N>A | p.Arg361His | p.R361H | Q13485 | protein_coding | deleterious(0.03) | probably_damaging(0.999) | TCGA-B6-A2IU-01 | Breast | breast invasive carcinoma | Female | <65 | I/II | Unknown | Unknown | PD |
| SMAD4 | SNV | Missense_Mutation | novel | c.809G>T | p.Gly270Val | p.G270V | Q13485 | protein_coding | deleterious(0.04) | possibly_damaging(0.543) | TCGA-GM-A3NW-01 | Breast | breast invasive carcinoma | Female | <65 | I/II | Chemotherapy | fluorouracil | SD |
| SMAD4 | SNV | Missense_Mutation | c.1051N>C | p.Asp351His | p.D351H | Q13485 | protein_coding | deleterious(0) | probably_damaging(1) | TCGA-XX-A89A-01 | Breast | breast invasive carcinoma | Female | >=65 | I/II | Unknown | Unknown | SD | |
| SMAD4 | insertion | Frame_Shift_Ins | novel | c.141_142insCCCACACTACCATGCCTGGCGAACCTCCTACATTTTTTTAGAC | p.Lys48ProfsTer20 | p.K48Pfs*20 | Q13485 | protein_coding | TCGA-A8-A07R-01 | Breast | breast invasive carcinoma | Female | >=65 | III/IV | Ancillary | zoledronic | SD | ||
| SMAD4 | deletion | Frame_Shift_Del | c.945delC | p.Asn316IlefsTer20 | p.N316Ifs*20 | Q13485 | protein_coding | TCGA-A8-A094-01 | Breast | breast invasive carcinoma | Female | >=65 | I/II | Unknown | Unknown | SD | |||
| SMAD4 | deletion | Frame_Shift_Del | c.687delN | p.Gly231AlafsTer10 | p.G231Afs*10 | Q13485 | protein_coding | TCGA-A8-A09Z-01 | Breast | breast invasive carcinoma | Female | >=65 | I/II | Unknown | Unknown | SD | |||
| SMAD4 | insertion | Frame_Shift_Ins | novel | c.283_284insTTTCTTTTTTAGGTTATCCTGA | p.Tyr95PhefsTer16 | p.Y95Ffs*16 | Q13485 | protein_coding | TCGA-AN-A0FL-01 | Breast | breast invasive carcinoma | Female | <65 | I/II | Unknown | Unknown | SD | ||
| SMAD4 | deletion | Frame_Shift_Del | novel | c.1367delN | p.Ala456ValfsTer20 | p.A456Vfs*20 | Q13485 | protein_coding | TCGA-D8-A27V-01 | Breast | breast invasive carcinoma | Female | <65 | I/II | Hormone Therapy | tamoxiphen | SD |
| Page: 1 2 3 4 5 6 7 8 9 10 11 12 13 14 15 16 17 18 |
Top |
Related drugs of malignant transformation related genes |
| Identification of chemicals and drugs interact with genes involved in malignant transfromation |
| (DGIdb 4.0) |
| Entrez ID | Symbol | Category | Interaction Types | Drug Claim Name | Drug Name | PMIDs |
| 4089 | SMAD4 | CLINICALLY ACTIONABLE, TRANSCRIPTION FACTOR COMPLEX, DRUG RESISTANCE, KINASE | Sapanisertib | SAPANISERTIB | 25261369 | |
| 4089 | SMAD4 | CLINICALLY ACTIONABLE, TRANSCRIPTION FACTOR COMPLEX, DRUG RESISTANCE, KINASE | Gemcitabine | GEMCITABINE | 22753594 | |
| 4089 | SMAD4 | CLINICALLY ACTIONABLE, TRANSCRIPTION FACTOR COMPLEX, DRUG RESISTANCE, KINASE | FLUOROURACIL | FLUOROURACIL | 12237773 | |
| 4089 | SMAD4 | CLINICALLY ACTIONABLE, TRANSCRIPTION FACTOR COMPLEX, DRUG RESISTANCE, KINASE | Cisplatin | CISPLATIN | 22753594 | |
| 4089 | SMAD4 | CLINICALLY ACTIONABLE, TRANSCRIPTION FACTOR COMPLEX, DRUG RESISTANCE, KINASE | GEMCITABINE | GEMCITABINE | 28577946 | |
| 4089 | SMAD4 | CLINICALLY ACTIONABLE, TRANSCRIPTION FACTOR COMPLEX, DRUG RESISTANCE, KINASE | LYSINE | LYSINE | 27875625 | |
| 4089 | SMAD4 | CLINICALLY ACTIONABLE, TRANSCRIPTION FACTOR COMPLEX, DRUG RESISTANCE, KINASE | Crizotinib | CRIZOTINIB | 28476735 | |
| 4089 | SMAD4 | CLINICALLY ACTIONABLE, TRANSCRIPTION FACTOR COMPLEX, DRUG RESISTANCE, KINASE | N/A | 19584151,25681512,22504380,19478385,25749173,26947875,26861460,25760429 | ||
| 4089 | SMAD4 | CLINICALLY ACTIONABLE, TRANSCRIPTION FACTOR COMPLEX, DRUG RESISTANCE, KINASE | Paclitaxel | PACLITAXEL | 28514312 | |
| 4089 | SMAD4 | CLINICALLY ACTIONABLE, TRANSCRIPTION FACTOR COMPLEX, DRUG RESISTANCE, KINASE | Carboplatin | CARBOPLATIN | 28514312 |
| Page: 1 2 |

Copyright 2023-Present -The University of Texas Health Science Center at Houston |