
|
|||||
|
 | |
| |
| |
| |
| |
| |
|
Gene: SMAD1 |
Gene summary for SMAD1 |
| Gene information | Species | Human | Gene symbol | SMAD1 | Gene ID | 4086 |
| Gene name | SMAD family member 1 | |
| Gene Alias | BSP-1 | |
| Cytomap | 4q31.21 | |
| Gene Type | protein-coding | GO ID | GO:0000003 | UniProtAcc | Q15797 |
Top |
Malignant transformation analysis |
| Identification of the aberrant gene expression in precancerous and cancerous lesions by comparing the gene expression of stem-like cells in diseased tissues with normal stem cells |
| Entrez ID | Symbol | Replicates | Species | Organ | Tissue | Adj P-value | Log2FC | Malignancy |
| 4086 | SMAD1 | LZE2T | Human | Esophagus | ESCC | 7.29e-03 | 5.10e-01 | 0.082 |
| 4086 | SMAD1 | LZE4T | Human | Esophagus | ESCC | 1.27e-19 | 6.51e-01 | 0.0811 |
| 4086 | SMAD1 | LZE5T | Human | Esophagus | ESCC | 1.73e-02 | 3.38e-01 | 0.0514 |
| 4086 | SMAD1 | LZE8T | Human | Esophagus | ESCC | 7.97e-04 | 2.03e-01 | 0.067 |
| 4086 | SMAD1 | LZE20T | Human | Esophagus | ESCC | 2.09e-04 | 2.09e-01 | 0.0662 |
| 4086 | SMAD1 | LZE24T | Human | Esophagus | ESCC | 7.37e-18 | 4.21e-01 | 0.0596 |
| 4086 | SMAD1 | LZE21T | Human | Esophagus | ESCC | 3.64e-02 | 3.14e-01 | 0.0655 |
| 4086 | SMAD1 | P1T-E | Human | Esophagus | ESCC | 3.88e-10 | 4.28e-01 | 0.0875 |
| 4086 | SMAD1 | P2T-E | Human | Esophagus | ESCC | 2.16e-73 | 1.32e+00 | 0.1177 |
| 4086 | SMAD1 | P4T-E | Human | Esophagus | ESCC | 6.40e-24 | 6.44e-01 | 0.1323 |
| 4086 | SMAD1 | P5T-E | Human | Esophagus | ESCC | 4.39e-16 | 3.84e-01 | 0.1327 |
| 4086 | SMAD1 | P8T-E | Human | Esophagus | ESCC | 3.02e-34 | 6.66e-01 | 0.0889 |
| 4086 | SMAD1 | P9T-E | Human | Esophagus | ESCC | 9.48e-17 | 3.62e-01 | 0.1131 |
| 4086 | SMAD1 | P10T-E | Human | Esophagus | ESCC | 6.65e-26 | 3.90e-01 | 0.116 |
| 4086 | SMAD1 | P11T-E | Human | Esophagus | ESCC | 3.22e-20 | 7.66e-01 | 0.1426 |
| 4086 | SMAD1 | P12T-E | Human | Esophagus | ESCC | 1.06e-50 | 1.13e+00 | 0.1122 |
| 4086 | SMAD1 | P15T-E | Human | Esophagus | ESCC | 6.76e-39 | 8.35e-01 | 0.1149 |
| 4086 | SMAD1 | P16T-E | Human | Esophagus | ESCC | 1.89e-33 | 6.50e-01 | 0.1153 |
| 4086 | SMAD1 | P17T-E | Human | Esophagus | ESCC | 5.18e-12 | 4.57e-01 | 0.1278 |
| 4086 | SMAD1 | P19T-E | Human | Esophagus | ESCC | 8.46e-04 | 4.11e-01 | 0.1662 |
| Page: 1 2 3 4 |
| Tissue | Expression Dynamics | Abbreviation |
| Esophagus | 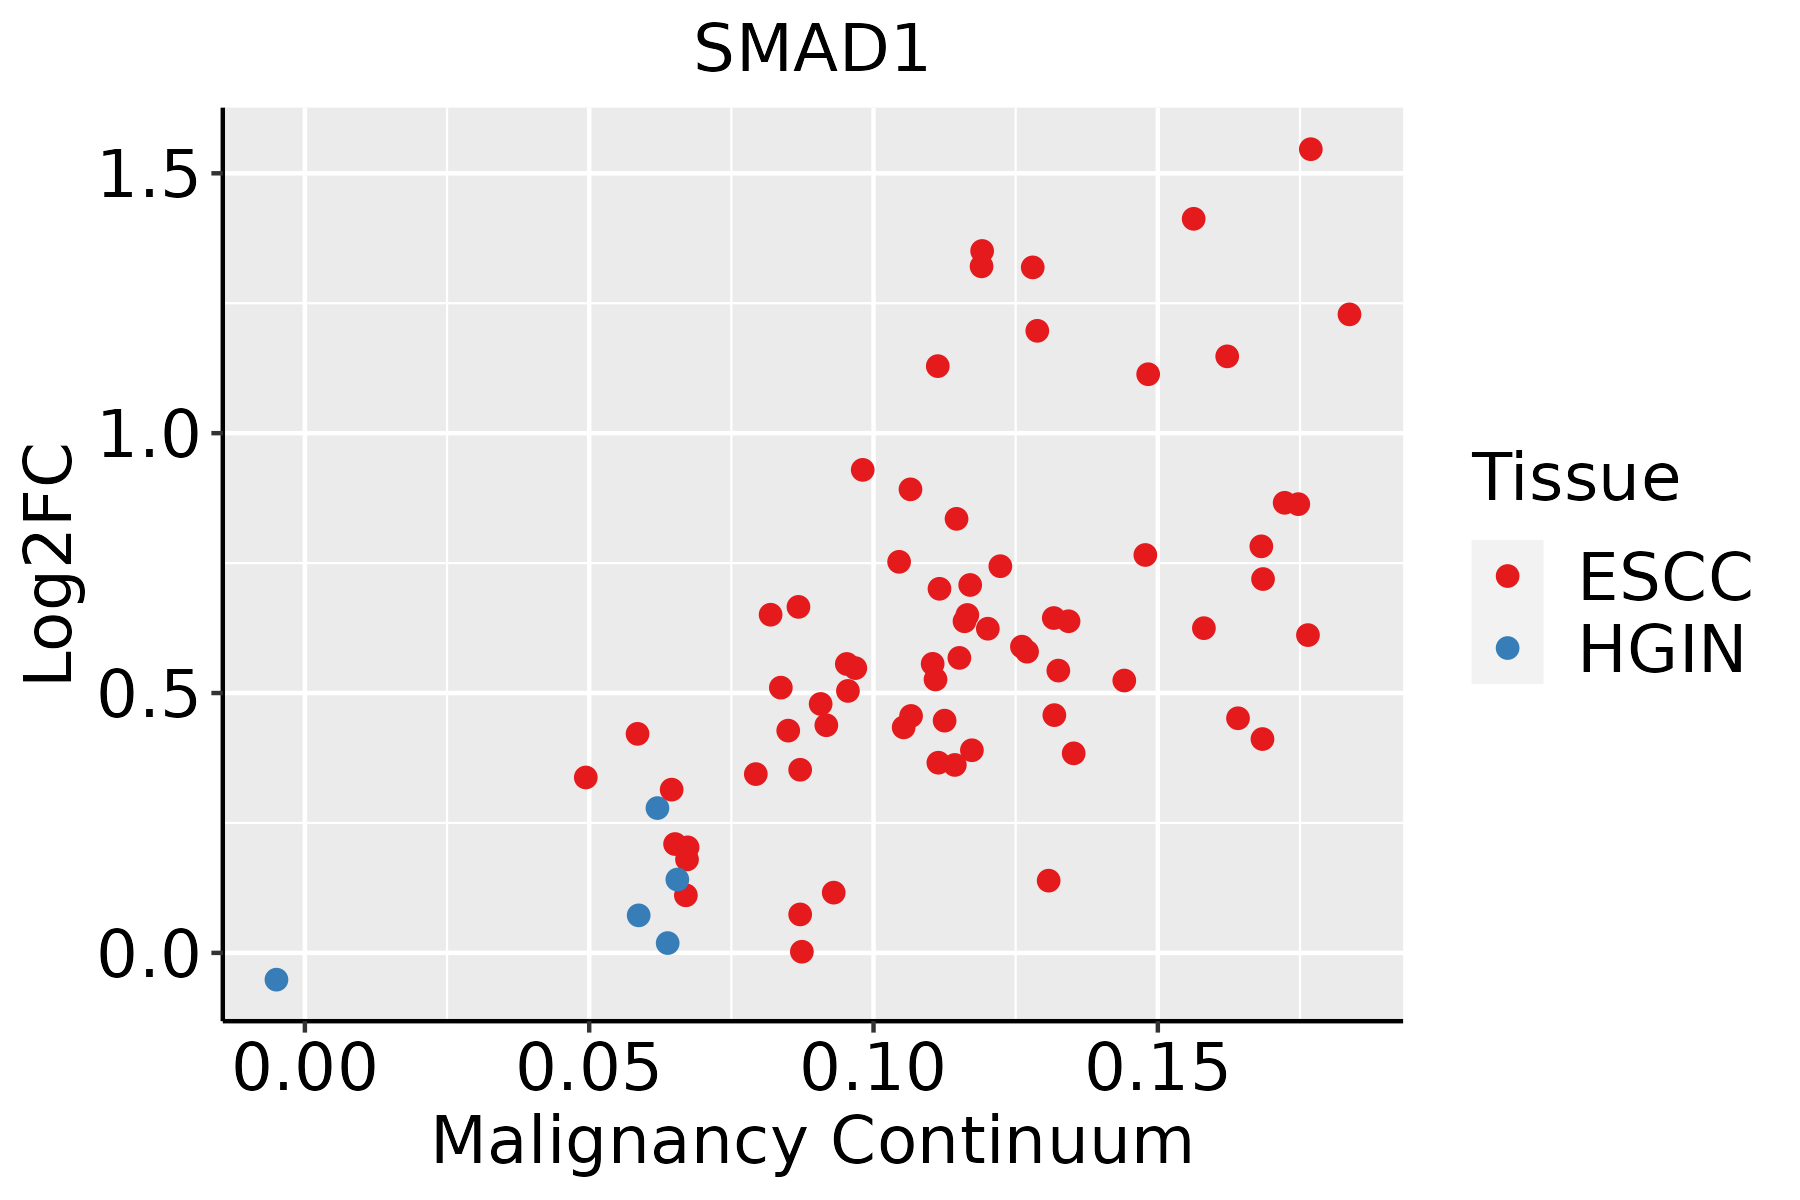 | ESCC: Esophageal squamous cell carcinoma |
| HGIN: High-grade intraepithelial neoplasias | ||
| LGIN: Low-grade intraepithelial neoplasias | ||
| Oral Cavity | 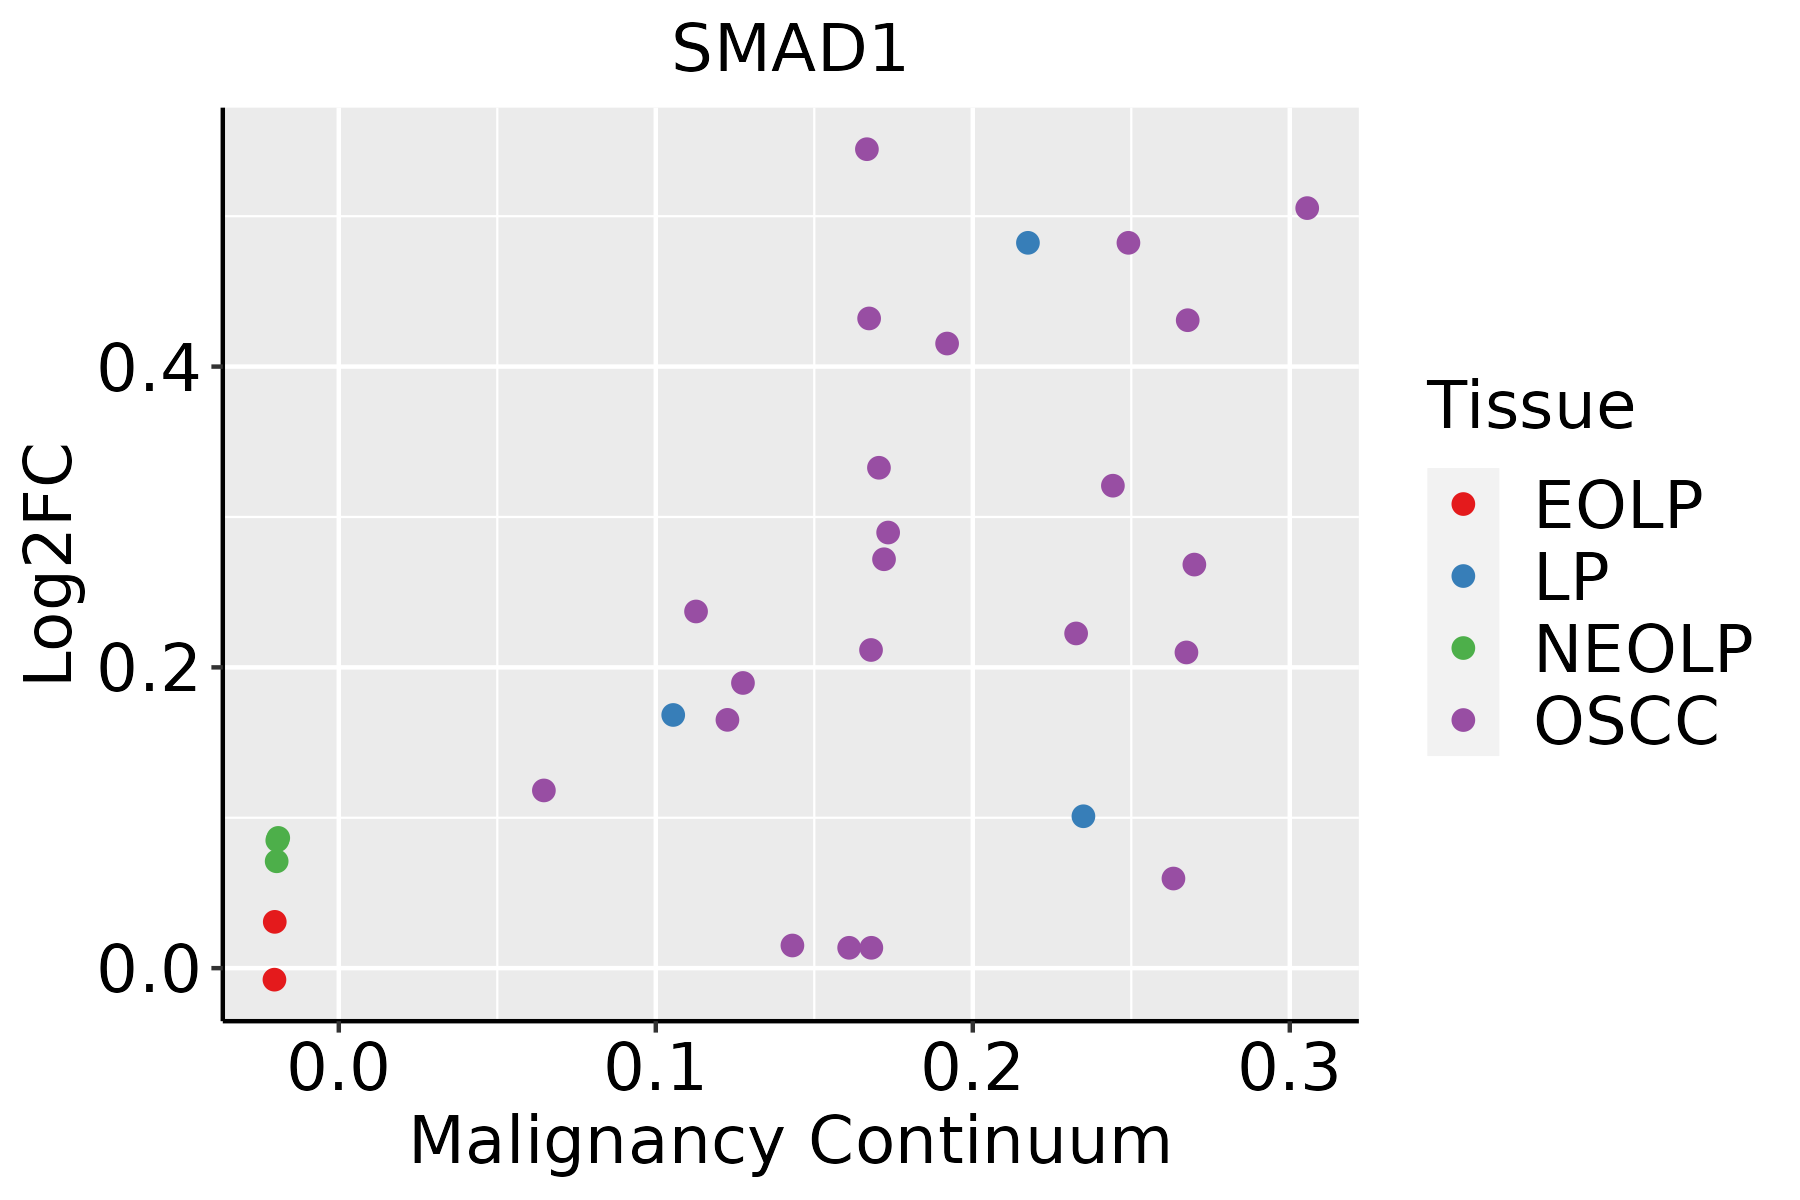 | EOLP: Erosive Oral lichen planus |
| LP: leukoplakia | ||
| NEOLP: Non-erosive oral lichen planus | ||
| OSCC: Oral squamous cell carcinoma |
| ∗log2FC in expression of this searched gene in stem-like cells from each diseased tissue sample relative to stem-like cells in normal samples in each tissue plotted against the malignancy continuum. Samples are colored based on if they are from different disease stage. |
Top |
Malignant transformation related pathway analysis |
| Find out the enriched GO biological processes and KEGG pathways involved in transition from healthy to precancer to cancer |
| Tissue | Disease Stage | Enriched GO biological Processes |
| Colorectum | AD |  |
| Colorectum | SER |  |
| Colorectum | MSS |  |
| Colorectum | MSI-H |  |
| Colorectum | FAP |  |
| ∗Top 15 enriched GO BP terms are showed in the bar plot of each disease state in each tissue. Each row represents a significant GO biological process which is colored according to the -log10(p.adjust). |
| Page: 1 2 3 4 5 6 7 8 9 |
| GO ID | Tissue | Disease Stage | Description | Gene Ratio | Bg Ratio | pvalue | p.adjust | Count |
| GO:003447015 | Esophagus | ESCC | ncRNA processing | 300/8552 | 395/18723 | 3.09e-35 | 3.26e-32 | 300 |
| GO:003466012 | Esophagus | ESCC | ncRNA metabolic process | 346/8552 | 485/18723 | 4.35e-31 | 2.51e-28 | 346 |
| GO:00715599 | Esophagus | ESCC | response to transforming growth factor beta | 157/8552 | 256/18723 | 2.95e-07 | 4.23e-06 | 157 |
| GO:000164918 | Esophagus | ESCC | osteoblast differentiation | 140/8552 | 229/18723 | 1.63e-06 | 1.95e-05 | 140 |
| GO:00715609 | Esophagus | ESCC | cellular response to transforming growth factor beta stimulus | 151/8552 | 250/18723 | 1.78e-06 | 2.10e-05 | 151 |
| GO:000150317 | Esophagus | ESCC | ossification | 232/8552 | 408/18723 | 3.00e-06 | 3.40e-05 | 232 |
| GO:00073698 | Esophagus | ESCC | gastrulation | 115/8552 | 185/18723 | 4.35e-06 | 4.64e-05 | 115 |
| GO:00071799 | Esophagus | ESCC | transforming growth factor beta receptor signaling pathway | 121/8552 | 198/18723 | 8.26e-06 | 8.03e-05 | 121 |
| GO:00351969 | Esophagus | ESCC | production of miRNAs involved in gene silencing by miRNA | 37/8552 | 52/18723 | 1.75e-04 | 1.14e-03 | 37 |
| GO:00310508 | Esophagus | ESCC | dsRNA processing | 38/8552 | 54/18723 | 2.08e-04 | 1.31e-03 | 38 |
| GO:00709188 | Esophagus | ESCC | production of small RNA involved in gene silencing by RNA | 38/8552 | 54/18723 | 2.08e-04 | 1.31e-03 | 38 |
| GO:00017044 | Esophagus | ESCC | formation of primary germ layer | 75/8552 | 121/18723 | 2.17e-04 | 1.36e-03 | 75 |
| GO:003090118 | Esophagus | ESCC | midbrain development | 58/8552 | 90/18723 | 2.52e-04 | 1.55e-03 | 58 |
| GO:000717810 | Esophagus | ESCC | transmembrane receptor protein serine/threonine kinase signaling pathway | 195/8552 | 355/18723 | 2.58e-04 | 1.58e-03 | 195 |
| GO:19015225 | Esophagus | ESCC | positive regulation of transcription from RNA polymerase II promoter involved in cellular response to chemical stimulus | 18/8552 | 22/18723 | 5.69e-04 | 3.10e-03 | 18 |
| GO:00603485 | Esophagus | ESCC | bone development | 115/8552 | 205/18723 | 1.67e-03 | 7.72e-03 | 115 |
| GO:00456675 | Esophagus | ESCC | regulation of osteoblast differentiation | 77/8552 | 132/18723 | 2.28e-03 | 1.00e-02 | 77 |
| GO:006053716 | Esophagus | ESCC | muscle tissue development | 211/8552 | 403/18723 | 3.84e-03 | 1.56e-02 | 211 |
| GO:00456695 | Esophagus | ESCC | positive regulation of osteoblast differentiation | 43/8552 | 69/18723 | 3.93e-03 | 1.59e-02 | 43 |
| GO:003105311 | Esophagus | ESCC | primary miRNA processing | 11/8552 | 13/18723 | 4.76e-03 | 1.85e-02 | 11 |
| Page: 1 2 3 |
| Pathway ID | Tissue | Disease Stage | Description | Gene Ratio | Bg Ratio | pvalue | p.adjust | qvalue | Count |
| hsa043507 | Esophagus | ESCC | TGF-beta signaling pathway | 69/4205 | 108/8465 | 1.92e-03 | 5.54e-03 | 2.84e-03 | 69 |
| hsa052028 | Esophagus | ESCC | Transcriptional misregulation in cancer | 116/4205 | 193/8465 | 2.08e-03 | 5.95e-03 | 3.05e-03 | 116 |
| hsa0439018 | Esophagus | ESCC | Hippo signaling pathway | 92/4205 | 157/8465 | 1.46e-02 | 3.31e-02 | 1.69e-02 | 92 |
| hsa0435014 | Esophagus | ESCC | TGF-beta signaling pathway | 69/4205 | 108/8465 | 1.92e-03 | 5.54e-03 | 2.84e-03 | 69 |
| hsa0520213 | Esophagus | ESCC | Transcriptional misregulation in cancer | 116/4205 | 193/8465 | 2.08e-03 | 5.95e-03 | 3.05e-03 | 116 |
| hsa0439019 | Esophagus | ESCC | Hippo signaling pathway | 92/4205 | 157/8465 | 1.46e-02 | 3.31e-02 | 1.69e-02 | 92 |
| hsa0439016 | Oral cavity | OSCC | Hippo signaling pathway | 86/3704 | 157/8465 | 3.30e-03 | 8.24e-03 | 4.20e-03 | 86 |
| hsa043506 | Oral cavity | OSCC | TGF-beta signaling pathway | 60/3704 | 108/8465 | 8.66e-03 | 1.97e-02 | 1.00e-02 | 60 |
| hsa0439017 | Oral cavity | OSCC | Hippo signaling pathway | 86/3704 | 157/8465 | 3.30e-03 | 8.24e-03 | 4.20e-03 | 86 |
| hsa0435013 | Oral cavity | OSCC | TGF-beta signaling pathway | 60/3704 | 108/8465 | 8.66e-03 | 1.97e-02 | 1.00e-02 | 60 |
| Page: 1 |
Top |
Cell-cell communication analysis |
| Identification of potential cell-cell interactions between two cell types and their ligand-receptor pairs for different disease states |
| Ligand | Receptor | LRpair | Pathway | Tissue | Disease Stage |
| Page: 1 |
Top |
Single-cell gene regulatory network inference analysis |
| Find out the significant the regulons (TFs) and the target genes of each regulon across cell types for different disease states |
| TF | Cell Type | Tissue | Disease Stage | Target Gene | RSS | Regulon Activity |
| SMAD1 | STM | Breast | IDC | ZNF773,MMAA,FADS1, etc. | 2.14e-01 |  |
| SMAD1 | MVA | Breast | ADJ | CLDN5,MGLL,PGF, etc. | 2.33e-01 |  |
| SMAD1 | PVA | Breast | Precancer | CLDN5,MGLL,PGF, etc. | 2.61e-01 |  |
| SMAD1 | MVA | Cervix | ADJ | SLC9A9,RUNDC3B,HOXD9, etc. | 1.95e-01 |  |
| SMAD1 | LYMEND | Cervix | CC | SLC9A9,RUNDC3B,HOXD9, etc. | 2.22e-01 |  |
| SMAD1 | END | Cervix | HSIL_HPV | SLC9A9,RUNDC3B,HOXD9, etc. | 3.57e-01 |  |
| SMAD1 | END | Cervix | N_HPV | SLC9A9,RUNDC3B,HOXD9, etc. | 3.47e-01 |  |
| SMAD1 | END | Colorectum | AD | STK32B,TFPI,VAV3, etc. | 5.02e-01 |  |
| SMAD1 | END | Colorectum | MSI-H | STK32B,TFPI,VAV3, etc. | 5.75e-01 |  |
| SMAD1 | END | Colorectum | MSS | STK32B,TFPI,VAV3, etc. | 4.74e-01 |  |
| ∗The dot plots of a searched regulon are shown for all cell subpopulations in each disease state of each tissue based on the regulon specific score inferred using pySCENIC and by calculating the average expression. |
| Page: 1 2 3 4 |
Top |
Somatic mutation of malignant transformation related genes |
| Annotation of somatic variants for genes involved in malignant transformation |
| Hugo Symbol | Variant Class | Variant Classification | dbSNP RS | HGVSc | HGVSp | HGVSp Short | SWISSPROT | BIOTYPE | SIFT | PolyPhen | Tumor Sample Barcode | Tissue | Histology | Sex | Age | Stage | Therapy Types | Drugs | Outcome |
| SMAD1 | SNV | Missense_Mutation | novel | c.796G>C | p.Glu266Gln | p.E266Q | Q15797 | protein_coding | tolerated(0.59) | benign(0.021) | TCGA-B6-A0WZ-01 | Breast | breast invasive carcinoma | Female | <65 | I/II | Unknown | Unknown | PD |
| SMAD1 | SNV | Missense_Mutation | c.918G>C | p.Lys306Asn | p.K306N | Q15797 | protein_coding | deleterious(0.04) | benign(0.005) | TCGA-E9-A243-01 | Breast | breast invasive carcinoma | Female | <65 | I/II | Chemotherapy | 5-fluorouracil | PD | |
| SMAD1 | SNV | Missense_Mutation | c.508N>A | p.Ala170Thr | p.A170T | Q15797 | protein_coding | tolerated(0.74) | possibly_damaging(0.449) | TCGA-VS-A94Z-01 | Cervix | cervical & endocervical cancer | Female | <65 | I/II | Chemotherapy | cisplatin | CR | |
| SMAD1 | SNV | Missense_Mutation | c.857N>T | p.Ala286Val | p.A286V | Q15797 | protein_coding | tolerated(0.19) | benign(0.003) | TCGA-AA-3492-01 | Colorectum | colon adenocarcinoma | Female | >=65 | I/II | Unknown | Unknown | SD | |
| SMAD1 | SNV | Missense_Mutation | c.956N>A | p.Arg319Gln | p.R319Q | Q15797 | protein_coding | deleterious(0.03) | possibly_damaging(0.563) | TCGA-AA-A022-01 | Colorectum | colon adenocarcinoma | Female | >=65 | I/II | Unknown | Unknown | SD | |
| SMAD1 | SNV | Missense_Mutation | c.302N>G | p.His101Arg | p.H101R | Q15797 | protein_coding | deleterious(0.03) | probably_damaging(0.972) | TCGA-AY-6197-01 | Colorectum | colon adenocarcinoma | Male | <65 | I/II | Unknown | Unknown | SD | |
| SMAD1 | SNV | Missense_Mutation | novel | c.386N>A | p.Arg129Lys | p.R129K | Q15797 | protein_coding | tolerated(0.21) | possibly_damaging(0.718) | TCGA-CA-6717-01 | Colorectum | colon adenocarcinoma | Male | <65 | I/II | Chemotherapy | oxaliplatin | CR |
| SMAD1 | SNV | Missense_Mutation | rs576994811 | c.743N>T | p.Ala248Val | p.A248V | Q15797 | protein_coding | tolerated(0.62) | benign(0) | TCGA-CA-6717-01 | Colorectum | colon adenocarcinoma | Male | <65 | I/II | Chemotherapy | oxaliplatin | CR |
| SMAD1 | SNV | Missense_Mutation | rs765987226 | c.1226N>C | p.Met409Thr | p.M409T | Q15797 | protein_coding | deleterious(0) | probably_damaging(0.971) | TCGA-CA-6717-01 | Colorectum | colon adenocarcinoma | Male | <65 | I/II | Chemotherapy | oxaliplatin | CR |
| SMAD1 | SNV | Missense_Mutation | c.775N>A | p.Asp259Asn | p.D259N | Q15797 | protein_coding | tolerated(0.1) | benign(0.005) | TCGA-CM-5864-01 | Colorectum | colon adenocarcinoma | Male | <65 | I/II | Unknown | Unknown | SD |
| Page: 1 2 3 4 |
Top |
Related drugs of malignant transformation related genes |
| Identification of chemicals and drugs interact with genes involved in malignant transfromation |
| (DGIdb 4.0) |
| Entrez ID | Symbol | Category | Interaction Types | Drug Claim Name | Drug Name | PMIDs |
| Page: 1 |

Copyright 2023-Present -The University of Texas Health Science Center at Houston |