
|
|||||
|
 | |
| |
| |
| |
| |
| |
|
Gene: SLX1A |
Gene summary for SLX1A |
| Gene information | Species | Human | Gene symbol | SLX1A | Gene ID | 548593 |
| Gene name | SLX1 homolog A, structure-specific endonuclease subunit | |
| Gene Alias | GIYD1 | |
| Cytomap | 16p11.2 | |
| Gene Type | protein-coding | GO ID | GO:0000723 | UniProtAcc | Q9BQ83 |
Top |
Malignant transformation analysis |
| Identification of the aberrant gene expression in precancerous and cancerous lesions by comparing the gene expression of stem-like cells in diseased tissues with normal stem cells |
| Entrez ID | Symbol | Replicates | Species | Organ | Tissue | Adj P-value | Log2FC | Malignancy |
| 548593 | SLX1A | HTA11_2487_2000001011 | Human | Colorectum | SER | 8.42e-05 | 1.71e-01 | -0.1808 |
| 548593 | SLX1A | HTA11_347_2000001011 | Human | Colorectum | AD | 7.64e-06 | 1.50e-01 | -0.1954 |
| 548593 | SLX1A | HTA11_3361_2000001011 | Human | Colorectum | AD | 1.34e-03 | 1.69e-01 | -0.1207 |
| 548593 | SLX1A | HTA11_83_2000001011 | Human | Colorectum | SER | 2.92e-07 | 2.58e-01 | -0.1526 |
| 548593 | SLX1A | HTA11_696_2000001011 | Human | Colorectum | AD | 7.11e-14 | 2.62e-01 | -0.1464 |
| 548593 | SLX1A | HTA11_1391_2000001011 | Human | Colorectum | AD | 2.00e-12 | 3.15e-01 | -0.059 |
| 548593 | SLX1A | HTA11_2992_2000001011 | Human | Colorectum | SER | 1.72e-05 | 2.63e-01 | -0.1706 |
| 548593 | SLX1A | HTA11_5216_2000001011 | Human | Colorectum | SER | 3.03e-06 | 4.66e-01 | -0.1462 |
| 548593 | SLX1A | HTA11_6818_2000001021 | Human | Colorectum | AD | 1.54e-06 | 2.30e-01 | 0.0588 |
| 548593 | SLX1A | HTA11_99999965062_69753 | Human | Colorectum | MSI-H | 1.40e-05 | 5.85e-01 | 0.3487 |
| 548593 | SLX1A | HTA11_99999971662_82457 | Human | Colorectum | MSS | 1.92e-04 | 1.49e-01 | 0.3859 |
| 548593 | SLX1A | HTA11_99999974143_84620 | Human | Colorectum | MSS | 3.61e-02 | 9.17e-02 | 0.3005 |
| Page: 1 |
| Tissue | Expression Dynamics | Abbreviation |
| Colorectum (GSE201348) | 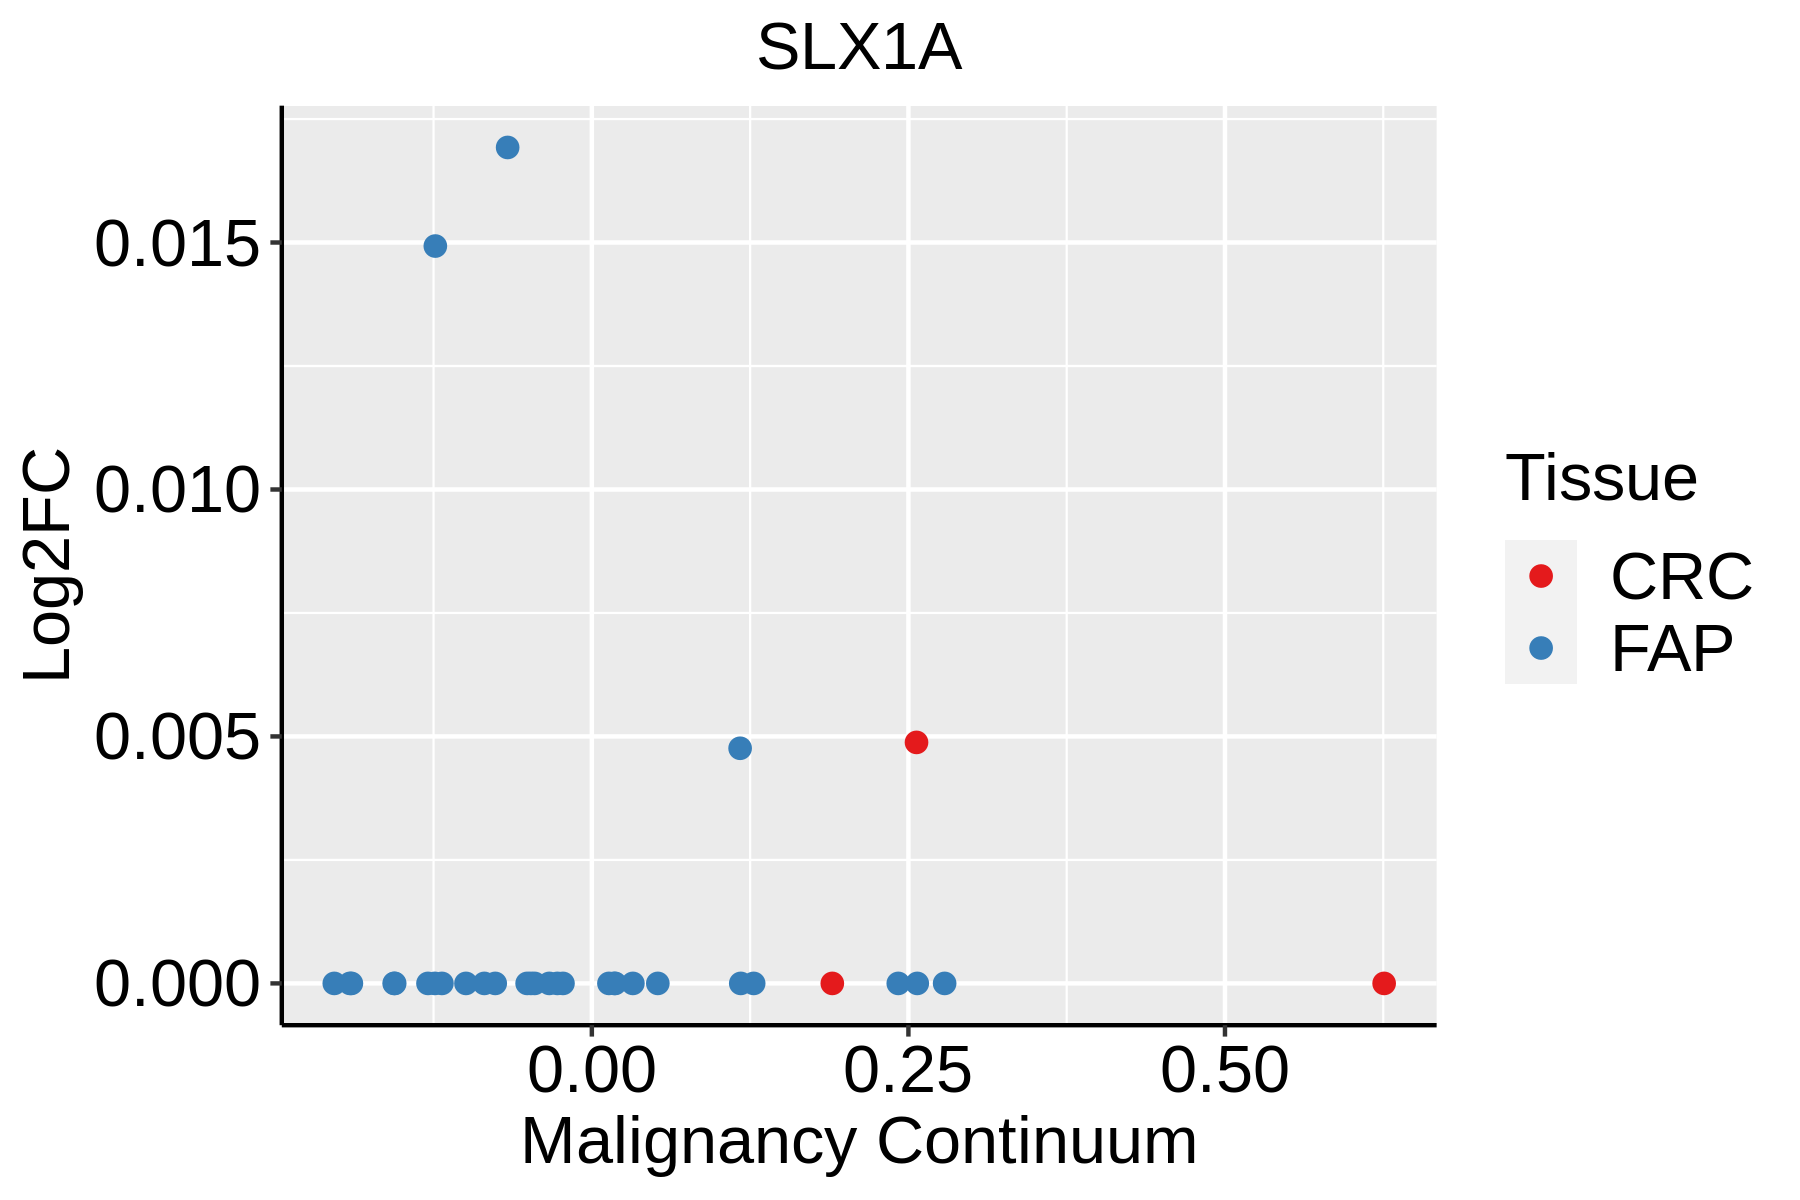 | FAP: Familial adenomatous polyposis |
| CRC: Colorectal cancer | ||
| Colorectum (HTA11) | 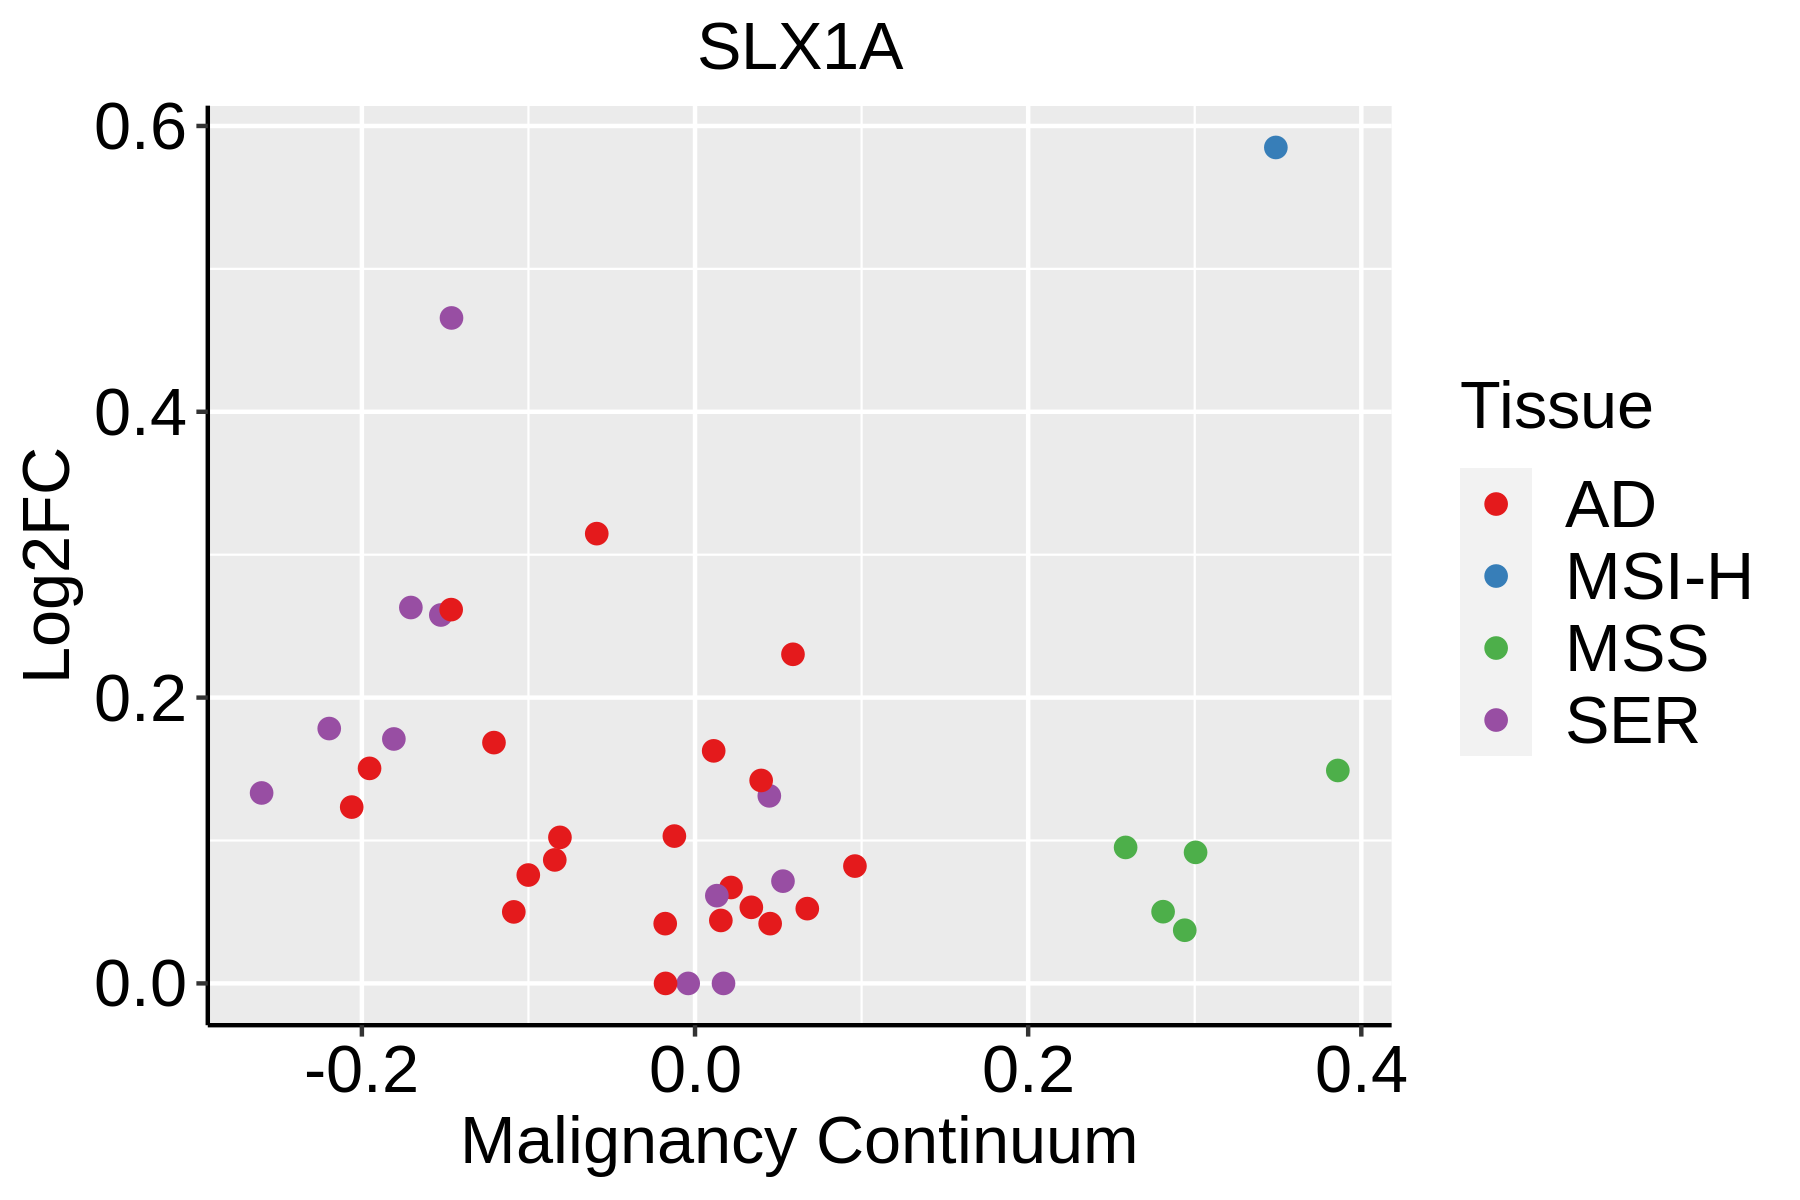 | AD: Adenomas |
| SER: Sessile serrated lesions | ||
| MSI-H: Microsatellite-high colorectal cancer | ||
| MSS: Microsatellite stable colorectal cancer |
| ∗log2FC in expression of this searched gene in stem-like cells from each diseased tissue sample relative to stem-like cells in normal samples in each tissue plotted against the malignancy continuum. Samples are colored based on if they are from different disease stage. |
Top |
Malignant transformation related pathway analysis |
| Find out the enriched GO biological processes and KEGG pathways involved in transition from healthy to precancer to cancer |
| Tissue | Disease Stage | Enriched GO biological Processes |
| Colorectum | AD |  |
| Colorectum | SER |  |
| Colorectum | MSS |  |
| Colorectum | MSI-H |  |
| Colorectum | FAP |  |
| ∗Top 15 enriched GO BP terms are showed in the bar plot of each disease state in each tissue. Each row represents a significant GO biological process which is colored according to the -log10(p.adjust). |
| Page: 1 2 3 4 5 6 7 8 9 |
| GO ID | Tissue | Disease Stage | Description | Gene Ratio | Bg Ratio | pvalue | p.adjust | Count |
| GO:0010639 | Colorectum | AD | negative regulation of organelle organization | 114/3918 | 348/18723 | 1.41e-07 | 6.49e-06 | 114 |
| GO:0051052 | Colorectum | AD | regulation of DNA metabolic process | 116/3918 | 359/18723 | 2.47e-07 | 1.00e-05 | 116 |
| GO:0051054 | Colorectum | AD | positive regulation of DNA metabolic process | 73/3918 | 201/18723 | 3.27e-07 | 1.29e-05 | 73 |
| GO:2001252 | Colorectum | AD | positive regulation of chromosome organization | 35/3918 | 82/18723 | 6.90e-06 | 1.72e-04 | 35 |
| GO:0032206 | Colorectum | AD | positive regulation of telomere maintenance | 23/3918 | 52/18723 | 1.31e-04 | 1.88e-03 | 23 |
| GO:0032204 | Colorectum | AD | regulation of telomere maintenance | 31/3918 | 80/18723 | 2.01e-04 | 2.67e-03 | 31 |
| GO:0033044 | Colorectum | AD | regulation of chromosome organization | 60/3918 | 187/18723 | 2.25e-04 | 2.94e-03 | 60 |
| GO:0000723 | Colorectum | AD | telomere maintenance | 43/3918 | 131/18723 | 9.77e-04 | 9.20e-03 | 43 |
| GO:0010833 | Colorectum | AD | telomere maintenance via telomere lengthening | 29/3918 | 81/18723 | 1.42e-03 | 1.22e-02 | 29 |
| GO:1904356 | Colorectum | AD | regulation of telomere maintenance via telomere lengthening | 23/3918 | 61/18723 | 1.96e-03 | 1.58e-02 | 23 |
| GO:00106391 | Colorectum | SER | negative regulation of organelle organization | 90/2897 | 348/18723 | 3.14e-07 | 1.69e-05 | 90 |
| GO:00510541 | Colorectum | SER | positive regulation of DNA metabolic process | 53/2897 | 201/18723 | 4.51e-05 | 1.13e-03 | 53 |
| GO:00322061 | Colorectum | SER | positive regulation of telomere maintenance | 20/2897 | 52/18723 | 4.80e-05 | 1.18e-03 | 20 |
| GO:20012521 | Colorectum | SER | positive regulation of chromosome organization | 27/2897 | 82/18723 | 6.44e-05 | 1.49e-03 | 27 |
| GO:00510521 | Colorectum | SER | regulation of DNA metabolic process | 83/2897 | 359/18723 | 8.03e-05 | 1.77e-03 | 83 |
| GO:00322041 | Colorectum | SER | regulation of telomere maintenance | 24/2897 | 80/18723 | 7.57e-04 | 9.73e-03 | 24 |
| GO:19043561 | Colorectum | SER | regulation of telomere maintenance via telomere lengthening | 18/2897 | 61/18723 | 4.02e-03 | 3.30e-02 | 18 |
| GO:00108331 | Colorectum | SER | telomere maintenance via telomere lengthening | 22/2897 | 81/18723 | 4.85e-03 | 3.79e-02 | 22 |
| GO:00007231 | Colorectum | SER | telomere maintenance | 32/2897 | 131/18723 | 4.90e-03 | 3.82e-02 | 32 |
| GO:00510522 | Colorectum | MSS | regulation of DNA metabolic process | 108/3467 | 359/18723 | 5.86e-08 | 3.10e-06 | 108 |
| Page: 1 2 |
| Pathway ID | Tissue | Disease Stage | Description | Gene Ratio | Bg Ratio | pvalue | p.adjust | qvalue | Count |
| Page: 1 |
Top |
Cell-cell communication analysis |
| Identification of potential cell-cell interactions between two cell types and their ligand-receptor pairs for different disease states |
| Ligand | Receptor | LRpair | Pathway | Tissue | Disease Stage |
| Page: 1 |
Top |
Single-cell gene regulatory network inference analysis |
| Find out the significant the regulons (TFs) and the target genes of each regulon across cell types for different disease states |
| TF | Cell Type | Tissue | Disease Stage | Target Gene | RSS | Regulon Activity |
| ∗The dot plots of a searched regulon are shown for all cell subpopulations in each disease state of each tissue based on the regulon specific score inferred using pySCENIC and by calculating the average expression. |
| Page: 1 |
Top |
Somatic mutation of malignant transformation related genes |
| Annotation of somatic variants for genes involved in malignant transformation |
| Hugo Symbol | Variant Class | Variant Classification | dbSNP RS | HGVSc | HGVSp | HGVSp Short | SWISSPROT | BIOTYPE | SIFT | PolyPhen | Tumor Sample Barcode | Tissue | Histology | Sex | Age | Stage | Therapy Types | Drugs | Outcome |
| SLX1A | SNV | Missense_Mutation | novel | c.781N>T | p.Asp261Tyr | p.D261Y | Q9BQ83 | protein_coding | tolerated(0.09) | benign(0.36) | TCGA-A5-A0GG-01 | Endometrium | uterine corpus endometrioid carcinoma | Female | >=65 | I/II | Unknown | Unknown | SD |
| SLX1A | SNV | Missense_Mutation | novel | c.736N>T | p.Asp246Tyr | p.D246Y | Q9BQ83 | protein_coding | deleterious(0) | probably_damaging(0.935) | TCGA-B5-A0JY-01 | Endometrium | uterine corpus endometrioid carcinoma | Female | <65 | III/IV | Chemotherapy | doxorubicin | SD |
| SLX1A | SNV | Missense_Mutation | novel | c.685C>A | p.Leu229Met | p.L229M | Q9BQ83 | protein_coding | deleterious(0) | possibly_damaging(0.903) | TCGA-BS-A0UF-01 | Endometrium | uterine corpus endometrioid carcinoma | Female | >=65 | I/II | Unknown | Unknown | SD |
| SLX1A | SNV | Missense_Mutation | novel | c.794N>G | p.Glu265Gly | p.E265G | Q9BQ83 | protein_coding | deleterious(0.03) | benign(0.217) | TCGA-BS-A0VI-01 | Endometrium | uterine corpus endometrioid carcinoma | Female | <65 | I/II | Unknown | Unknown | SD |
| SLX1A | SNV | Missense_Mutation | novel | c.607C>A | p.Pro203Thr | p.P203T | Q9BQ83 | protein_coding | deleterious(0.04) | benign(0.082) | TCGA-EO-A22R-01 | Endometrium | uterine corpus endometrioid carcinoma | Female | <65 | I/II | Unknown | Unknown | SD |
| SLX1A | SNV | Missense_Mutation | novel | c.656N>G | p.Glu219Gly | p.E219G | Q9BQ83 | protein_coding | tolerated(0.35) | benign(0.017) | TCGA-DD-AACI-01 | Liver | liver hepatocellular carcinoma | Male | >=65 | I/II | Unknown | Unknown | PD |
| Page: 1 |
Top |
Related drugs of malignant transformation related genes |
| Identification of chemicals and drugs interact with genes involved in malignant transfromation |
| (DGIdb 4.0) |
| Entrez ID | Symbol | Category | Interaction Types | Drug Claim Name | Drug Name | PMIDs |
| Page: 1 |

Copyright 2023-Present -The University of Texas Health Science Center at Houston |