Schematic overview of the cellular and molecular mechanisms involved in the cancer progression, including the proposed cellular and molecular mechanisms in cancer cells trajectory. AT1: alveolar type 1 cells; AT2: alveolar type 2 cells; AAH: atypical adenomatous hyperplasia; AIS: adenocarcinoma in situ; MIA: minimally invasive adenocarcinoma; IA: invasive adenocarcinoma; EMT: epithelial-mesenchymal transition

Home

Download

Statistics

Help

Contact

Center for Computational Systems Medicine
leaf

Gene summary

leaf

Malignant transformation analysis

leaf

Malignant transformation related pathway analysis

leaf

Cell-cell communication analysis

leaf

Single-cell gene regulatory network inference analysis

leaf

Somatic mutation of malignant transformation related genes

leaf

Related drugs of malignant transformation related genes

Gene: SLTM

Gene summary for SLTM

check button Gene summary.

Gene informationSpeciesHuman
Gene symbol

SLTM

Gene ID

79811

Gene nameSAFB like transcription modulator
Gene AliasMet
Cytomap15q22.1
Gene Typeprotein-coding
GO ID

GO:0006139

UniProtAcc

Q9NWH9


Top

Malignant transformation analysis

check button Identification of the aberrant gene expression in precancerous and cancerous lesions by comparing the gene expression of stem-like cells in diseased tissues with normal stem cells
check button Malignant transformation involving gene list.
Entrez IDSymbolReplicatesSpeciesOrganTissueAdj P-valueLog2FCMalignancy
79811SLTMHTA11_3410_2000001011HumanColorectumAD2.75e-21-6.90e-010.0155
79811SLTMHTA11_2487_2000001011HumanColorectumSER2.79e-06-5.38e-01-0.1808
79811SLTMHTA11_3361_2000001011HumanColorectumAD1.45e-04-5.52e-01-0.1207
79811SLTMHTA11_83_2000001011HumanColorectumSER1.66e-03-4.78e-01-0.1526
79811SLTMHTA11_696_2000001011HumanColorectumAD3.48e-11-5.22e-01-0.1464
79811SLTMHTA11_866_2000001011HumanColorectumAD7.86e-14-5.17e-01-0.1001
79811SLTMHTA11_1391_2000001011HumanColorectumAD4.55e-02-3.94e-01-0.059
79811SLTMHTA11_5212_2000001011HumanColorectumAD1.97e-02-6.40e-01-0.2061
79811SLTMHTA11_7862_2000001011HumanColorectumAD2.96e-02-5.35e-01-0.0179
79811SLTMHTA11_866_3004761011HumanColorectumAD2.68e-09-4.73e-010.096
79811SLTMHTA11_8622_2000001021HumanColorectumSER7.07e-03-6.48e-010.0528
79811SLTMHTA11_10711_2000001011HumanColorectumAD5.68e-07-5.85e-010.0338
79811SLTMHTA11_7696_3000711011HumanColorectumAD4.57e-08-4.46e-010.0674
79811SLTMHTA11_6818_2000001021HumanColorectumAD1.62e-03-5.45e-010.0588
79811SLTMHTA11_99999971662_82457HumanColorectumMSS4.49e-06-4.67e-010.3859
79811SLTMHTA11_99999973899_84307HumanColorectumMSS5.27e-04-5.19e-010.2585
79811SLTMHTA11_99999974143_84620HumanColorectumMSS5.03e-19-6.01e-010.3005
79811SLTMA015-C-203HumanColorectumFAP3.06e-22-1.93e-01-0.1294
79811SLTMA015-C-204HumanColorectumFAP9.61e-034.04e-02-0.0228
79811SLTMA002-C-201HumanColorectumFAP2.32e-09-7.90e-020.0324
Page: 1 2 3 4 5 6 7 8 9 10 11 

check button Transcriptomic changes along malignancy continuum.
TissueExpression DynamicsAbbreviation
Colorectum (GSE201348)The image shows the transcriptomic changes along malignancy continuum.log2FC in expression of this searched gene in stem-like cells from each diseased tissue sample relative to stem-like cells in normal samples in each tissue plotted against the malignancy continuum. Samples are colored based on if they are from different disease stage.FAP: Familial adenomatous polyposis
CRC: Colorectal cancer
Colorectum (HTA11)The image shows the transcriptomic changes along malignancy continuum.log2FC in expression of this searched gene in stem-like cells from each diseased tissue sample relative to stem-like cells in normal samples in each tissue plotted against the malignancy continuum. Samples are colored based on if they are from different disease stage.AD: Adenomas
SER: Sessile serrated lesions
MSI-H: Microsatellite-high colorectal cancer
MSS: Microsatellite stable colorectal cancer
EsophagusThe image shows the transcriptomic changes along malignancy continuum.log2FC in expression of this searched gene in stem-like cells from each diseased tissue sample relative to stem-like cells in normal samples in each tissue plotted against the malignancy continuum. Samples are colored based on if they are from different disease stage.ESCC: Esophageal squamous cell carcinoma
HGIN: High-grade intraepithelial neoplasias
LGIN: Low-grade intraepithelial neoplasias
LiverThe image shows the transcriptomic changes along malignancy continuum.log2FC in expression of this searched gene in stem-like cells from each diseased tissue sample relative to stem-like cells in normal samples in each tissue plotted against the malignancy continuum. Samples are colored based on if they are from different disease stage.
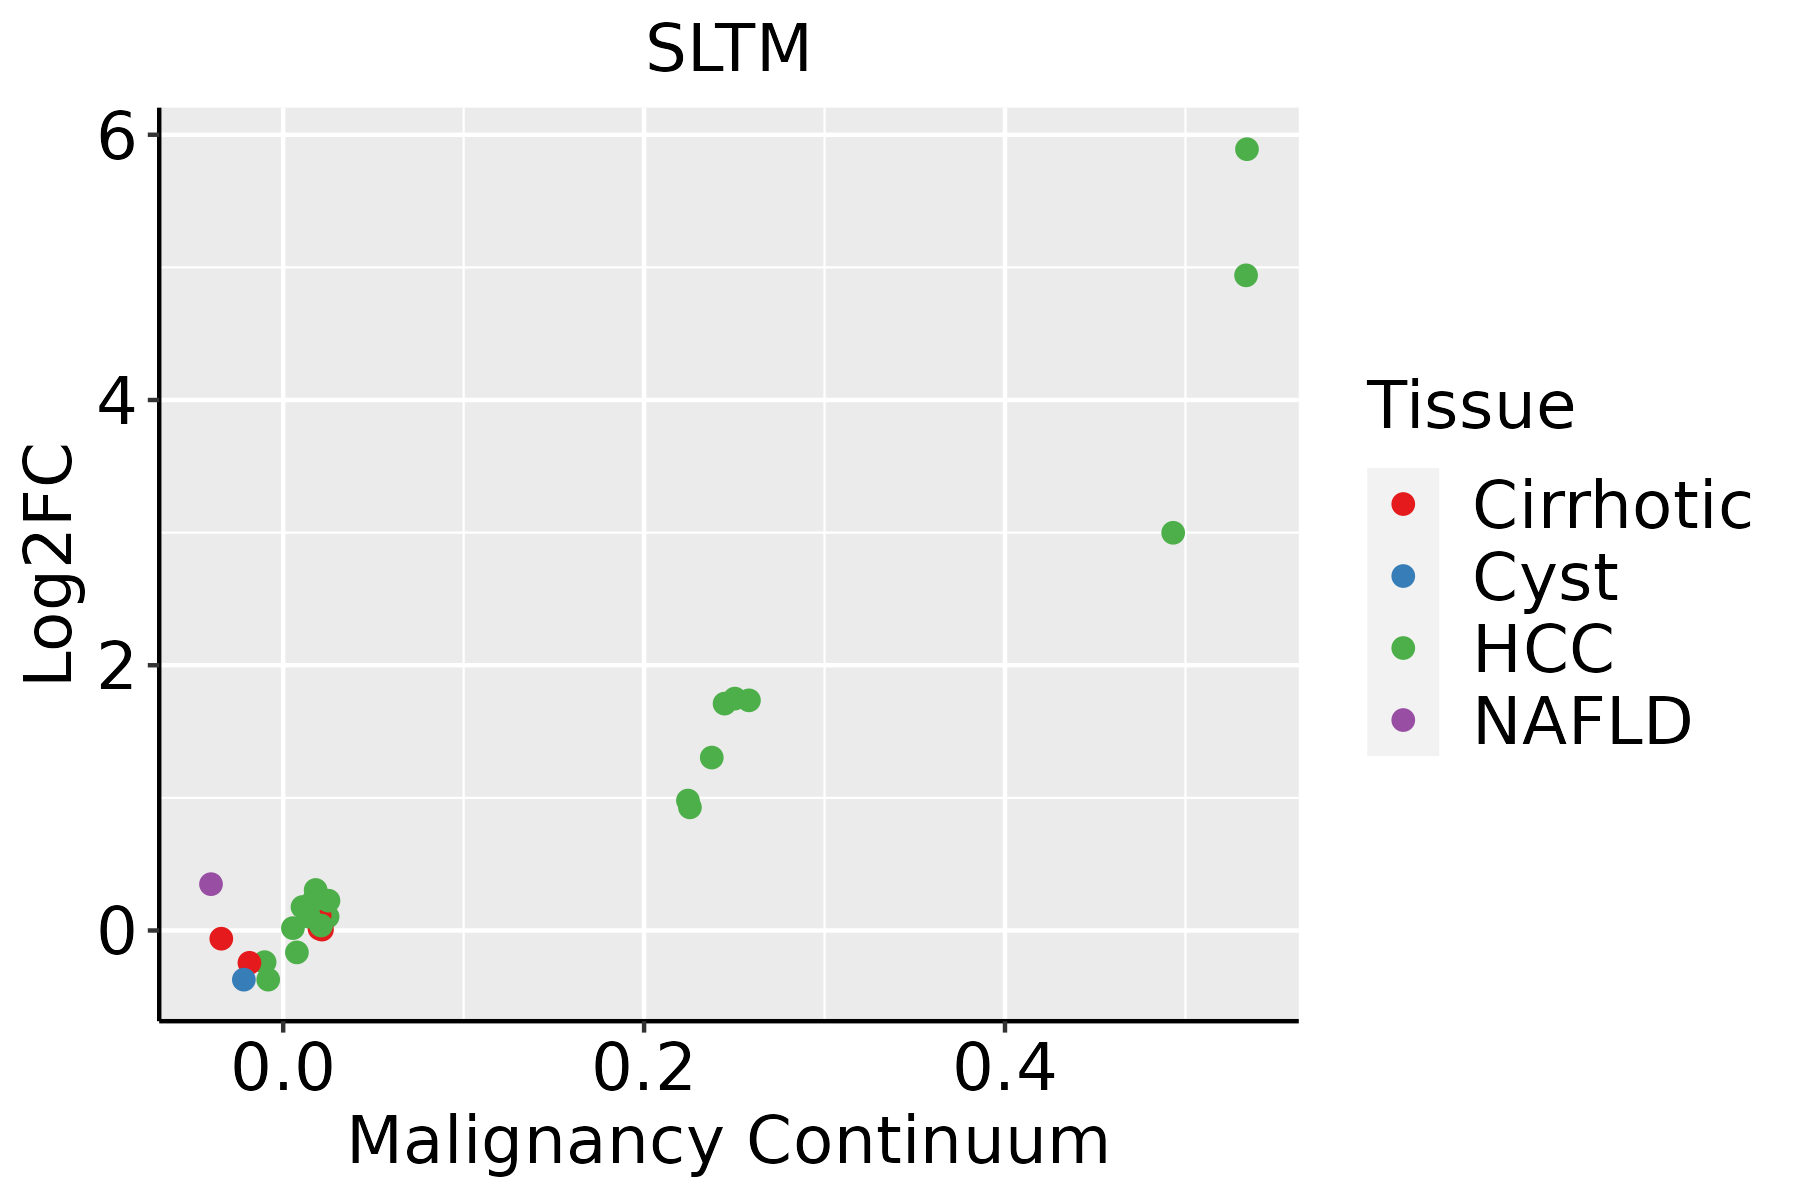
HCC: Hepatocellular carcinoma
NAFLD: Non-alcoholic fatty liver disease
LungThe image shows the transcriptomic changes along malignancy continuum.log2FC in expression of this searched gene in stem-like cells from each diseased tissue sample relative to stem-like cells in normal samples in each tissue plotted against the malignancy continuum. Samples are colored based on if they are from different disease stage.AAH: Atypical adenomatous hyperplasia
AIS: Adenocarcinoma in situ
IAC: Invasive lung adenocarcinoma
MIA: Minimally invasive adenocarcinoma
Oral CavityThe image shows the transcriptomic changes along malignancy continuum.log2FC in expression of this searched gene in stem-like cells from each diseased tissue sample relative to stem-like cells in normal samples in each tissue plotted against the malignancy continuum. Samples are colored based on if they are from different disease stage.EOLP: Erosive Oral lichen planus
LP: leukoplakia
NEOLP: Non-erosive oral lichen planus
OSCC: Oral squamous cell carcinoma
ProstateThe image shows the transcriptomic changes along malignancy continuum.log2FC in expression of this searched gene in stem-like cells from each diseased tissue sample relative to stem-like cells in normal samples in each tissue plotted against the malignancy continuum. Samples are colored based on if they are from different disease stage.
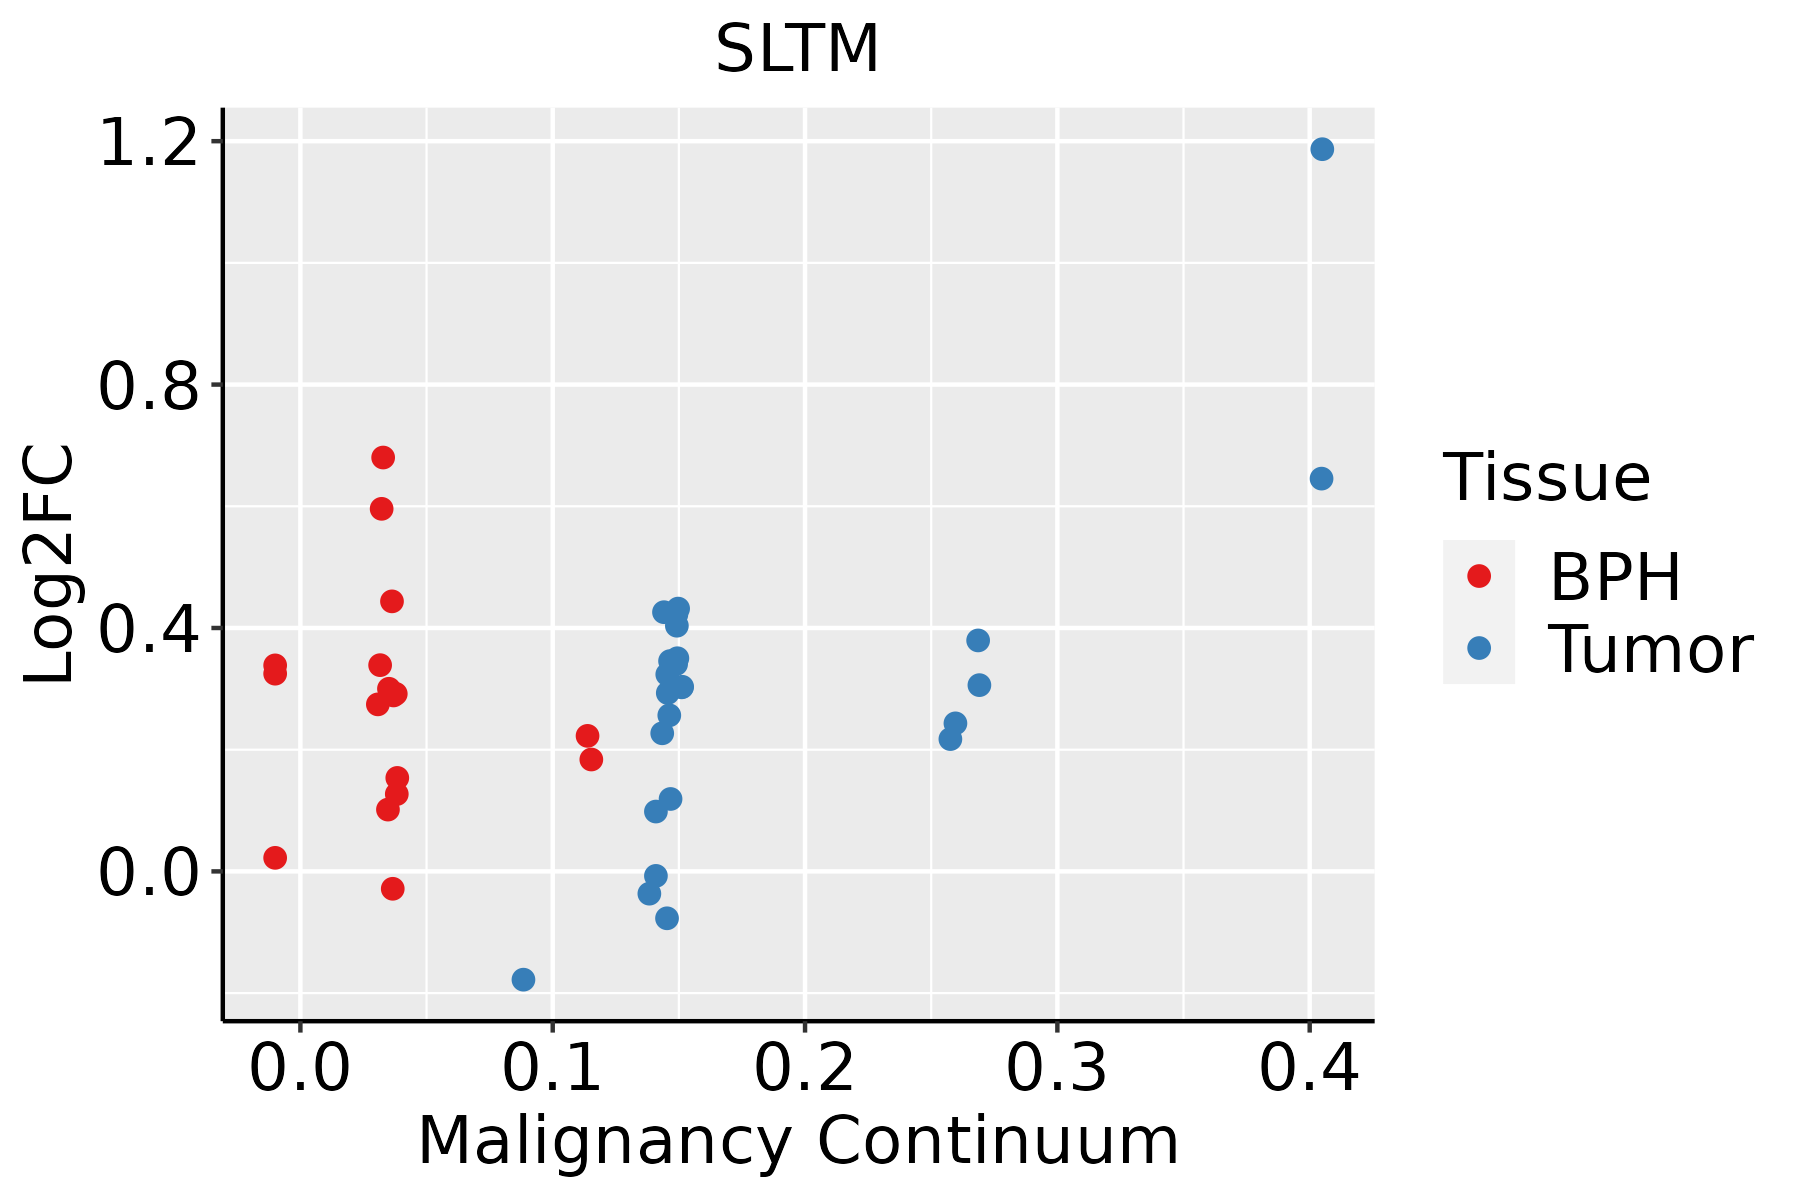
BPH: Benign Prostatic Hyperplasia
SkinThe image shows the transcriptomic changes along malignancy continuum.log2FC in expression of this searched gene in stem-like cells from each diseased tissue sample relative to stem-like cells in normal samples in each tissue plotted against the malignancy continuum. Samples are colored based on if they are from different disease stage.
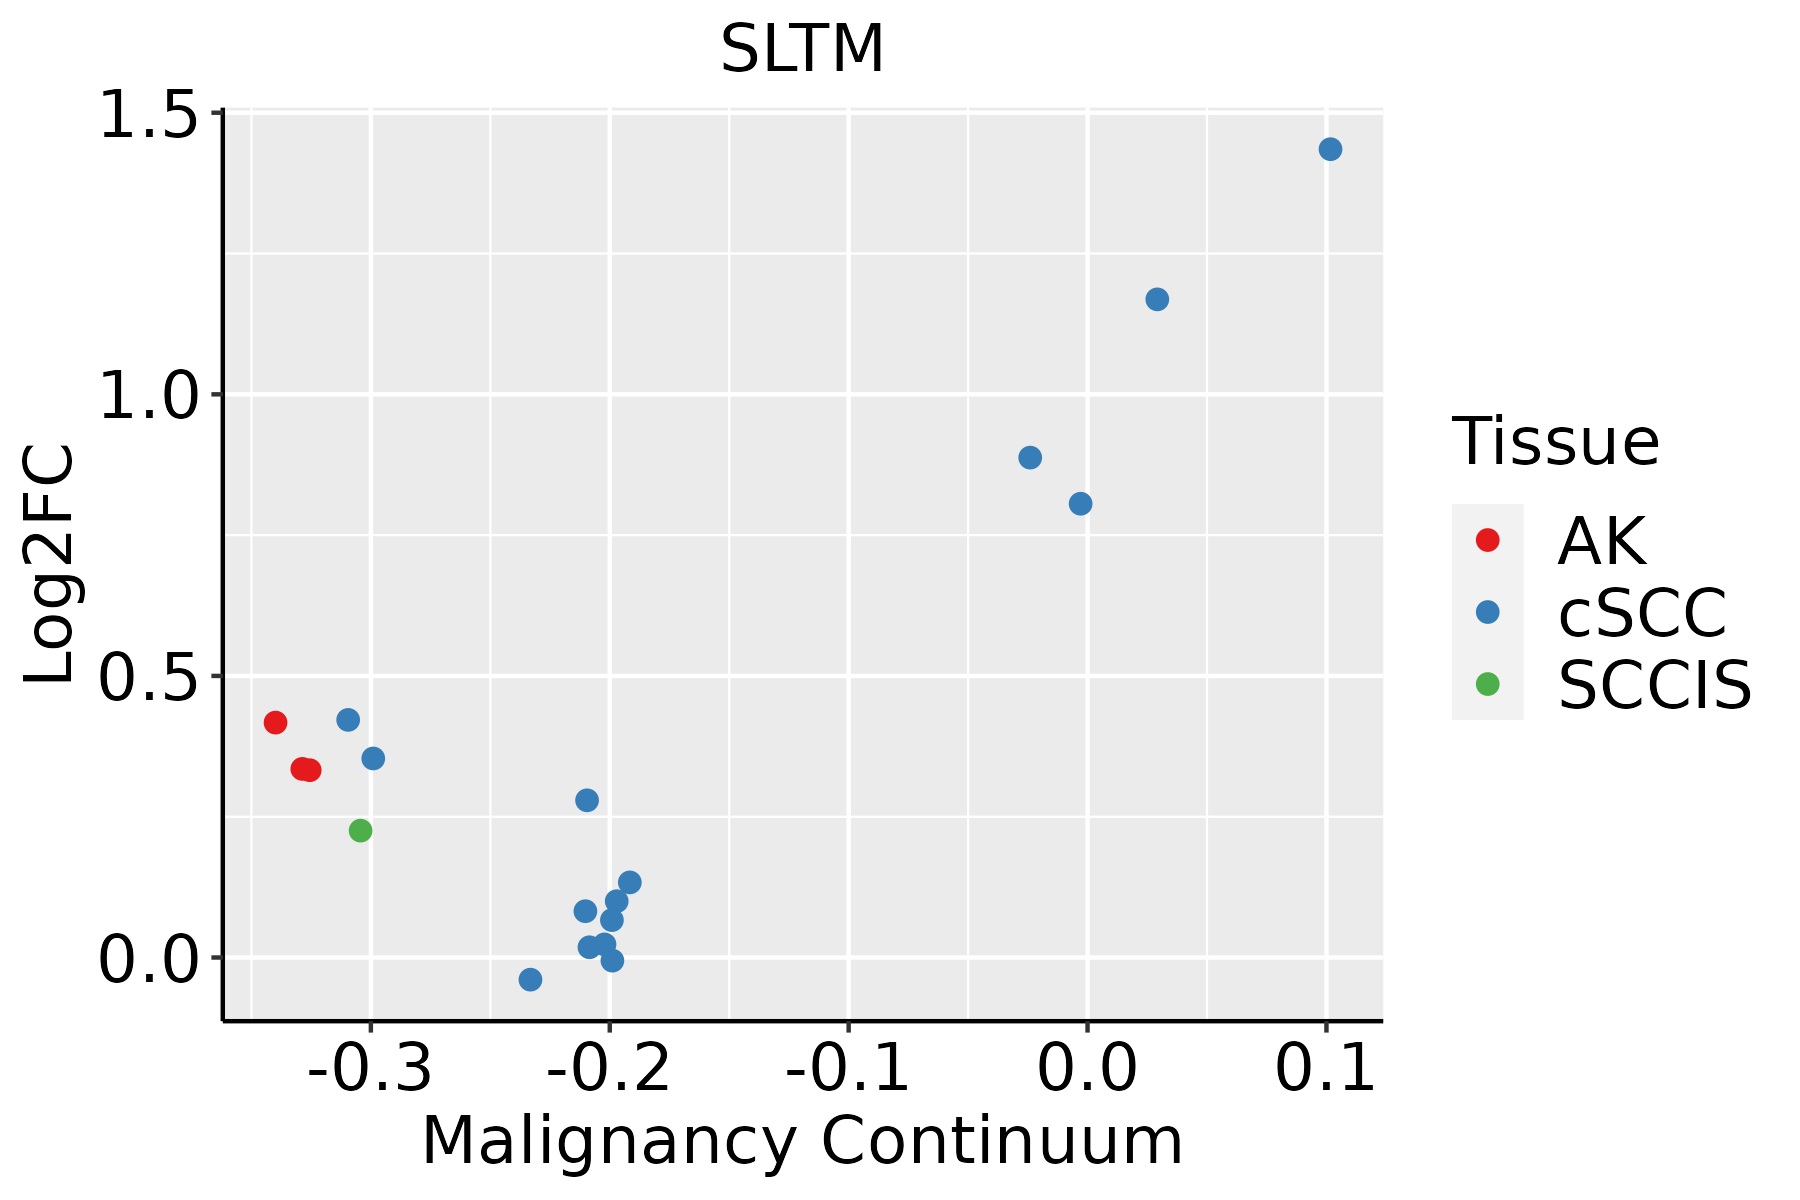
AK: Actinic keratosis
cSCC: Cutaneous squamous cell carcinoma
SCCIS:squamous cell carcinoma in situ
ThyroidThe image shows the transcriptomic changes along malignancy continuum.log2FC in expression of this searched gene in stem-like cells from each diseased tissue sample relative to stem-like cells in normal samples in each tissue plotted against the malignancy continuum. Samples are colored based on if they are from different disease stage.
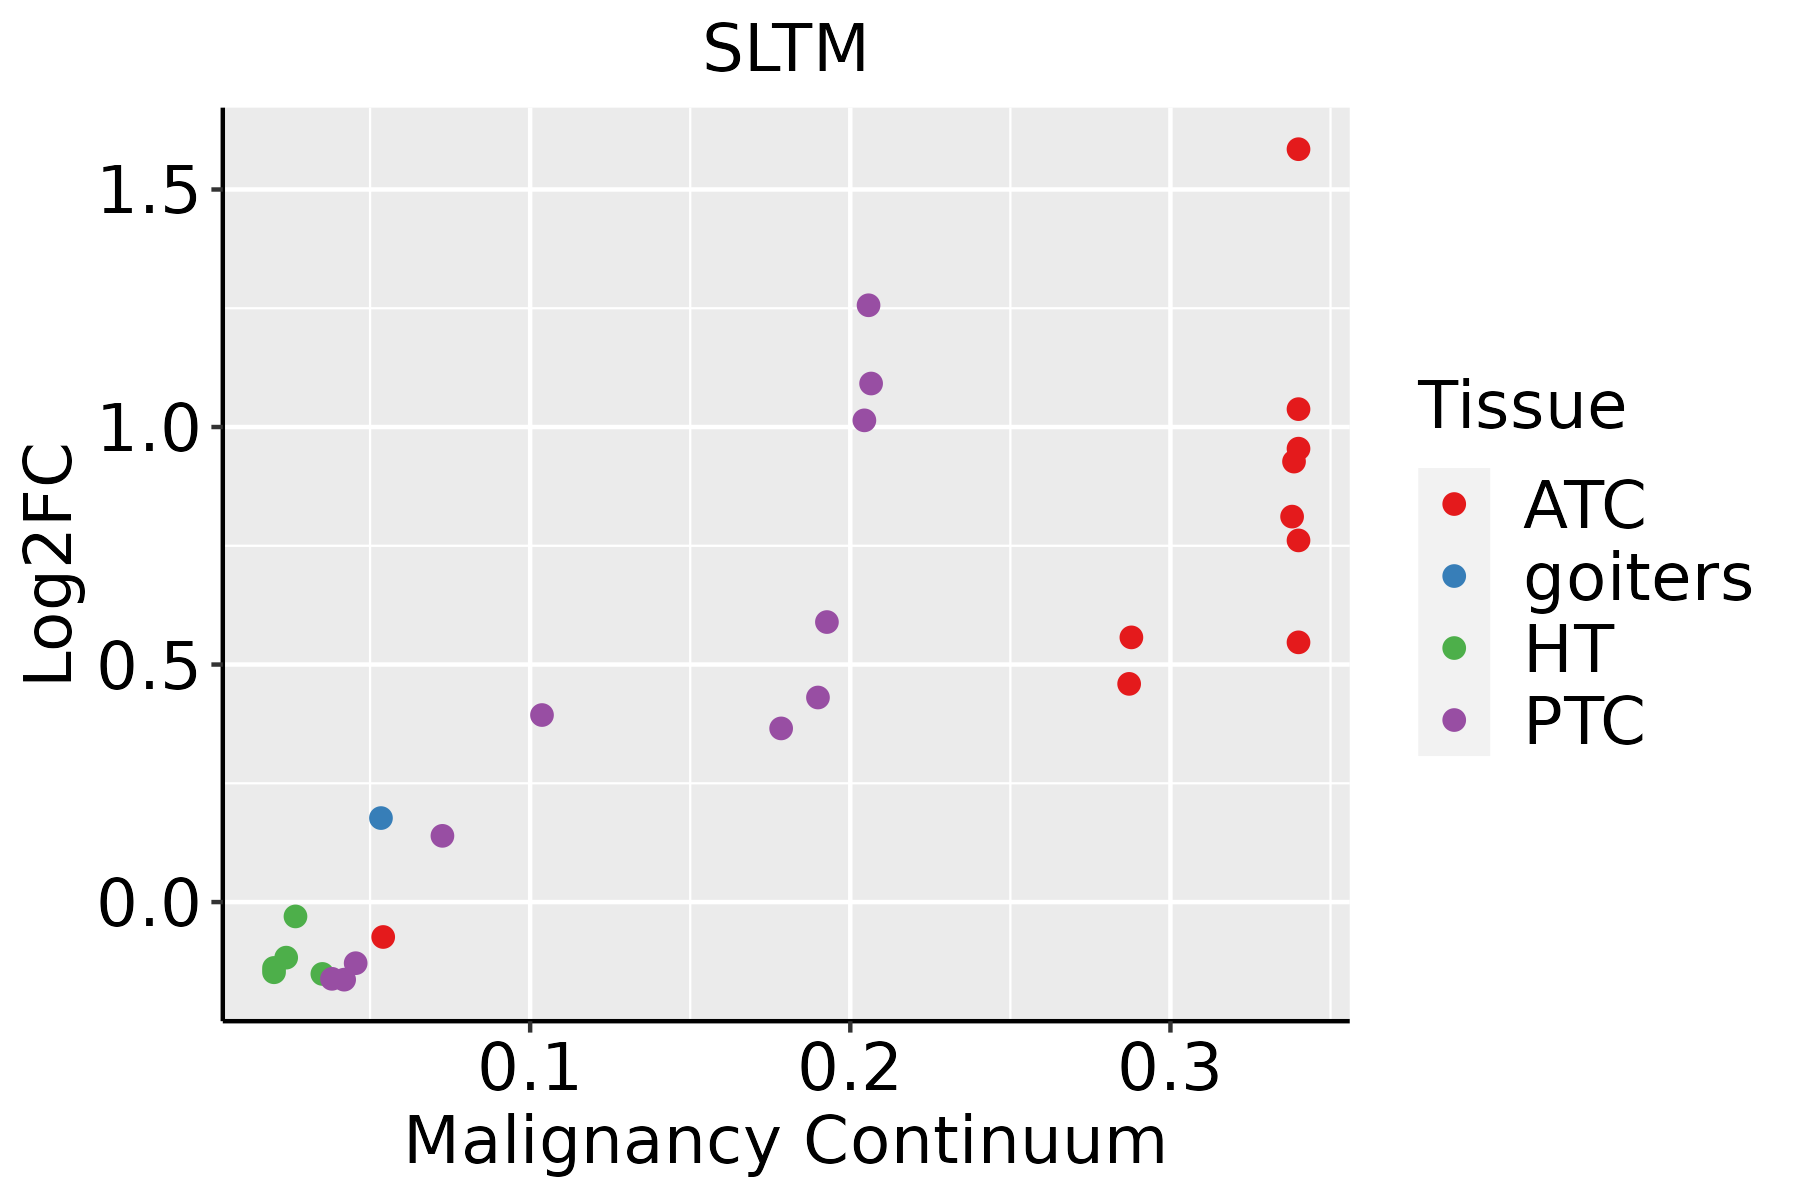
ATC: Anaplastic thyroid cancer
HT: Hashimoto's thyroiditis
PTC: Papillary thyroid cancer
∗log2FC in expression of this searched gene in stem-like cells from each diseased tissue sample relative to stem-like cells in normal samples in each tissue plotted against the malignancy continuum. Samples are colored based on if they are from different disease stage.

Top

Malignant transformation related pathway analysis

check buttonFind out the enriched GO biological processes and KEGG pathways involved in transition from healthy to precancer to cancer
check button Figure of enriched GO biological processes.
TissueDisease StageEnriched GO biological Processes
ColorectumADGO analysis - Figure of enriched GO biological processes: Top 15 enriched GO BP terms are showed in the bar plot of each disease state in each tissue. Each row represents a significant GO biological process which is colored according to the -log10(p.adjust).
ColorectumSERGO analysis - Figure of enriched GO biological processes: Top 15 enriched GO BP terms are showed in the bar plot of each disease state in each tissue. Each row represents a significant GO biological process which is colored according to the -log10(p.adjust).
ColorectumMSSGO analysis - Figure of enriched GO biological processes: Top 15 enriched GO BP terms are showed in the bar plot of each disease state in each tissue. Each row represents a significant GO biological process which is colored according to the -log10(p.adjust).
ColorectumMSI-HGO analysis - Figure of enriched GO biological processes: Top 15 enriched GO BP terms are showed in the bar plot of each disease state in each tissue. Each row represents a significant GO biological process which is colored according to the -log10(p.adjust).
ColorectumFAPGO analysis - Figure of enriched GO biological processes: Top 15 enriched GO BP terms are showed in the bar plot of each disease state in each tissue. Each row represents a significant GO biological process which is colored according to the -log10(p.adjust).
∗Top 15 enriched GO BP terms are showed in the bar plot of each disease state in each tissue. Each row represents a significant GO biological process which is colored according to the -log10(p.adjust).
Page: 1 2 3 4 5 6 7 8 9 

check button Enriched GO biological processes.
GO IDTissueDisease StageDescriptionGene RatioBg Ratiopvaluep.adjustCount
GO:1903311ColorectumADregulation of mRNA metabolic process117/3918288/187231.69e-144.23e-12117
GO:0050684ColorectumADregulation of mRNA processing61/3918137/187234.23e-103.58e-0861
GO:19033111ColorectumSERregulation of mRNA metabolic process78/2897288/187232.61e-071.43e-0578
GO:00506841ColorectumSERregulation of mRNA processing42/2897137/187235.57e-062.01e-0442
GO:19033112ColorectumMSSregulation of mRNA metabolic process115/3467288/187231.23e-176.41e-15115
GO:00506842ColorectumMSSregulation of mRNA processing57/3467137/187232.88e-102.68e-0857
GO:19033114ColorectumFAPregulation of mRNA metabolic process97/2622288/187231.35e-174.13e-1497
GO:00506844ColorectumFAPregulation of mRNA processing51/2622137/187239.70e-124.96e-0951
GO:19033115ColorectumCRCregulation of mRNA metabolic process80/2078288/187233.21e-156.40e-1280
GO:00506845ColorectumCRCregulation of mRNA processing41/2078137/187231.57e-095.23e-0741
GO:190331120EsophagusHGINregulation of mRNA metabolic process91/2587288/187235.06e-159.78e-1391
GO:005068419EsophagusHGINregulation of mRNA processing55/2587137/187232.17e-143.94e-1255
GO:1903311110EsophagusESCCregulation of mRNA metabolic process210/8552288/187233.25e-215.56e-19210
GO:0050684110EsophagusESCCregulation of mRNA processing109/8552137/187233.51e-162.59e-14109
GO:19033116LiverNAFLDregulation of mRNA metabolic process66/1882288/187231.06e-102.96e-0866
GO:00506846LiverNAFLDregulation of mRNA processing33/1882137/187231.47e-066.73e-0533
GO:190331111LiverCirrhoticregulation of mRNA metabolic process140/4634288/187231.07e-181.91e-16140
GO:005068411LiverCirrhoticregulation of mRNA processing81/4634137/187231.05e-171.60e-1581
GO:190331121LiverHCCregulation of mRNA metabolic process205/7958288/187233.38e-236.90e-21205
GO:005068421LiverHCCregulation of mRNA processing106/7958137/187237.64e-177.12e-15106
Page: 1 2 3 

check button Enriched KEGG pathways.
Pathway IDTissueDisease StageDescriptionGene RatioBg Ratiopvaluep.adjustqvalueCount
Page: 1 

Top

Cell-cell communication analysis

check buttonIdentification of potential cell-cell interactions between two cell types and their ligand-receptor pairs for different disease states
LigandReceptorLRpairPathwayTissueDisease Stage
Page: 1 

Top

Single-cell gene regulatory network inference analysis

check buttonFind out the significant the regulons (TFs) and the target genes of each regulon across cell types for different disease states
TFCell TypeTissueDisease StageTarget GeneRSSRegulon Activity
∗The dot plots of a searched regulon are shown for all cell subpopulations in each disease state of each tissue based on the regulon specific score inferred using pySCENIC and by calculating the average expression.
Page: 1 

Top

Somatic mutation of malignant transformation related genes

check buttonAnnotation of somatic variants for genes involved in malignant transformation
Hugo SymbolVariant ClassVariant ClassificationdbSNP RSHGVScHGVSpHGVSp ShortSWISSPROTBIOTYPESIFTPolyPhenTumor Sample BarcodeTissueHistologySexAgeStageTherapy TypesDrugsOutcome
SLTMSNVMissense_Mutationc.507N>Tp.Glu169Aspp.E169DQ9NWH9protein_codingtolerated(0.36)benign(0)TCGA-A2-A0CM-01Breastbreast invasive carcinomaFemale<65I/IIChemotherapyadriamycinPD
SLTMSNVMissense_Mutationnovelc.2596N>Tp.His866Tyrp.H866YQ9NWH9protein_codingdeleterious(0.03)probably_damaging(0.977)TCGA-BH-A0B6-01Breastbreast invasive carcinomaFemale<65I/IIUnknownUnknownSD
SLTMSNVMissense_Mutationc.1277N>Ap.Cys426Tyrp.C426YQ9NWH9protein_codingdeleterious(0.01)probably_damaging(0.999)TCGA-BH-A204-01Breastbreast invasive carcinomaFemale>=65I/IIUnknownUnknownSD
SLTMSNVMissense_Mutationrs775663177c.2377C>Tp.Arg793Trpp.R793WQ9NWH9protein_codingdeleterious(0)probably_damaging(0.996)TCGA-E9-A5UO-01Breastbreast invasive carcinomaFemale<65I/IIUnknownUnknownSD
SLTMSNVMissense_Mutationnovelc.1360N>Ap.Leu454Metp.L454MQ9NWH9protein_codingtolerated(0.22)benign(0.025)TCGA-GM-A2DL-01Breastbreast invasive carcinomaFemale<65I/IIHormone TherapytamoxiphenCR
SLTMSNVMissense_Mutationnovelc.1018N>Gp.Lys340Glup.K340EQ9NWH9protein_codingdeleterious(0.04)probably_damaging(0.985)TCGA-JL-A3YW-01Breastbreast invasive carcinomaFemale<65I/IIUnknownUnknownSD
SLTMinsertionIn_Frame_Insnovelc.1306_1307insGTAAGAAAATAAp.Ser435_Thr436insSerLysLysIlep.S435_T436insSKKIQ9NWH9protein_codingTCGA-A8-A0A1-01Breastbreast invasive carcinomaFemale>=65I/IIHormone TherapytamoxiphenSD
SLTMinsertionIn_Frame_Insnovelc.1324_1325insAAAATAAATCCTTACp.Ile442delinsLysAsnLysSerLeuLeup.I442delinsKNKSLLQ9NWH9protein_codingTCGA-AR-A0TU-01Breastbreast invasive carcinomaFemale<65I/IIUnspecificDoxorubicinSD
SLTMinsertionFrame_Shift_Insnovelc.1530_1531insCCTGGACTCTTGGAACCTAAGGp.Glu511ProfsTer16p.E511Pfs*16Q9NWH9protein_codingTCGA-AR-A0U0-01Breastbreast invasive carcinomaFemale>=65I/IIUnknownUnknownSD
SLTMinsertionNonsense_Mutationnovelc.403_404insGAAAAAAGCCTTAAAACTTp.Glu135GlyfsTer5p.E135Gfs*5Q9NWH9protein_codingTCGA-AR-A0U0-01Breastbreast invasive carcinomaFemale>=65I/IIUnknownUnknownSD
Page: 1 2 3 4 5 6 7 8 9 10 11 12 

Top

Related drugs of malignant transformation related genes

check buttonIdentification of chemicals and drugs interact with genes involved in malignant transfromation
(DGIdb 4.0)
Entrez IDSymbolCategoryInteraction TypesDrug Claim NameDrug NamePMIDs
Page: 1