Schematic overview of the cellular and molecular mechanisms involved in the cancer progression, including the proposed cellular and molecular mechanisms in cancer cells trajectory. AT1: alveolar type 1 cells; AT2: alveolar type 2 cells; AAH: atypical adenomatous hyperplasia; AIS: adenocarcinoma in situ; MIA: minimally invasive adenocarcinoma; IA: invasive adenocarcinoma; EMT: epithelial-mesenchymal transition

Home

Download

Statistics

Help

Contact

Center for Computational Systems Medicine
leaf

Gene summary

leaf

Malignant transformation analysis

leaf

Malignant transformation related pathway analysis

leaf

Cell-cell communication analysis

leaf

Single-cell gene regulatory network inference analysis

leaf

Somatic mutation of malignant transformation related genes

leaf

Related drugs of malignant transformation related genes

Gene: SLPI

Gene summary for SLPI

check button Gene summary.

Gene informationSpeciesHuman
Gene symbol

SLPI

Gene ID

6590

Gene namesecretory leukocyte peptidase inhibitor
Gene AliasALK1
Cytomap20q13.12
Gene Typeprotein-coding
GO ID

GO:0002237

UniProtAcc

P03973


Top

Malignant transformation analysis

check button Identification of the aberrant gene expression in precancerous and cancerous lesions by comparing the gene expression of stem-like cells in diseased tissues with normal stem cells
check button Malignant transformation involving gene list.
Entrez IDSymbolReplicatesSpeciesOrganTissueAdj P-valueLog2FCMalignancy
6590SLPIGSM4909281HumanBreastIDC5.55e-27-8.78e-010.21
6590SLPIGSM4909282HumanBreastIDC1.28e-357.90e-01-0.0288
6590SLPIGSM4909285HumanBreastIDC5.52e-346.82e-010.21
6590SLPIGSM4909286HumanBreastIDC4.83e-25-8.48e-010.1081
6590SLPIGSM4909290HumanBreastIDC1.45e-11-6.42e-010.2096
6590SLPIGSM4909291HumanBreastIDC1.49e-27-1.06e+000.1753
6590SLPIGSM4909293HumanBreastIDC7.90e-39-9.47e-010.1581
6590SLPIGSM4909294HumanBreastIDC3.13e-27-8.65e-010.2022
6590SLPIGSM4909296HumanBreastIDC4.37e-04-3.75e-010.1524
6590SLPIGSM4909297HumanBreastIDC7.23e-32-8.91e-010.1517
6590SLPIGSM4909298HumanBreastIDC8.92e-25-7.83e-010.1551
6590SLPIGSM4909300HumanBreastIDC2.90e-127.54e-010.0334
6590SLPIGSM4909301HumanBreastIDC1.26e-52-1.07e+000.1577
6590SLPIGSM4909302HumanBreastIDC2.95e-31-9.29e-010.1545
6590SLPIGSM4909303HumanBreastIDC6.61e-05-7.62e-010.0438
6590SLPIGSM4909304HumanBreastIDC1.41e-37-9.72e-010.1636
6590SLPIGSM4909306HumanBreastIDC1.84e-19-7.32e-010.1564
6590SLPIGSM4909307HumanBreastIDC2.03e-12-4.22e-010.1569
6590SLPIGSM4909308HumanBreastIDC1.04e-39-1.07e+000.158
6590SLPIGSM4909311HumanBreastIDC2.64e-24-5.97e-010.1534
Page: 1 2 3 4 5 6 7 8 9 10 11 12 13 14 

check button Transcriptomic changes along malignancy continuum.
TissueExpression DynamicsAbbreviation
BreastThe image shows the transcriptomic changes along malignancy continuum.log2FC in expression of this searched gene in stem-like cells from each diseased tissue sample relative to stem-like cells in normal samples in each tissue plotted against the malignancy continuum. Samples are colored based on if they are from different disease stage.
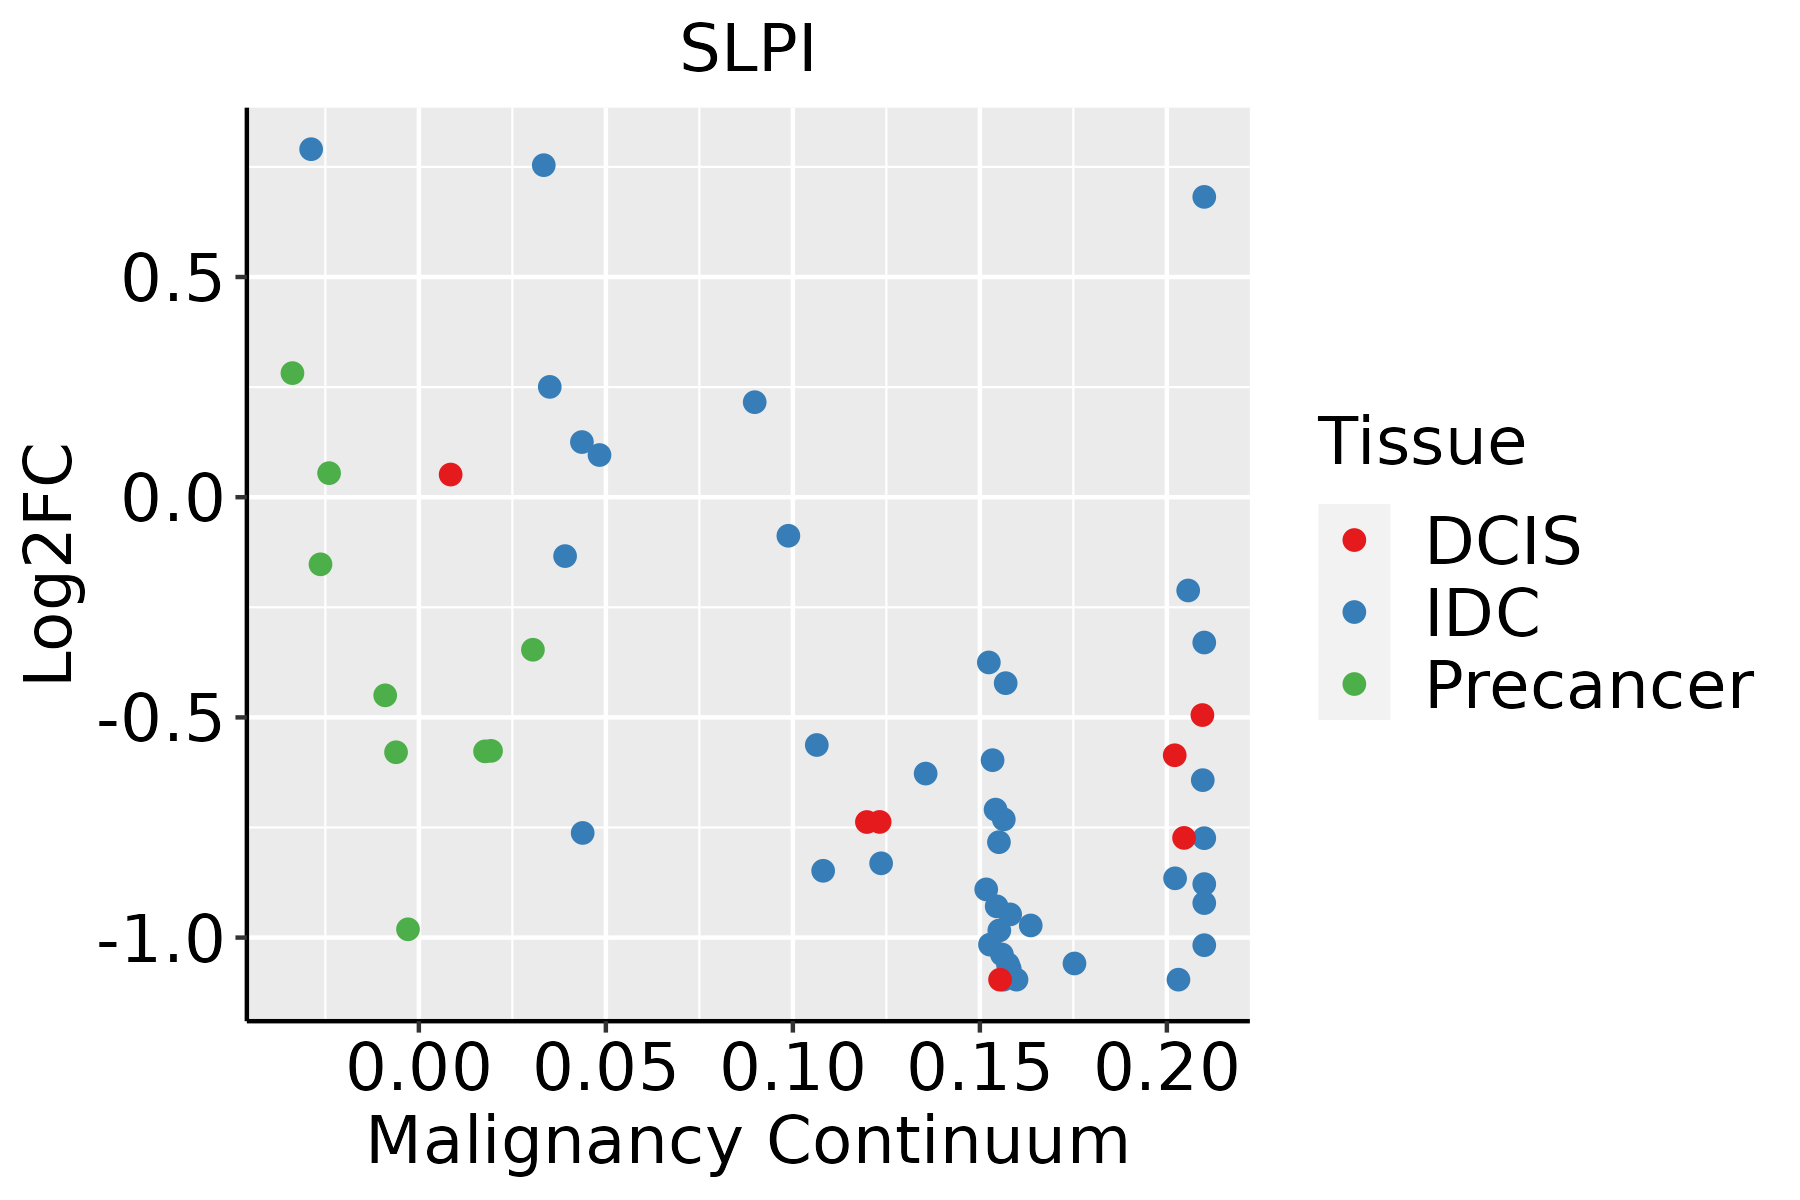
IDC: Invasive ductal carcinoma
DCIS: Ductal carcinoma in situ
Precancer(BRCA1-mut): Precancerous lesion from BRCA1 mutation carriers
CervixThe image shows the transcriptomic changes along malignancy continuum.log2FC in expression of this searched gene in stem-like cells from each diseased tissue sample relative to stem-like cells in normal samples in each tissue plotted against the malignancy continuum. Samples are colored based on if they are from different disease stage.CC: Cervix cancer
HSIL_HPV: HPV-infected high-grade squamous intraepithelial lesions
N_HPV: HPV-infected normal cervix
Colorectum (GSE201348)The image shows the transcriptomic changes along malignancy continuum.log2FC in expression of this searched gene in stem-like cells from each diseased tissue sample relative to stem-like cells in normal samples in each tissue plotted against the malignancy continuum. Samples are colored based on if they are from different disease stage.FAP: Familial adenomatous polyposis
CRC: Colorectal cancer
Colorectum (HTA11)The image shows the transcriptomic changes along malignancy continuum.log2FC in expression of this searched gene in stem-like cells from each diseased tissue sample relative to stem-like cells in normal samples in each tissue plotted against the malignancy continuum. Samples are colored based on if they are from different disease stage.AD: Adenomas
SER: Sessile serrated lesions
MSI-H: Microsatellite-high colorectal cancer
MSS: Microsatellite stable colorectal cancer
EndometriumThe image shows the transcriptomic changes along malignancy continuum.log2FC in expression of this searched gene in stem-like cells from each diseased tissue sample relative to stem-like cells in normal samples in each tissue plotted against the malignancy continuum. Samples are colored based on if they are from different disease stage.
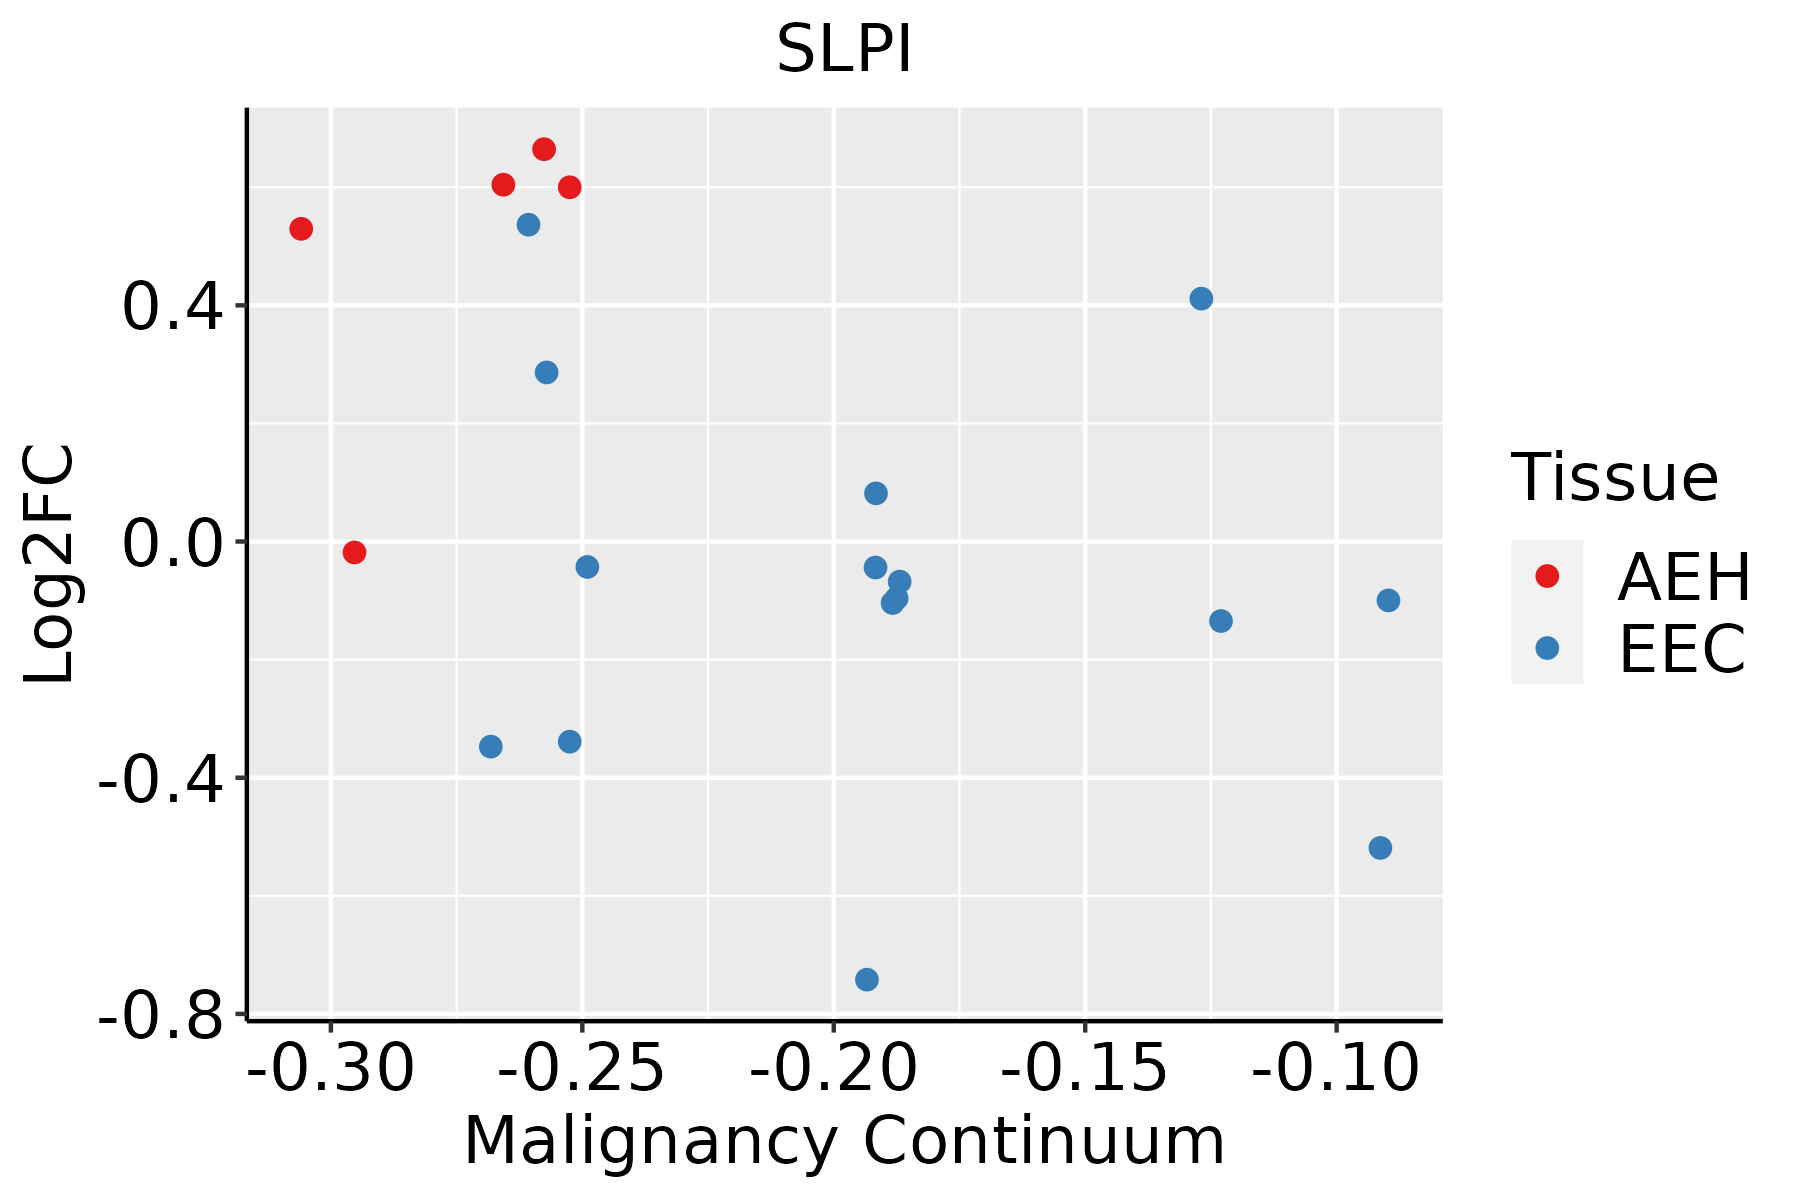
AEH: Atypical endometrial hyperplasia
EEC: Endometrioid Cancer
EsophagusThe image shows the transcriptomic changes along malignancy continuum.log2FC in expression of this searched gene in stem-like cells from each diseased tissue sample relative to stem-like cells in normal samples in each tissue plotted against the malignancy continuum. Samples are colored based on if they are from different disease stage.
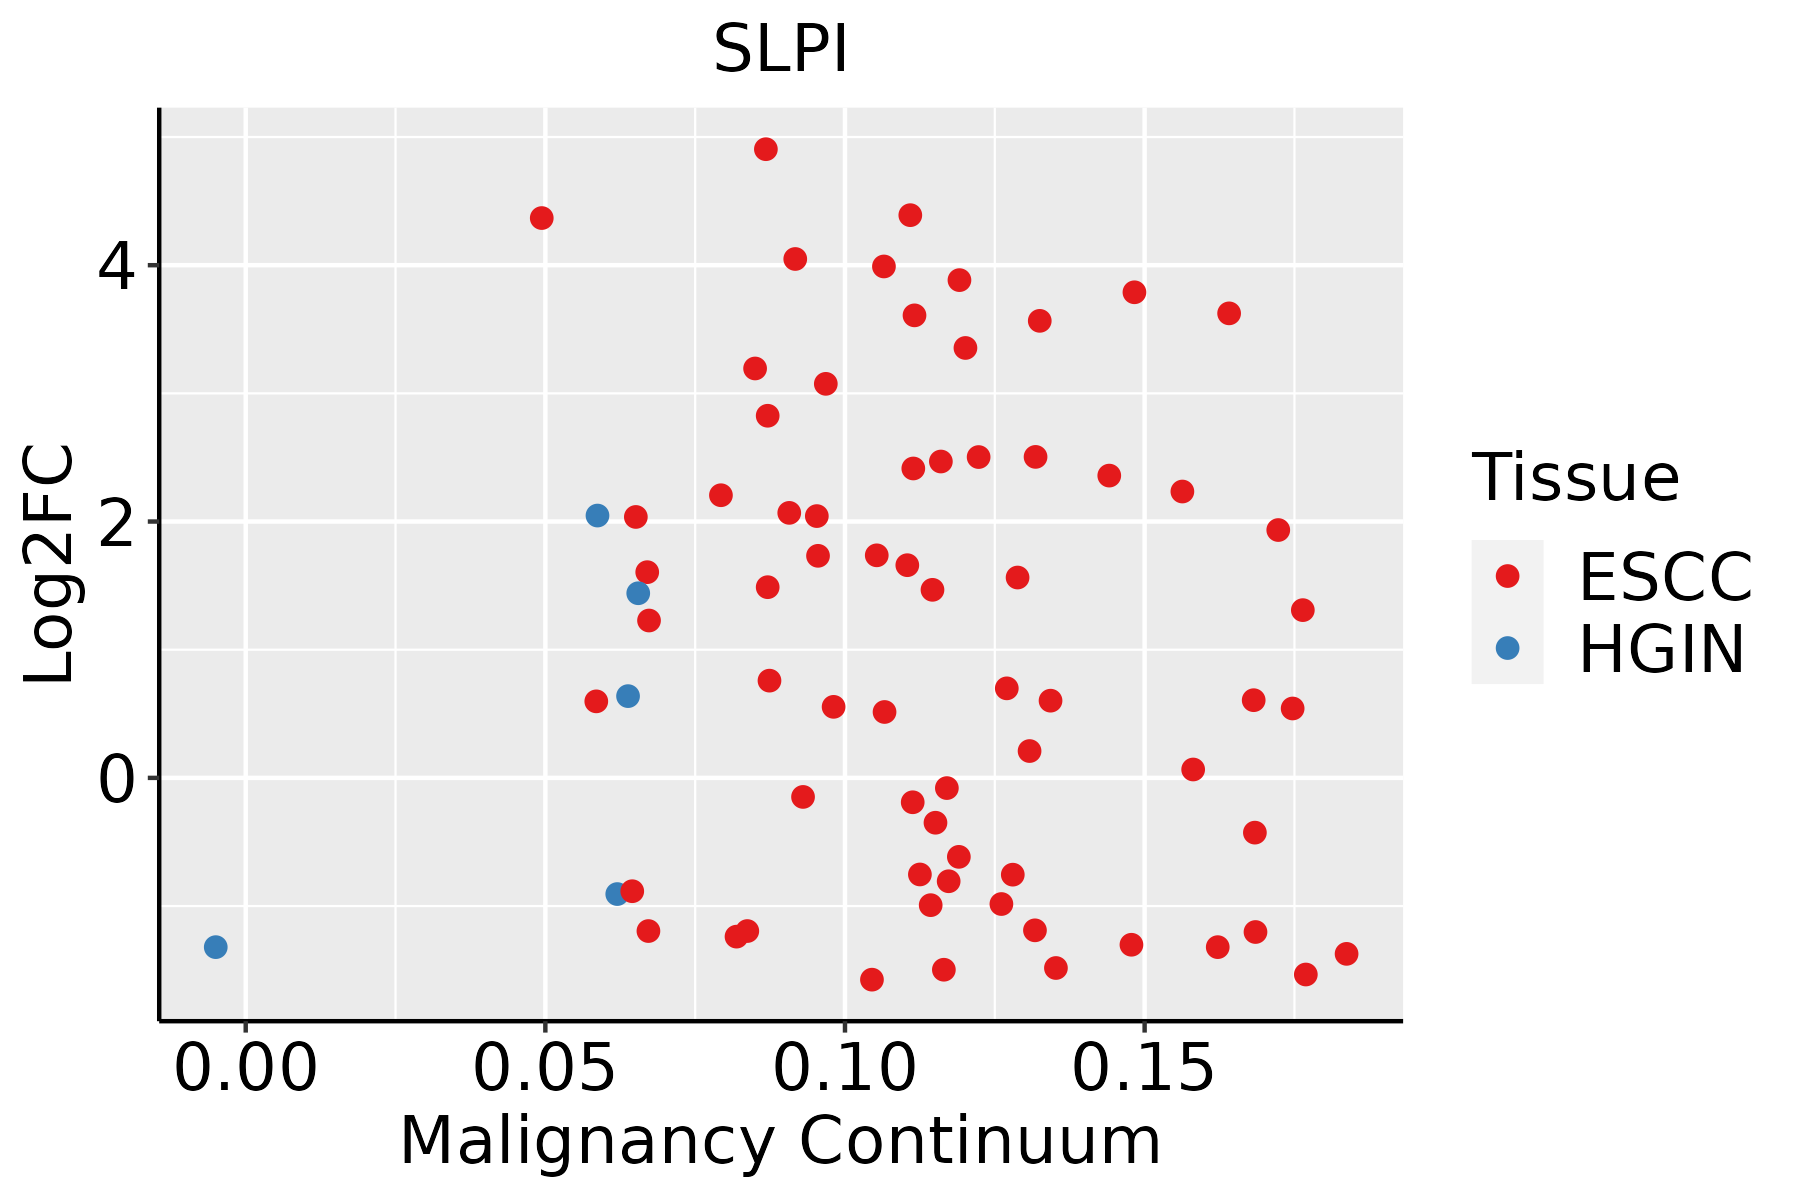
ESCC: Esophageal squamous cell carcinoma
HGIN: High-grade intraepithelial neoplasias
LGIN: Low-grade intraepithelial neoplasias
GCThe image shows the transcriptomic changes along malignancy continuum.log2FC in expression of this searched gene in stem-like cells from each diseased tissue sample relative to stem-like cells in normal samples in each tissue plotted against the malignancy continuum. Samples are colored based on if they are from different disease stage.
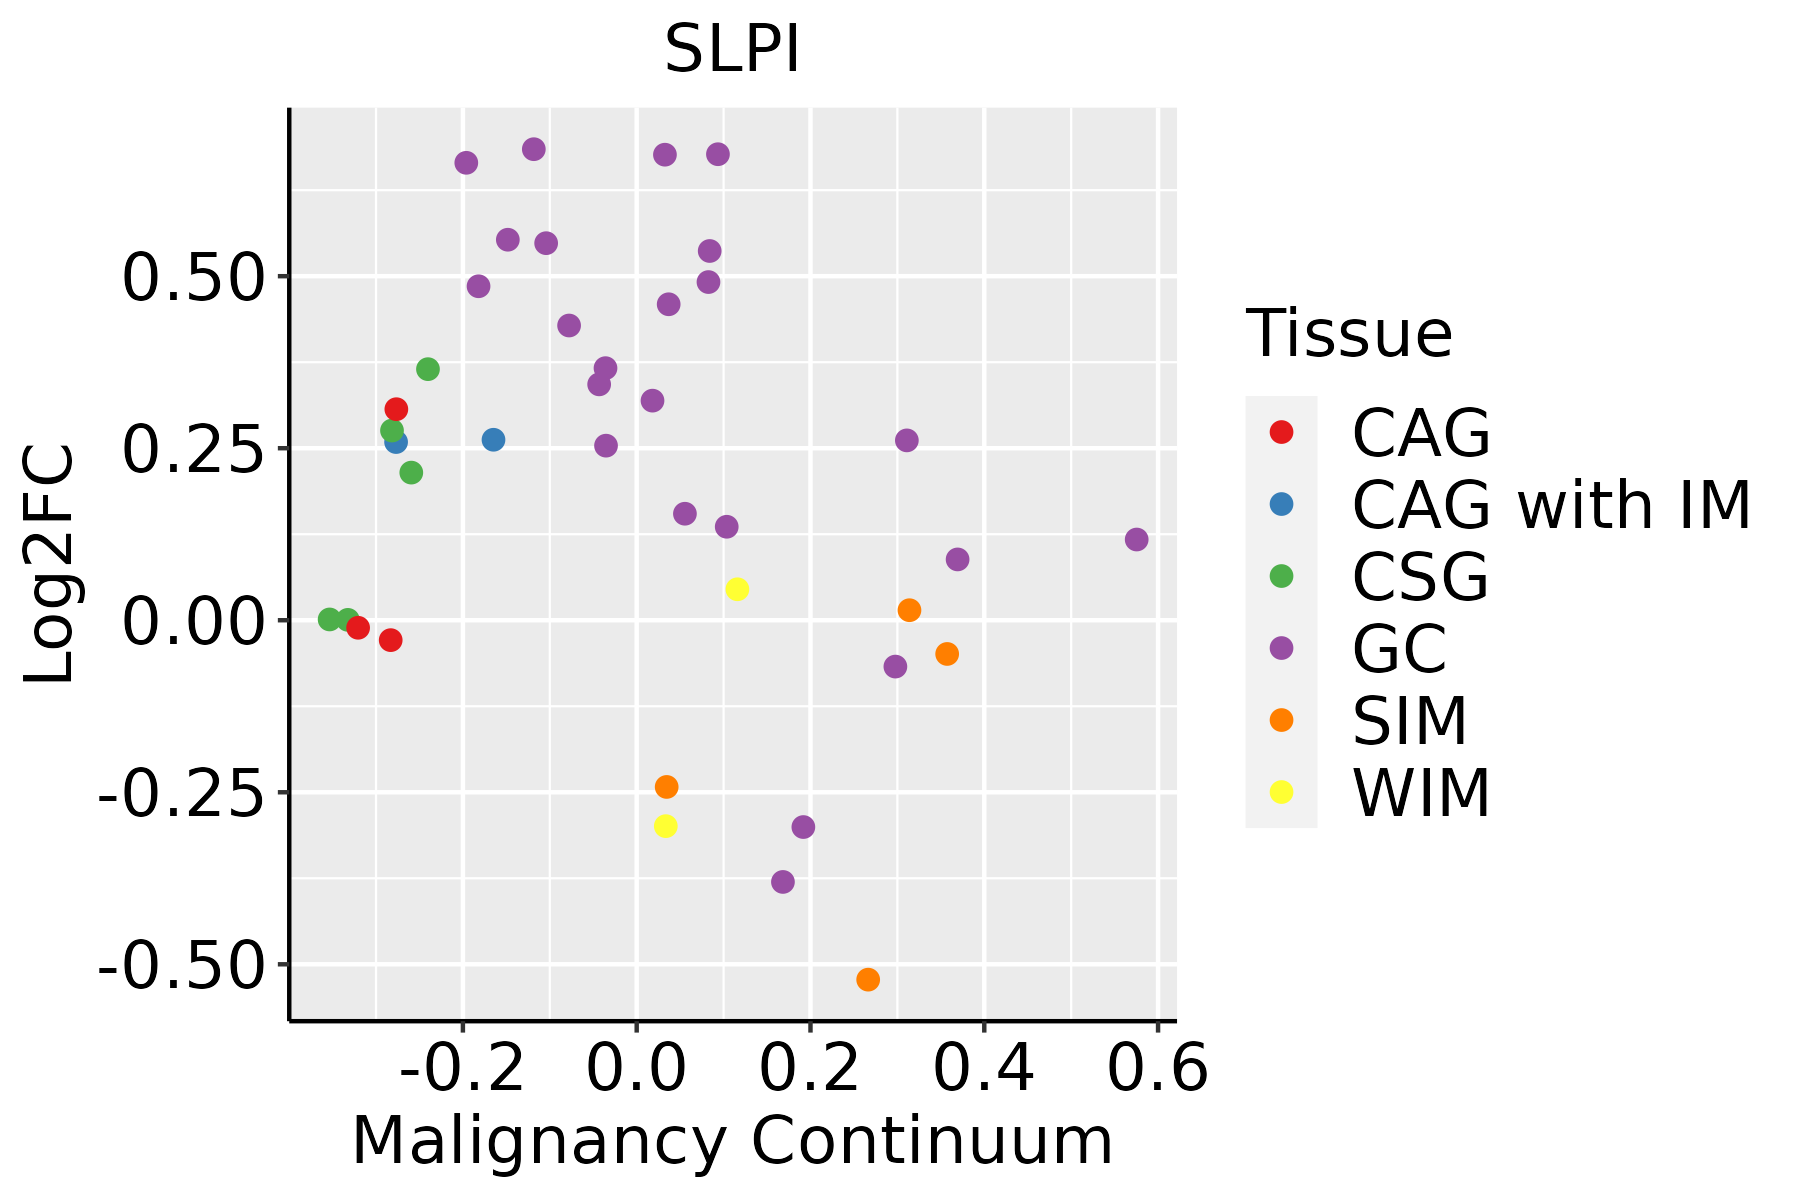
CAG: Chronic atrophic gastritis
CAG with IM: Chronic atrophic gastritis with intestinal metaplasia
CSG: Chronic superficial gastritis
GC: Gastric cancer
SIM: Severe intestinal metaplasia
WIM: Wild intestinal metaplasia
LiverThe image shows the transcriptomic changes along malignancy continuum.log2FC in expression of this searched gene in stem-like cells from each diseased tissue sample relative to stem-like cells in normal samples in each tissue plotted against the malignancy continuum. Samples are colored based on if they are from different disease stage.
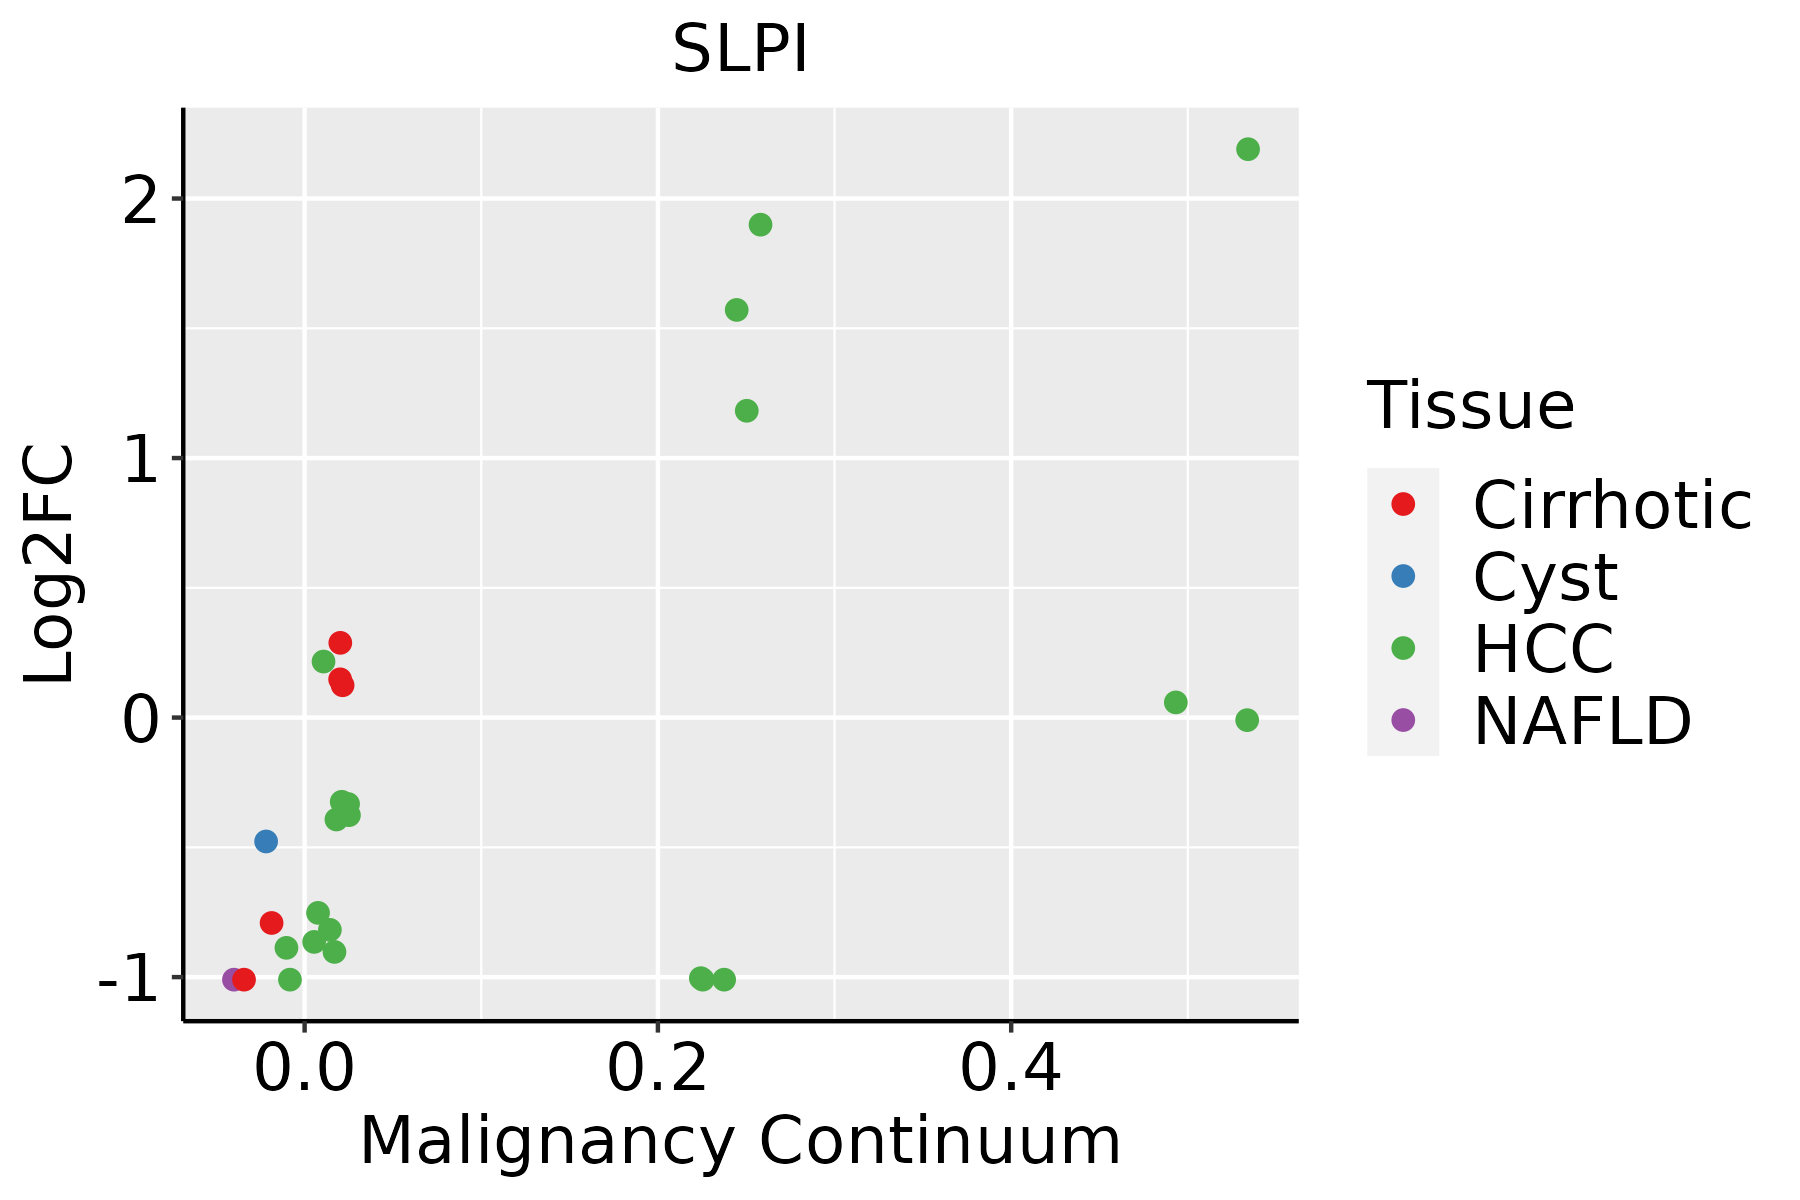
HCC: Hepatocellular carcinoma
NAFLD: Non-alcoholic fatty liver disease
LungThe image shows the transcriptomic changes along malignancy continuum.log2FC in expression of this searched gene in stem-like cells from each diseased tissue sample relative to stem-like cells in normal samples in each tissue plotted against the malignancy continuum. Samples are colored based on if they are from different disease stage.
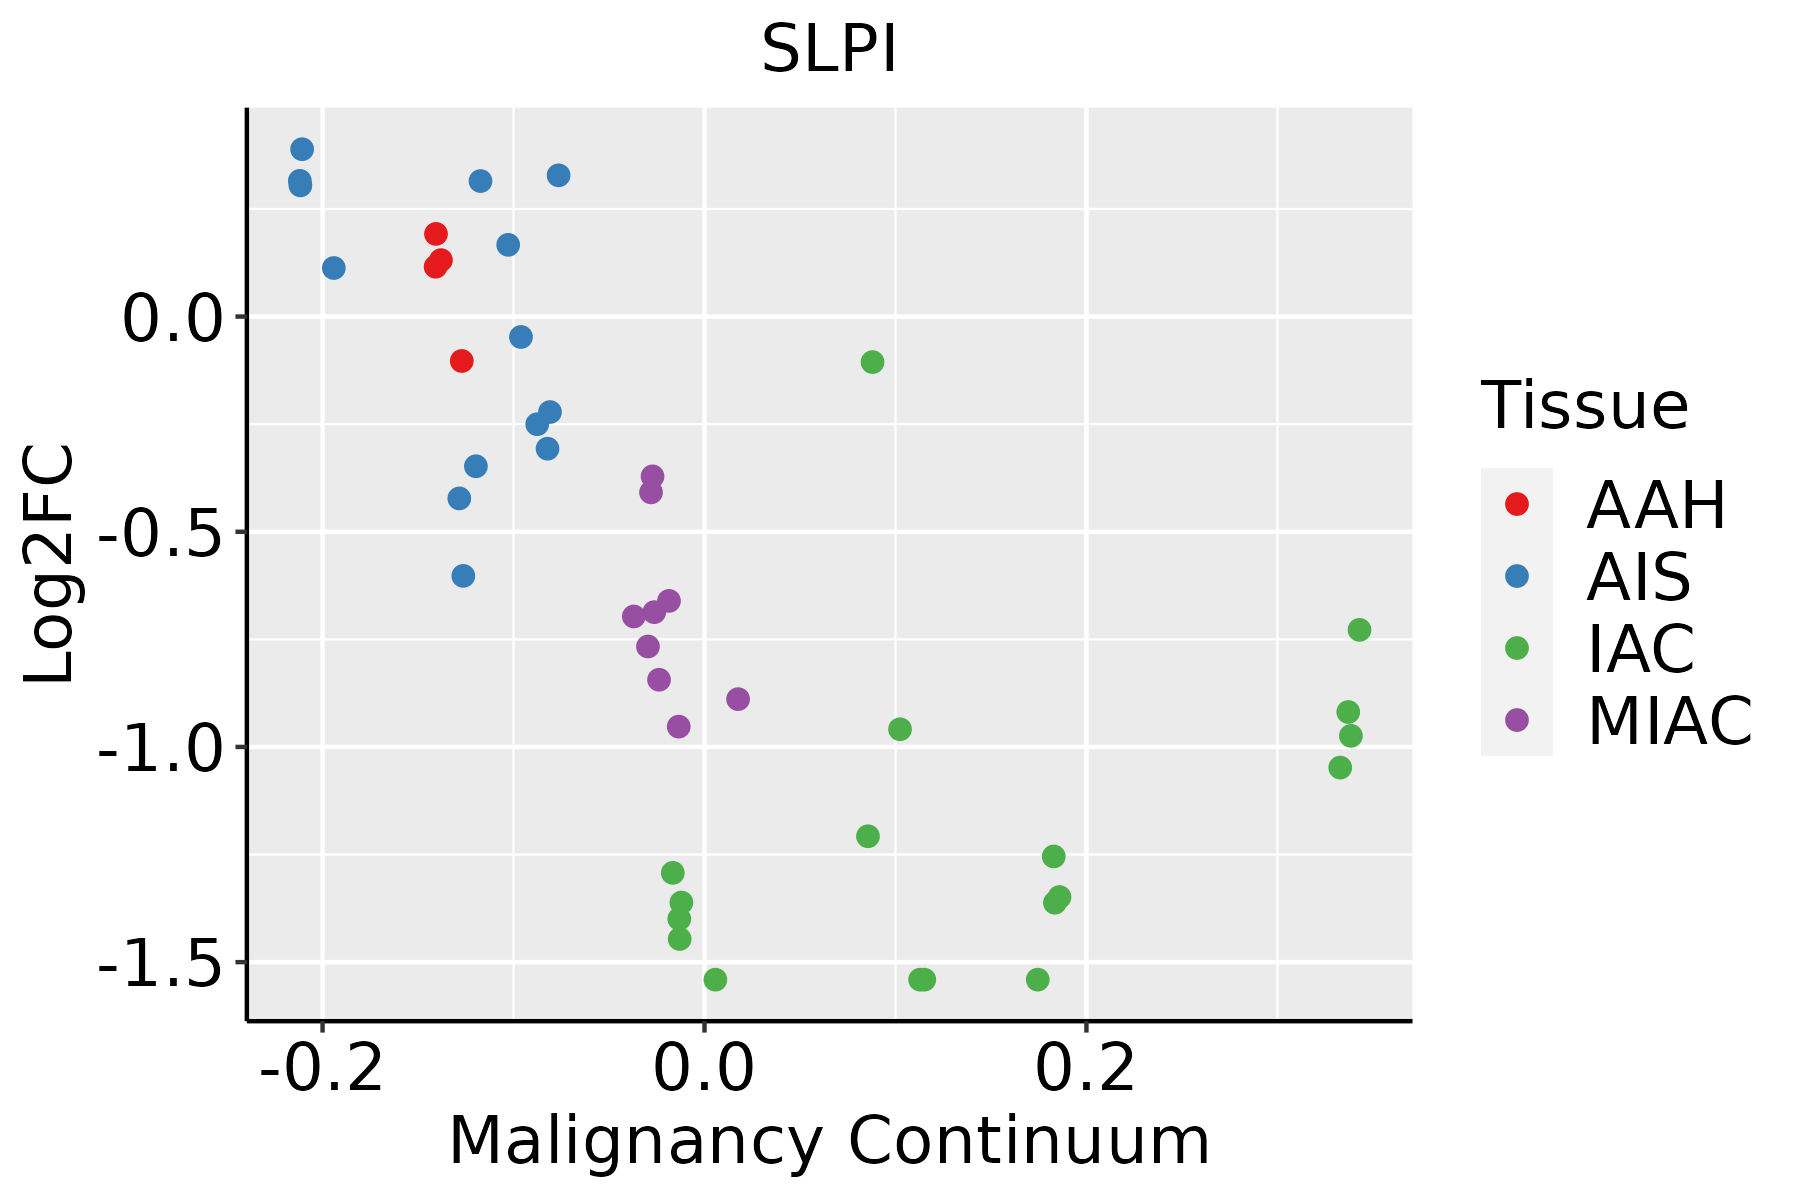
AAH: Atypical adenomatous hyperplasia
AIS: Adenocarcinoma in situ
IAC: Invasive lung adenocarcinoma
MIA: Minimally invasive adenocarcinoma
Oral CavityThe image shows the transcriptomic changes along malignancy continuum.log2FC in expression of this searched gene in stem-like cells from each diseased tissue sample relative to stem-like cells in normal samples in each tissue plotted against the malignancy continuum. Samples are colored based on if they are from different disease stage.EOLP: Erosive Oral lichen planus
LP: leukoplakia
NEOLP: Non-erosive oral lichen planus
OSCC: Oral squamous cell carcinoma
ProstateThe image shows the transcriptomic changes along malignancy continuum.log2FC in expression of this searched gene in stem-like cells from each diseased tissue sample relative to stem-like cells in normal samples in each tissue plotted against the malignancy continuum. Samples are colored based on if they are from different disease stage.
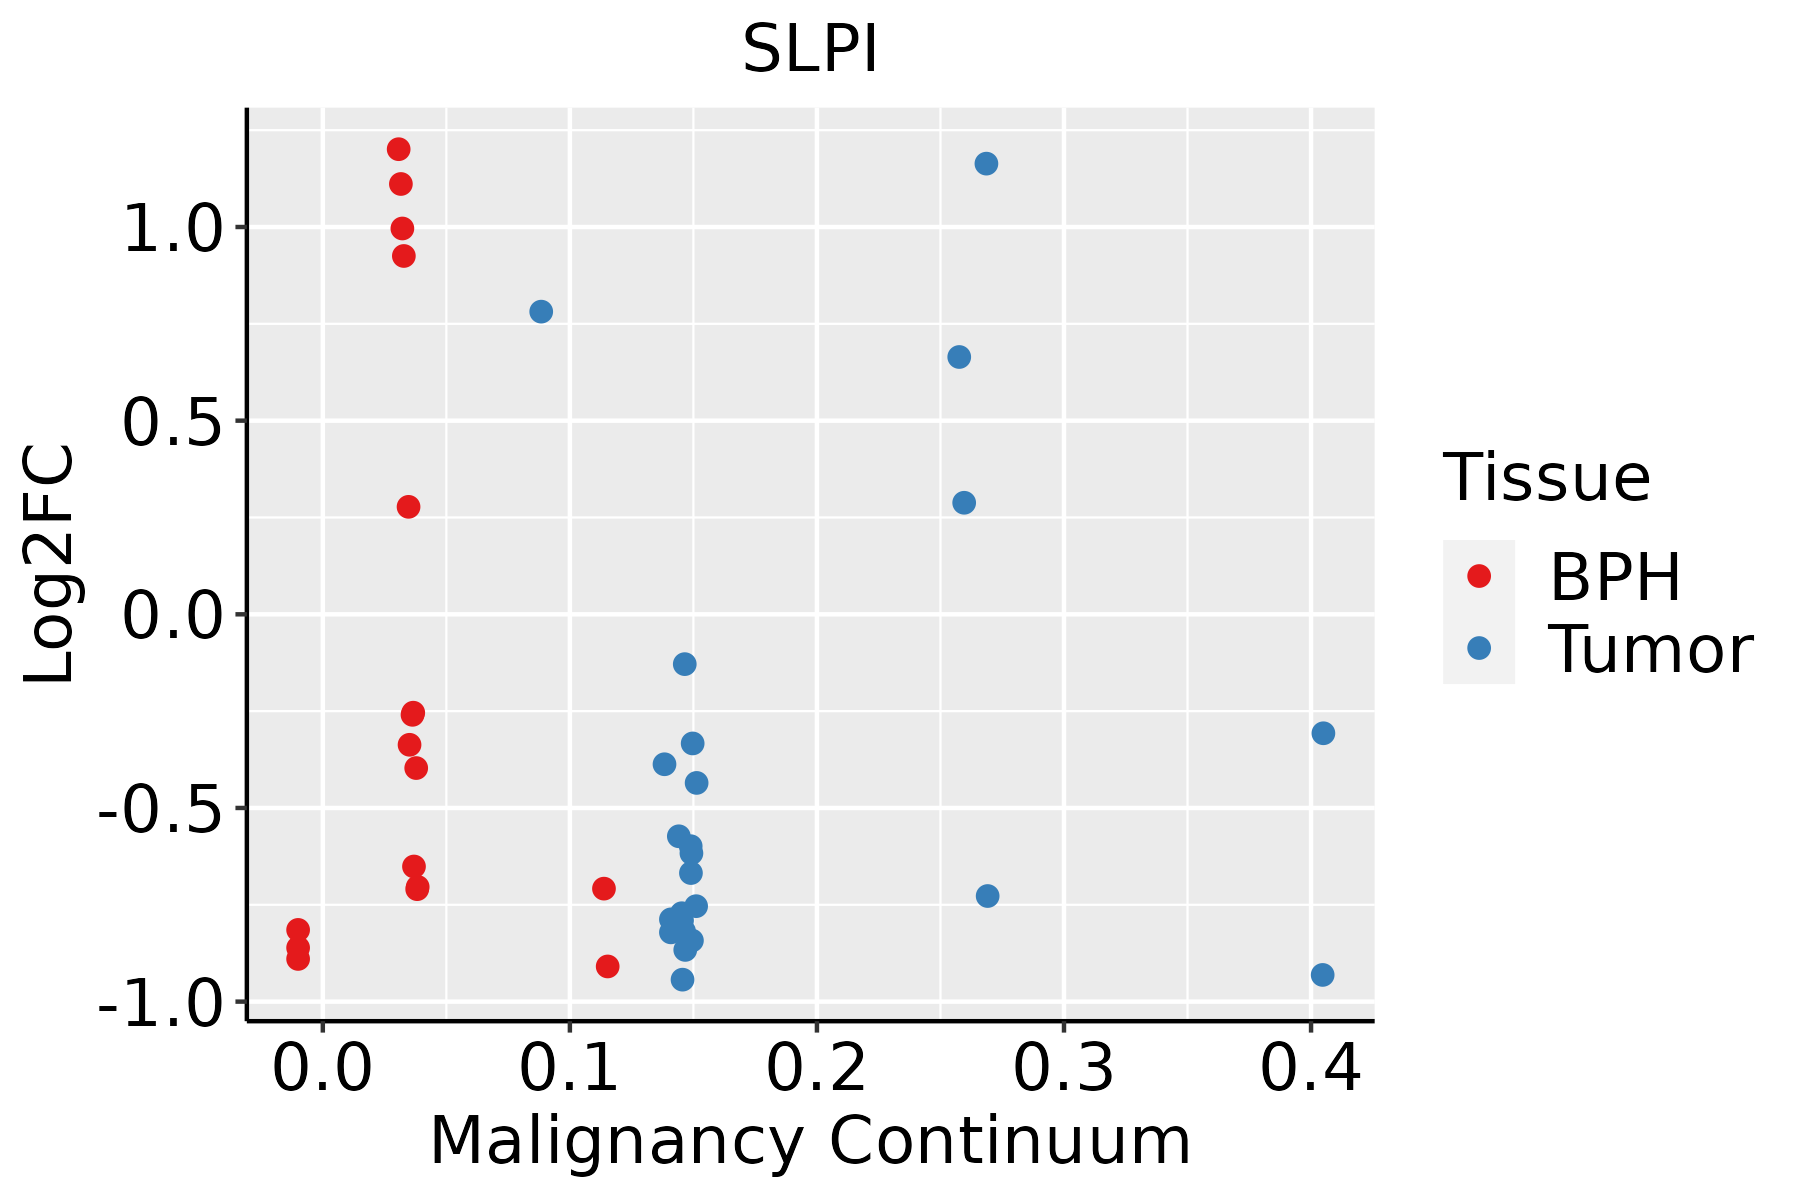
BPH: Benign Prostatic Hyperplasia
SkinThe image shows the transcriptomic changes along malignancy continuum.log2FC in expression of this searched gene in stem-like cells from each diseased tissue sample relative to stem-like cells in normal samples in each tissue plotted against the malignancy continuum. Samples are colored based on if they are from different disease stage.AK: Actinic keratosis
cSCC: Cutaneous squamous cell carcinoma
SCCIS:squamous cell carcinoma in situ
ThyroidThe image shows the transcriptomic changes along malignancy continuum.log2FC in expression of this searched gene in stem-like cells from each diseased tissue sample relative to stem-like cells in normal samples in each tissue plotted against the malignancy continuum. Samples are colored based on if they are from different disease stage.
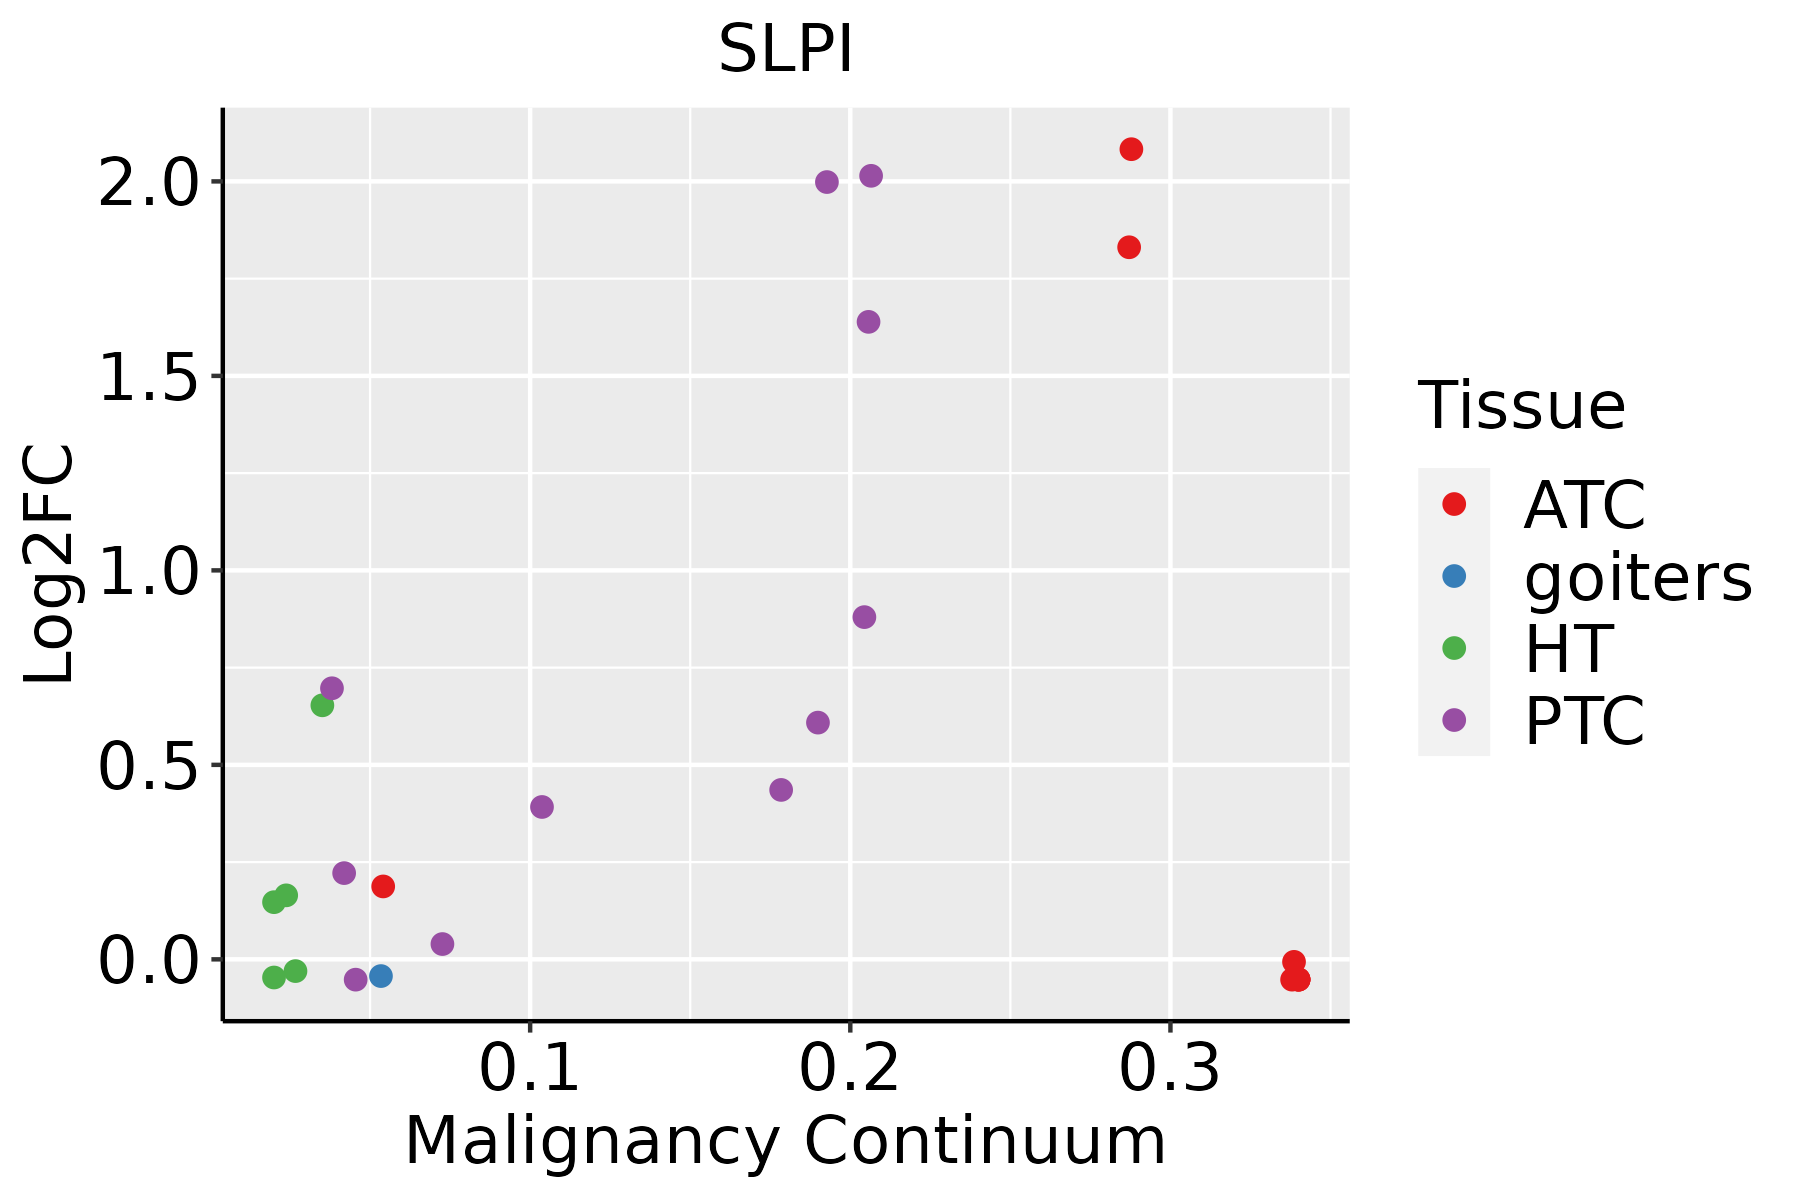
ATC: Anaplastic thyroid cancer
HT: Hashimoto's thyroiditis
PTC: Papillary thyroid cancer
∗log2FC in expression of this searched gene in stem-like cells from each diseased tissue sample relative to stem-like cells in normal samples in each tissue plotted against the malignancy continuum. Samples are colored based on if they are from different disease stage.

Top

Malignant transformation related pathway analysis

check buttonFind out the enriched GO biological processes and KEGG pathways involved in transition from healthy to precancer to cancer
check button Figure of enriched GO biological processes.
TissueDisease StageEnriched GO biological Processes
ColorectumADGO analysis - Figure of enriched GO biological processes: Top 15 enriched GO BP terms are showed in the bar plot of each disease state in each tissue. Each row represents a significant GO biological process which is colored according to the -log10(p.adjust).
ColorectumSERGO analysis - Figure of enriched GO biological processes: Top 15 enriched GO BP terms are showed in the bar plot of each disease state in each tissue. Each row represents a significant GO biological process which is colored according to the -log10(p.adjust).
ColorectumMSSGO analysis - Figure of enriched GO biological processes: Top 15 enriched GO BP terms are showed in the bar plot of each disease state in each tissue. Each row represents a significant GO biological process which is colored according to the -log10(p.adjust).
ColorectumMSI-HGO analysis - Figure of enriched GO biological processes: Top 15 enriched GO BP terms are showed in the bar plot of each disease state in each tissue. Each row represents a significant GO biological process which is colored according to the -log10(p.adjust).
ColorectumFAPGO analysis - Figure of enriched GO biological processes: Top 15 enriched GO BP terms are showed in the bar plot of each disease state in each tissue. Each row represents a significant GO biological process which is colored according to the -log10(p.adjust).
∗Top 15 enriched GO BP terms are showed in the bar plot of each disease state in each tissue. Each row represents a significant GO biological process which is colored according to the -log10(p.adjust).
Page: 1 2 3 4 5 6 7 8 9 

check button Enriched GO biological processes.
GO IDTissueDisease StageDescriptionGene RatioBg Ratiopvaluep.adjustCount
GO:00525479BreastPrecancerregulation of peptidase activity71/1080461/187232.72e-146.94e-1271
GO:00525489BreastPrecancerregulation of endopeptidase activity67/1080432/187231.06e-132.36e-1167
GO:00160329BreastPrecancerviral process58/1080415/187233.42e-103.16e-0858
GO:00190589BreastPrecancerviral life cycle47/1080317/187232.42e-091.99e-0747
GO:00458619BreastPrecancernegative regulation of proteolysis50/1080351/187232.99e-092.39e-0750
GO:00513468BreastPrecancernegative regulation of hydrolase activity50/1080379/187233.85e-082.34e-0650
GO:00104668BreastPrecancernegative regulation of peptidase activity38/1080262/187231.46e-077.82e-0638
GO:00109519BreastPrecancernegative regulation of endopeptidase activity37/1080252/187231.55e-078.05e-0637
GO:00507929BreastPrecancerregulation of viral process27/1080164/187237.59e-073.05e-0527
GO:00510989BreastPrecancerregulation of binding44/1080363/187232.59e-068.65e-0544
GO:00190799BreastPrecancerviral genome replication22/1080131/187235.63e-061.66e-0422
GO:00022378BreastPrecancerresponse to molecule of bacterial origin43/1080363/187236.05e-061.72e-0443
GO:00324968BreastPrecancerresponse to lipopolysaccharide41/1080343/187237.94e-062.17e-0441
GO:19039009BreastPrecancerregulation of viral life cycle23/1080148/187231.31e-053.30e-0423
GO:00197307BreastPrecancerantimicrobial humoral response19/1080122/187237.02e-051.40e-0319
GO:00450697BreastPrecancerregulation of viral genome replication13/108085/187231.12e-031.23e-0213
GO:00511008BreastPrecancernegative regulation of binding19/1080162/187232.56e-032.32e-0219
GO:00485255BreastPrecancernegative regulation of viral process12/108092/187236.51e-034.51e-0212
GO:005254714BreastIDCregulation of peptidase activity96/1434461/187237.58e-206.15e-1796
GO:005254814BreastIDCregulation of endopeptidase activity88/1434432/187231.20e-174.85e-1588
Page: 1 2 3 4 5 6 7 8 9 10 11 12 13 14 15 16 17 18 19 20 21 22 23 24 25 26 27 28 29 30 31 32 

check button Enriched KEGG pathways.
Pathway IDTissueDisease StageDescriptionGene RatioBg Ratiopvaluep.adjustqvalueCount
Page: 1 

Top

Cell-cell communication analysis

check buttonIdentification of potential cell-cell interactions between two cell types and their ligand-receptor pairs for different disease states
LigandReceptorLRpairPathwayTissueDisease Stage
Page: 1 

Top

Single-cell gene regulatory network inference analysis

check buttonFind out the significant the regulons (TFs) and the target genes of each regulon across cell types for different disease states
TFCell TypeTissueDisease StageTarget GeneRSSRegulon Activity
∗The dot plots of a searched regulon are shown for all cell subpopulations in each disease state of each tissue based on the regulon specific score inferred using pySCENIC and by calculating the average expression.
Page: 1 

Top

Somatic mutation of malignant transformation related genes

check buttonAnnotation of somatic variants for genes involved in malignant transformation
Hugo SymbolVariant ClassVariant ClassificationdbSNP RSHGVScHGVSpHGVSp ShortSWISSPROTBIOTYPESIFTPolyPhenTumor Sample BarcodeTissueHistologySexAgeStageTherapy TypesDrugsOutcome
SLPISNVMissense_Mutationnovelc.11N>Ap.Ser4Asnp.S4NP03973protein_codingtolerated(0.21)benign(0.026)TCGA-AP-A1DK-01Endometriumuterine corpus endometrioid carcinomaFemale<65I/IIUnknownUnknownSD
SLPISNVMissense_Mutationc.238A>Gp.Asn80Aspp.N80DP03973protein_codingtolerated(0.29)benign(0.015)TCGA-B5-A0JY-01Endometriumuterine corpus endometrioid carcinomaFemale<65III/IVChemotherapydoxorubicinSD
SLPISNVMissense_Mutationnovelc.352T>Cp.Cys118Argp.C118RP03973protein_codingdeleterious(0)probably_damaging(1)TCGA-B5-A3FA-01Endometriumuterine corpus endometrioid carcinomaFemale>=65I/IIUnknownUnknownSD
SLPISNVMissense_Mutationc.238N>Cp.Asn80Hisp.N80HP03973protein_codingdeleterious(0.03)benign(0.188)TCGA-BS-A0UV-01Endometriumuterine corpus endometrioid carcinomaFemale<65III/IVUnknownUnknownSD
SLPISNVMissense_Mutationnovelc.141G>Tp.Lys47Asnp.K47NP03973protein_codingdeleterious(0)benign(0.001)TCGA-EO-A3AY-01Endometriumuterine corpus endometrioid carcinomaFemale<65I/IIUnknownUnknownPD
SLPISNVMissense_Mutationnovelc.185G>Tp.Arg62Ilep.R62IP03973protein_codingtolerated(0.11)benign(0.062)TCGA-EO-A3B0-01Endometriumuterine corpus endometrioid carcinomaFemale<65III/IVUnknownUnknownSD
SLPIinsertionFrame_Shift_Insrs745834619c.306_307insCp.Asn103GlnfsTer4p.N103Qfs*4P03973protein_codingTCGA-DF-A2KY-01Endometriumuterine corpus endometrioid carcinomaFemale<65III/IVChemotherapycarboplatinSD
SLPISNVMissense_Mutationnovelc.196N>Ap.Asp66Asnp.D66NP03973protein_codingtolerated(0.09)possibly_damaging(0.628)TCGA-XR-A8TD-01Liverliver hepatocellular carcinomaFemale<65III/IVUnknownUnknownSD
SLPISNVMissense_Mutationc.77N>Gp.Ser26Cysp.S26CP03973protein_codingdeleterious(0.01)benign(0.24)TCGA-49-6743-01Lunglung adenocarcinomaFemale>=65III/IVChemotherapycisplatinSD
SLPISNVMissense_Mutationnovelc.101T>Ap.Val34Aspp.V34DP03973protein_codingtolerated(0.21)possibly_damaging(0.472)TCGA-52-7810-01Lunglung squamous cell carcinomaFemale<65I/IIUnknownUnknownSD
Page: 1 2 

Top

Related drugs of malignant transformation related genes

check buttonIdentification of chemicals and drugs interact with genes involved in malignant transfromation
(DGIdb 4.0)
Entrez IDSymbolCategoryInteraction TypesDrug Claim NameDrug NamePMIDs
6590SLPIENZYME, DRUGGABLE GENOME, PROTEASE INHIBITORHEPARINHEPARIN8615699,9593692
6590SLPIENZYME, DRUGGABLE GENOME, PROTEASE INHIBITORCYTOKINES11385113
6590SLPIENZYME, DRUGGABLE GENOME, PROTEASE INHIBITORHGF10970828
6590SLPIENZYME, DRUGGABLE GENOME, PROTEASE INHIBITORTNF-ALPHA12668158,17114478
Page: 1