Schematic overview of the cellular and molecular mechanisms involved in the cancer progression, including the proposed cellular and molecular mechanisms in cancer cells trajectory. AT1: alveolar type 1 cells; AT2: alveolar type 2 cells; AAH: atypical adenomatous hyperplasia; AIS: adenocarcinoma in situ; MIA: minimally invasive adenocarcinoma; IA: invasive adenocarcinoma; EMT: epithelial-mesenchymal transition

Home

Download

Statistics

Help

Contact

Center for Computational Systems Medicine
leaf

Gene summary

leaf

Malignant transformation analysis

leaf

Malignant transformation related pathway analysis

leaf

Cell-cell communication analysis

leaf

Single-cell gene regulatory network inference analysis

leaf

Somatic mutation of malignant transformation related genes

leaf

Related drugs of malignant transformation related genes

Gene: SLMAP

Gene summary for SLMAP

check button Gene summary.

Gene informationSpeciesHuman
Gene symbol

SLMAP

Gene ID

7871

Gene namesarcolemma associated protein
Gene AliasSLAP
Cytomap3p14.3
Gene Typeprotein-coding
GO ID

GO:0001508

UniProtAcc

Q14BN4


Top

Malignant transformation analysis

check button Identification of the aberrant gene expression in precancerous and cancerous lesions by comparing the gene expression of stem-like cells in diseased tissues with normal stem cells
check button Malignant transformation involving gene list.
Entrez IDSymbolReplicatesSpeciesOrganTissueAdj P-valueLog2FCMalignancy
7871SLMAPCCI_1HumanCervixCC1.61e-021.12e+000.528
7871SLMAPCCI_2HumanCervixCC1.43e-151.82e+000.5249
7871SLMAPCCI_3HumanCervixCC2.62e-078.73e-010.516
7871SLMAPH2HumanCervixHSIL_HPV4.12e-032.29e-010.0632
7871SLMAPHTA11_3410_2000001011HumanColorectumAD7.05e-11-5.02e-010.0155
7871SLMAPHTA11_546_2000001011HumanColorectumAD3.82e-03-2.62e-01-0.0842
7871SLMAPHTA11_7862_2000001011HumanColorectumAD8.58e-03-4.67e-01-0.0179
7871SLMAPHTA11_866_3004761011HumanColorectumAD3.30e-10-4.90e-010.096
7871SLMAPHTA11_4255_2000001011HumanColorectumSER2.87e-02-3.26e-010.0446
7871SLMAPHTA11_7696_3000711011HumanColorectumAD1.13e-10-4.02e-010.0674
7871SLMAPHTA11_6818_2000001021HumanColorectumAD7.39e-04-5.05e-010.0588
7871SLMAPHTA11_99999970781_79442HumanColorectumMSS4.48e-07-3.54e-010.294
7871SLMAPHTA11_99999973899_84307HumanColorectumMSS2.69e-02-5.23e-010.2585
7871SLMAPHTA11_99999974143_84620HumanColorectumMSS3.74e-19-5.83e-010.3005
7871SLMAPF007HumanColorectumFAP4.18e-02-2.25e-010.1176
7871SLMAPA001-C-207HumanColorectumFAP7.51e-04-3.09e-010.1278
7871SLMAPA015-C-203HumanColorectumFAP2.87e-41-5.61e-01-0.1294
7871SLMAPA015-C-204HumanColorectumFAP1.38e-05-3.43e-01-0.0228
7871SLMAPA014-C-040HumanColorectumFAP8.18e-07-5.58e-01-0.1184
7871SLMAPA002-C-201HumanColorectumFAP5.25e-17-4.81e-010.0324
Page: 1 2 3 4 5 6 7 8 9 10 11 

check button Transcriptomic changes along malignancy continuum.
TissueExpression DynamicsAbbreviation
CervixThe image shows the transcriptomic changes along malignancy continuum.log2FC in expression of this searched gene in stem-like cells from each diseased tissue sample relative to stem-like cells in normal samples in each tissue plotted against the malignancy continuum. Samples are colored based on if they are from different disease stage.CC: Cervix cancer
HSIL_HPV: HPV-infected high-grade squamous intraepithelial lesions
N_HPV: HPV-infected normal cervix
Colorectum (GSE201348)The image shows the transcriptomic changes along malignancy continuum.log2FC in expression of this searched gene in stem-like cells from each diseased tissue sample relative to stem-like cells in normal samples in each tissue plotted against the malignancy continuum. Samples are colored based on if they are from different disease stage.FAP: Familial adenomatous polyposis
CRC: Colorectal cancer
Colorectum (HTA11)The image shows the transcriptomic changes along malignancy continuum.log2FC in expression of this searched gene in stem-like cells from each diseased tissue sample relative to stem-like cells in normal samples in each tissue plotted against the malignancy continuum. Samples are colored based on if they are from different disease stage.AD: Adenomas
SER: Sessile serrated lesions
MSI-H: Microsatellite-high colorectal cancer
MSS: Microsatellite stable colorectal cancer
EndometriumThe image shows the transcriptomic changes along malignancy continuum.log2FC in expression of this searched gene in stem-like cells from each diseased tissue sample relative to stem-like cells in normal samples in each tissue plotted against the malignancy continuum. Samples are colored based on if they are from different disease stage.
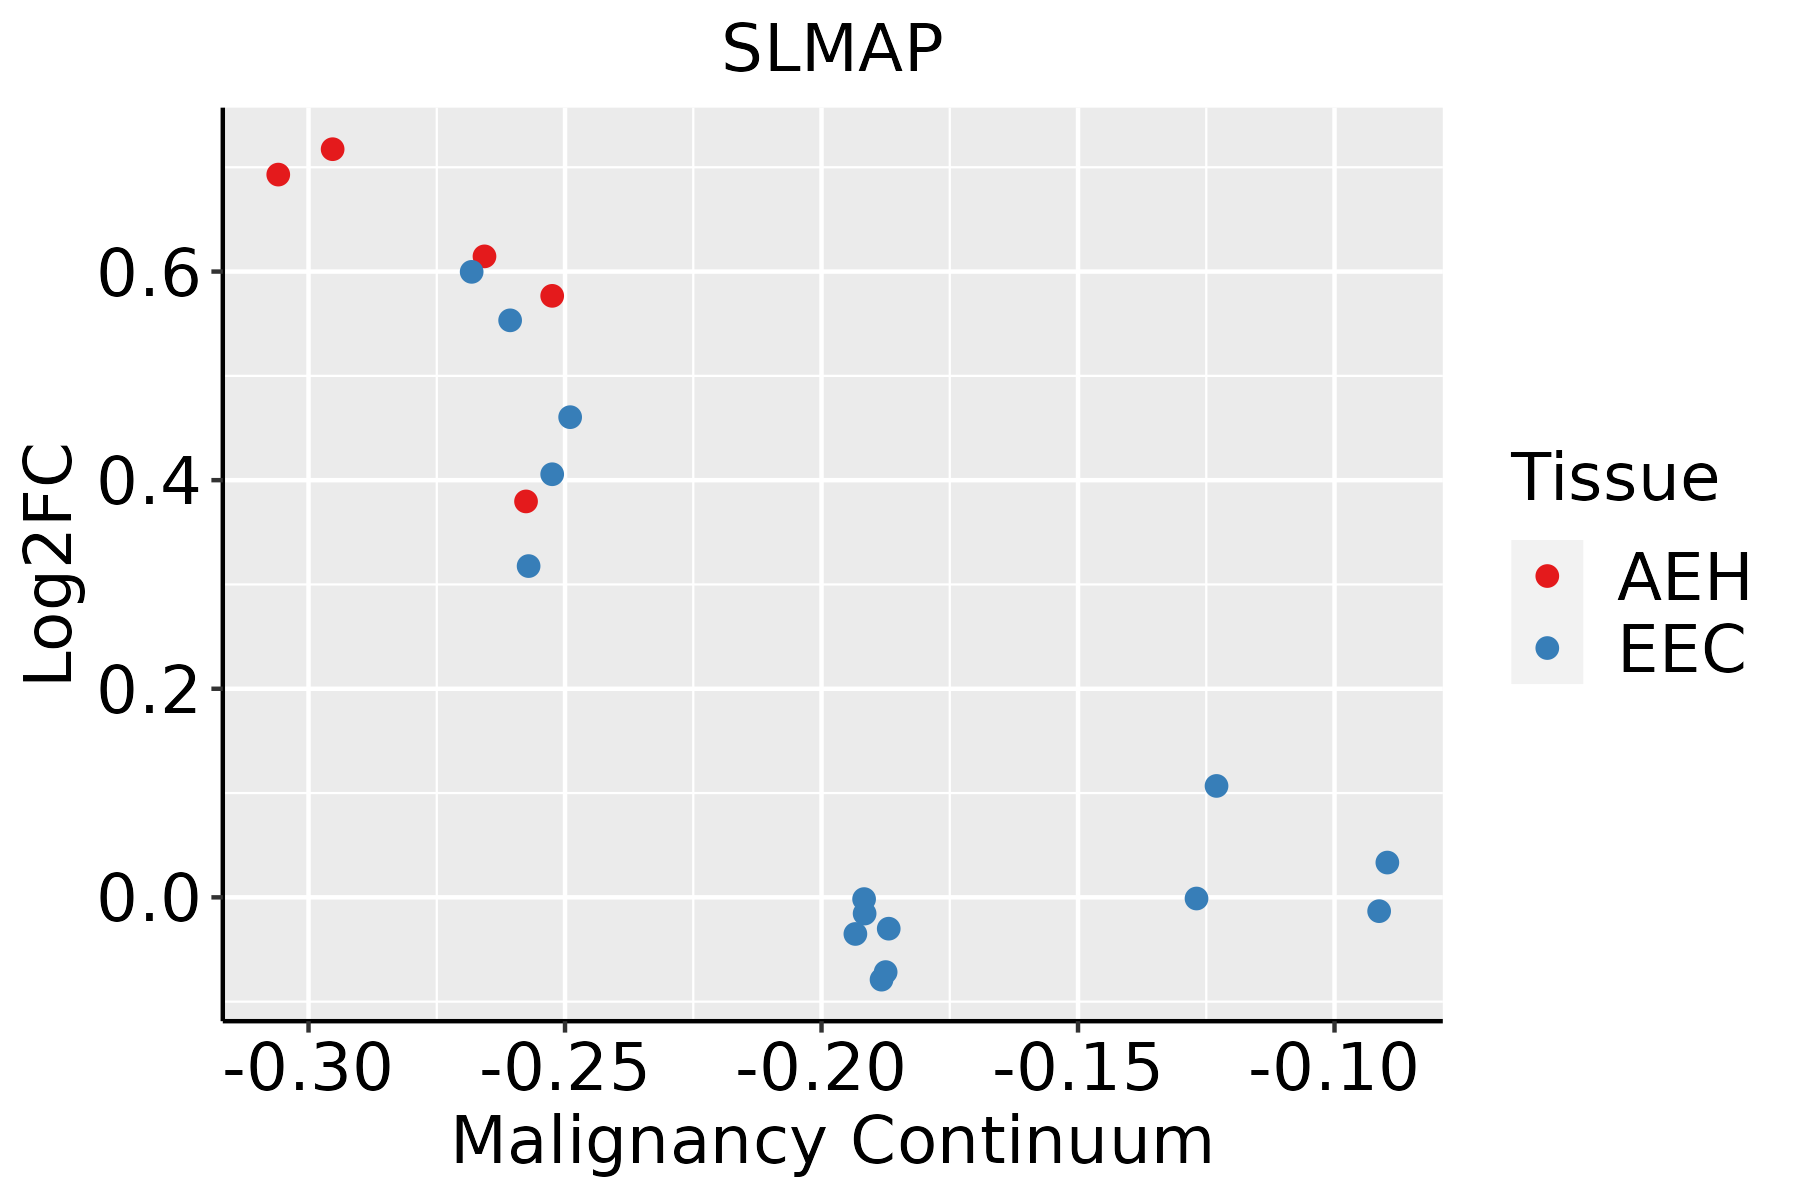
AEH: Atypical endometrial hyperplasia
EEC: Endometrioid Cancer
EsophagusThe image shows the transcriptomic changes along malignancy continuum.log2FC in expression of this searched gene in stem-like cells from each diseased tissue sample relative to stem-like cells in normal samples in each tissue plotted against the malignancy continuum. Samples are colored based on if they are from different disease stage.
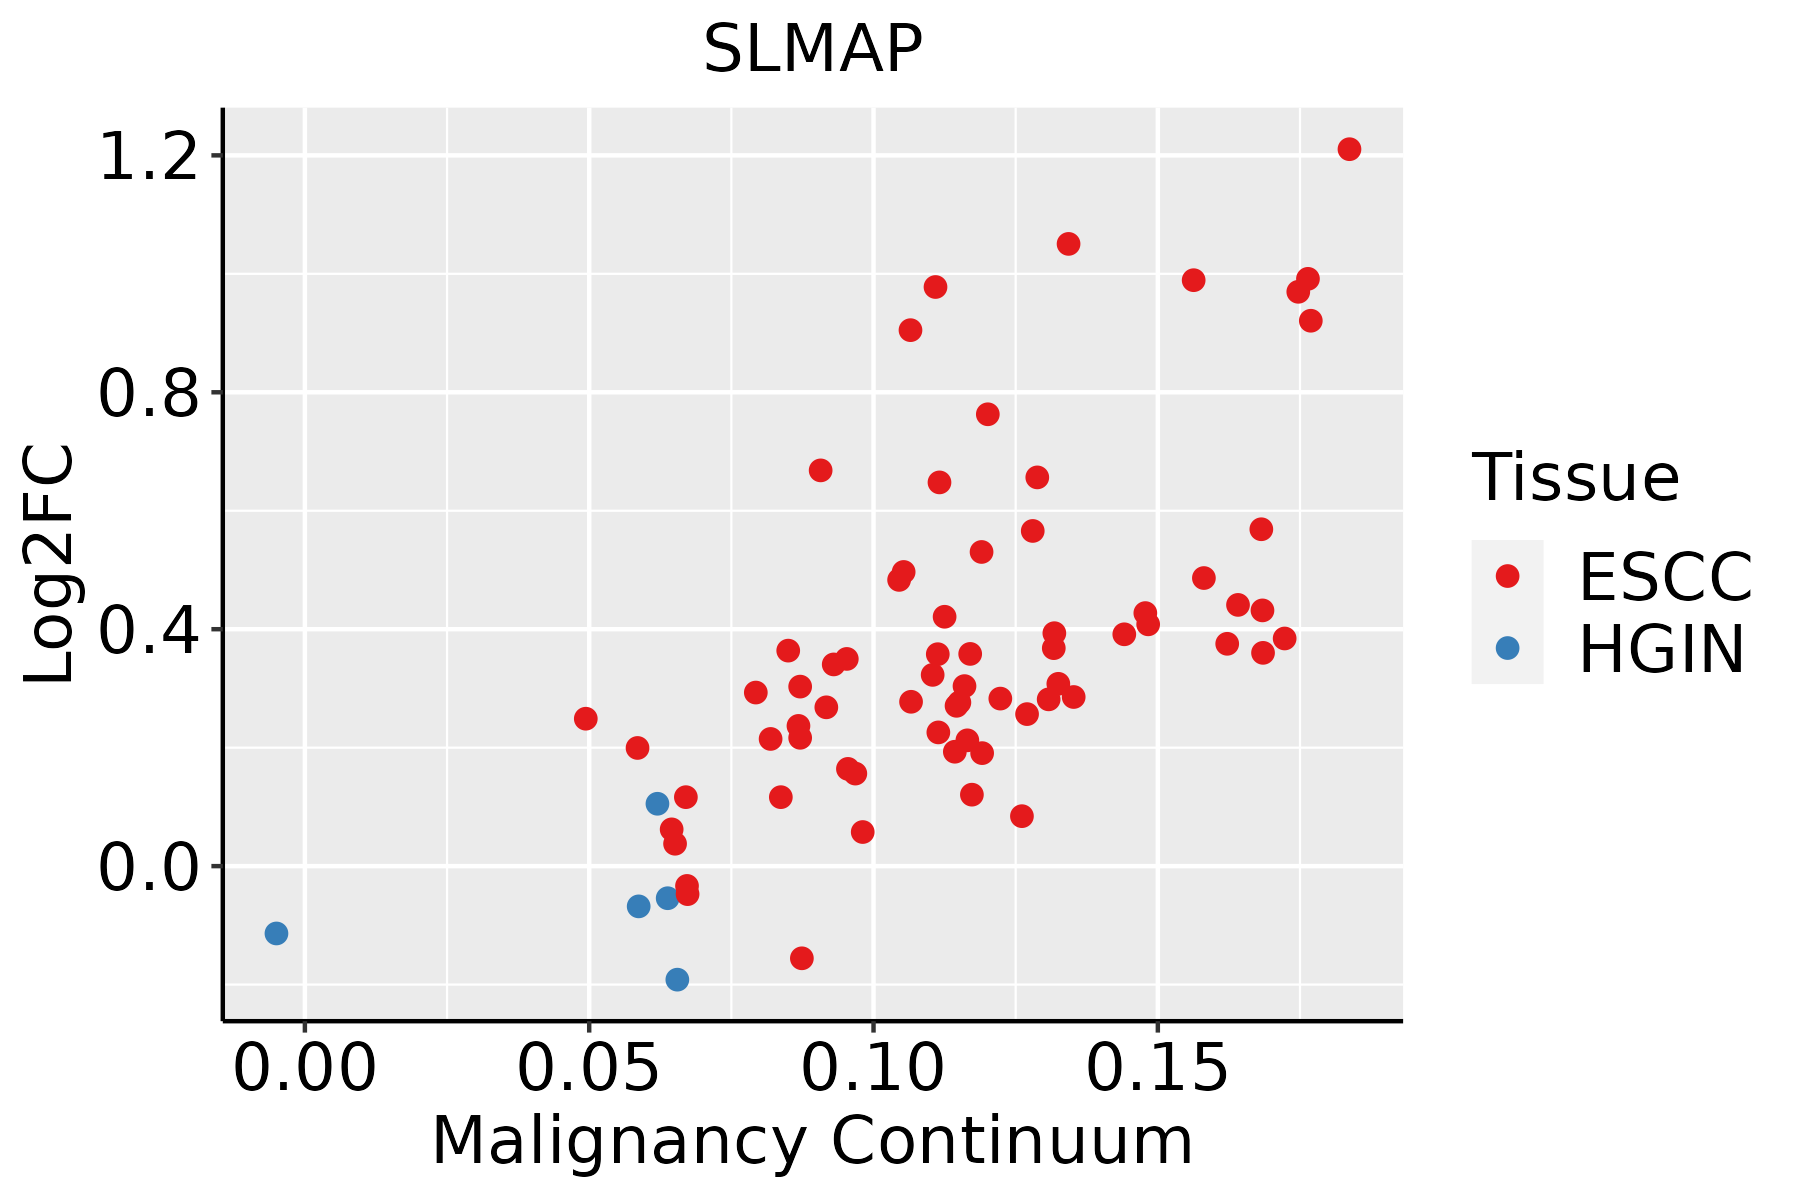
ESCC: Esophageal squamous cell carcinoma
HGIN: High-grade intraepithelial neoplasias
LGIN: Low-grade intraepithelial neoplasias
GCThe image shows the transcriptomic changes along malignancy continuum.log2FC in expression of this searched gene in stem-like cells from each diseased tissue sample relative to stem-like cells in normal samples in each tissue plotted against the malignancy continuum. Samples are colored based on if they are from different disease stage.
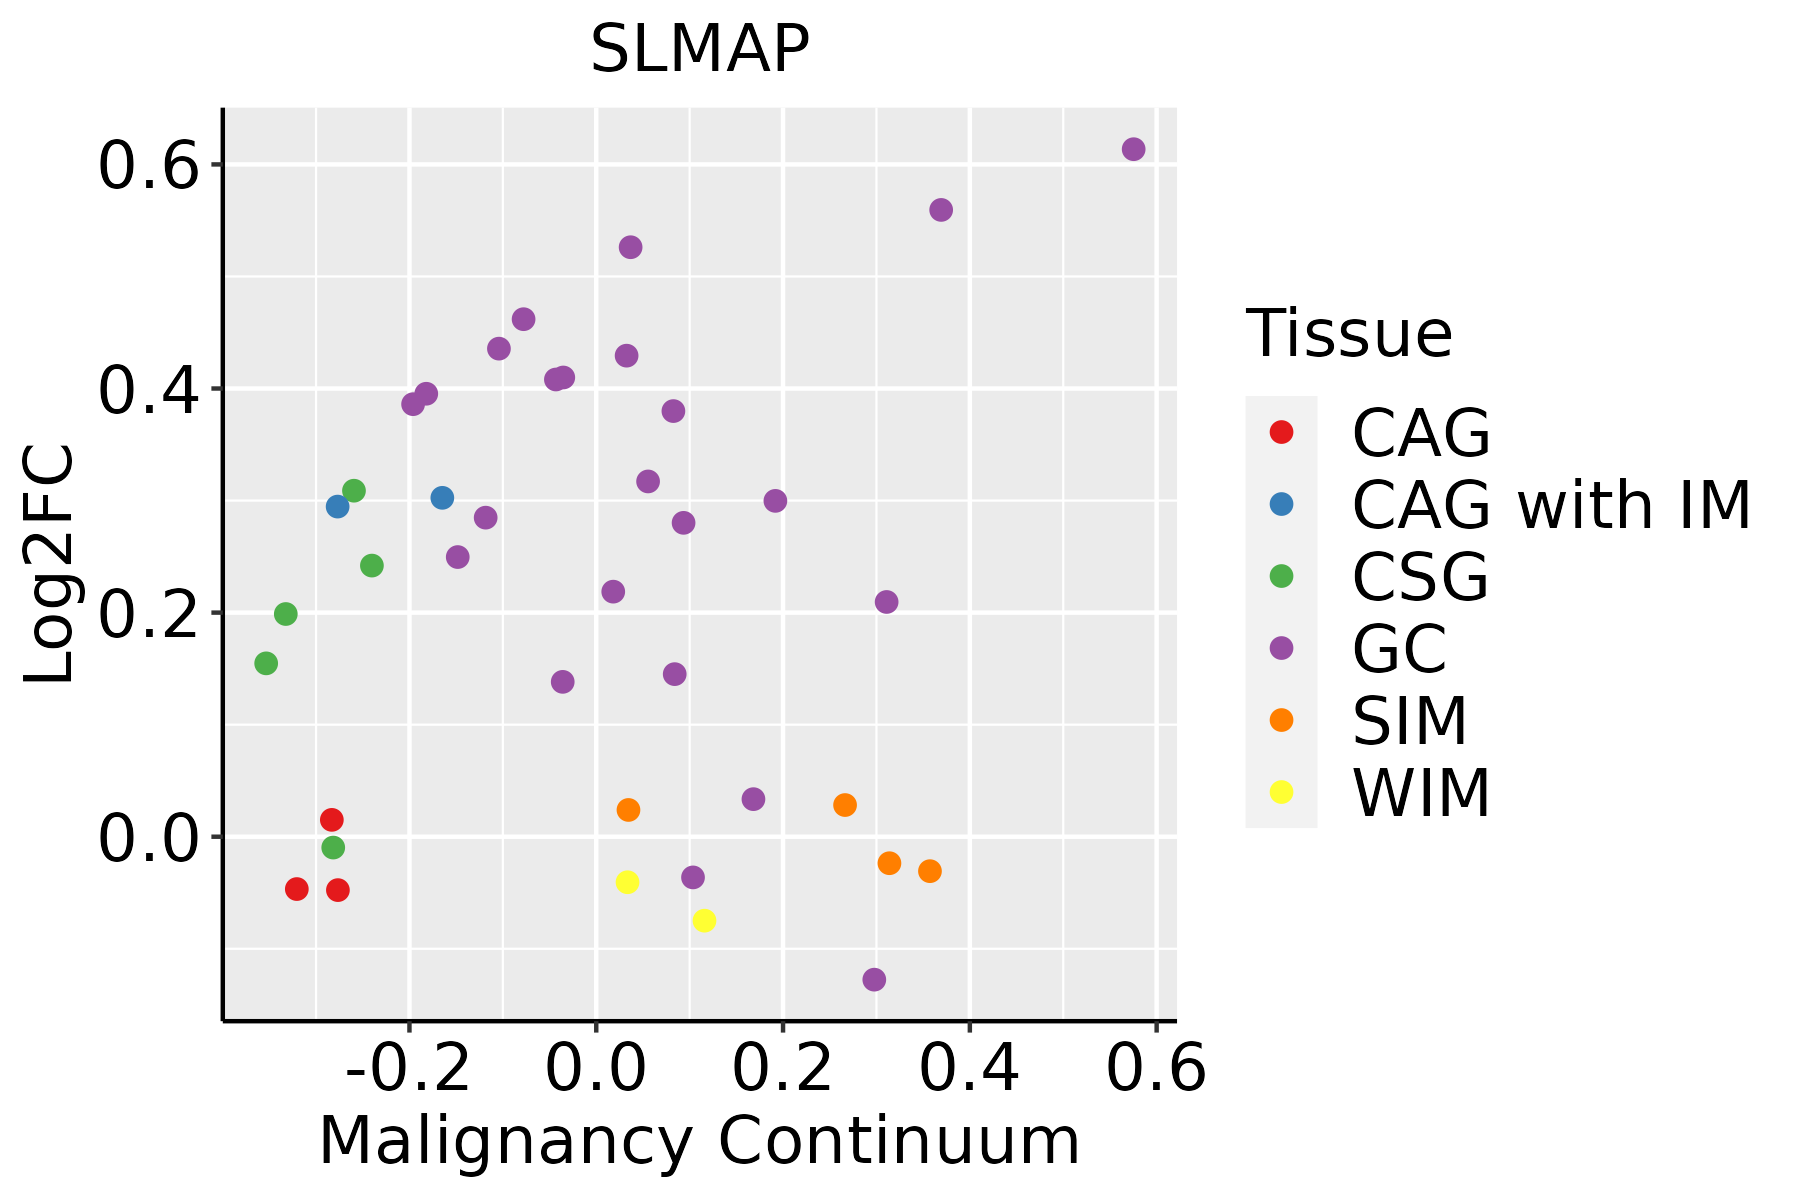
CAG: Chronic atrophic gastritis
CAG with IM: Chronic atrophic gastritis with intestinal metaplasia
CSG: Chronic superficial gastritis
GC: Gastric cancer
SIM: Severe intestinal metaplasia
WIM: Wild intestinal metaplasia
LiverThe image shows the transcriptomic changes along malignancy continuum.log2FC in expression of this searched gene in stem-like cells from each diseased tissue sample relative to stem-like cells in normal samples in each tissue plotted against the malignancy continuum. Samples are colored based on if they are from different disease stage.
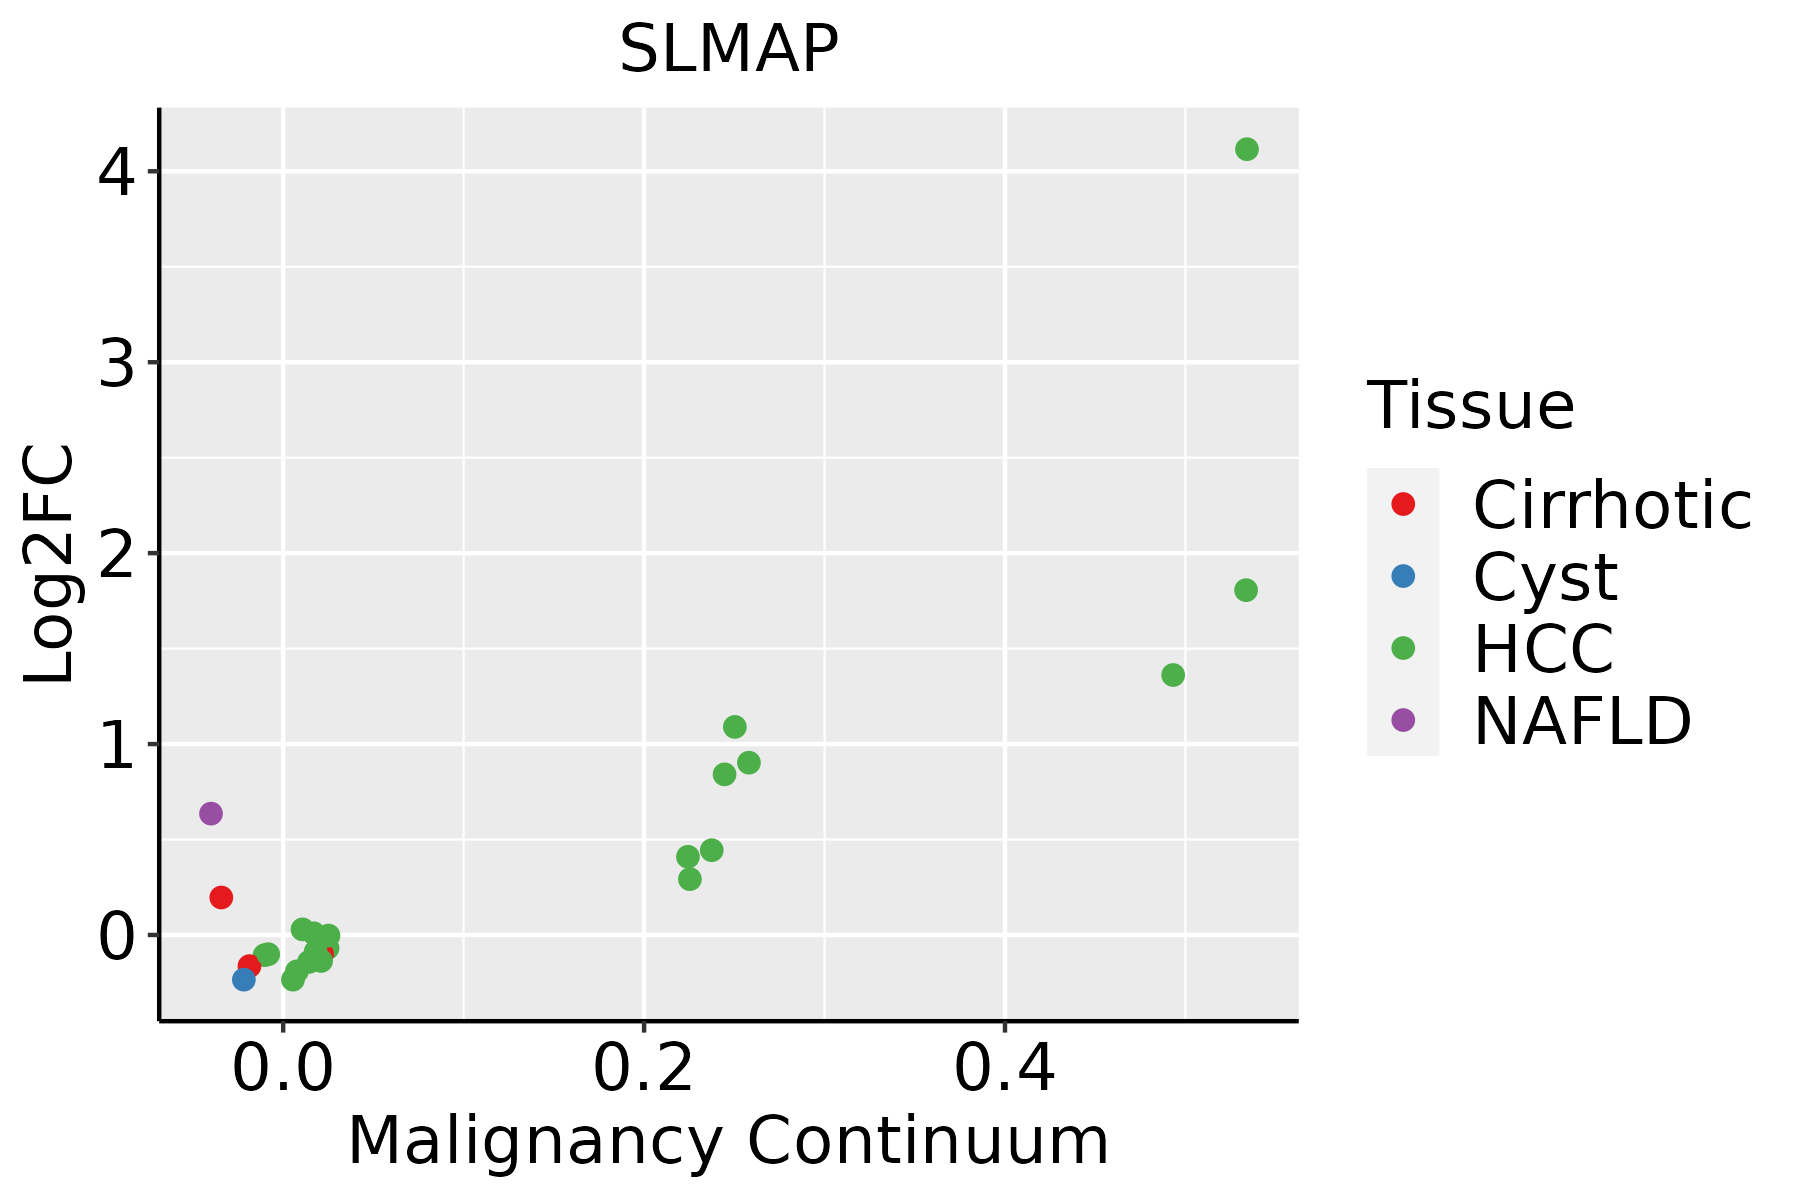
HCC: Hepatocellular carcinoma
NAFLD: Non-alcoholic fatty liver disease
LungThe image shows the transcriptomic changes along malignancy continuum.log2FC in expression of this searched gene in stem-like cells from each diseased tissue sample relative to stem-like cells in normal samples in each tissue plotted against the malignancy continuum. Samples are colored based on if they are from different disease stage.
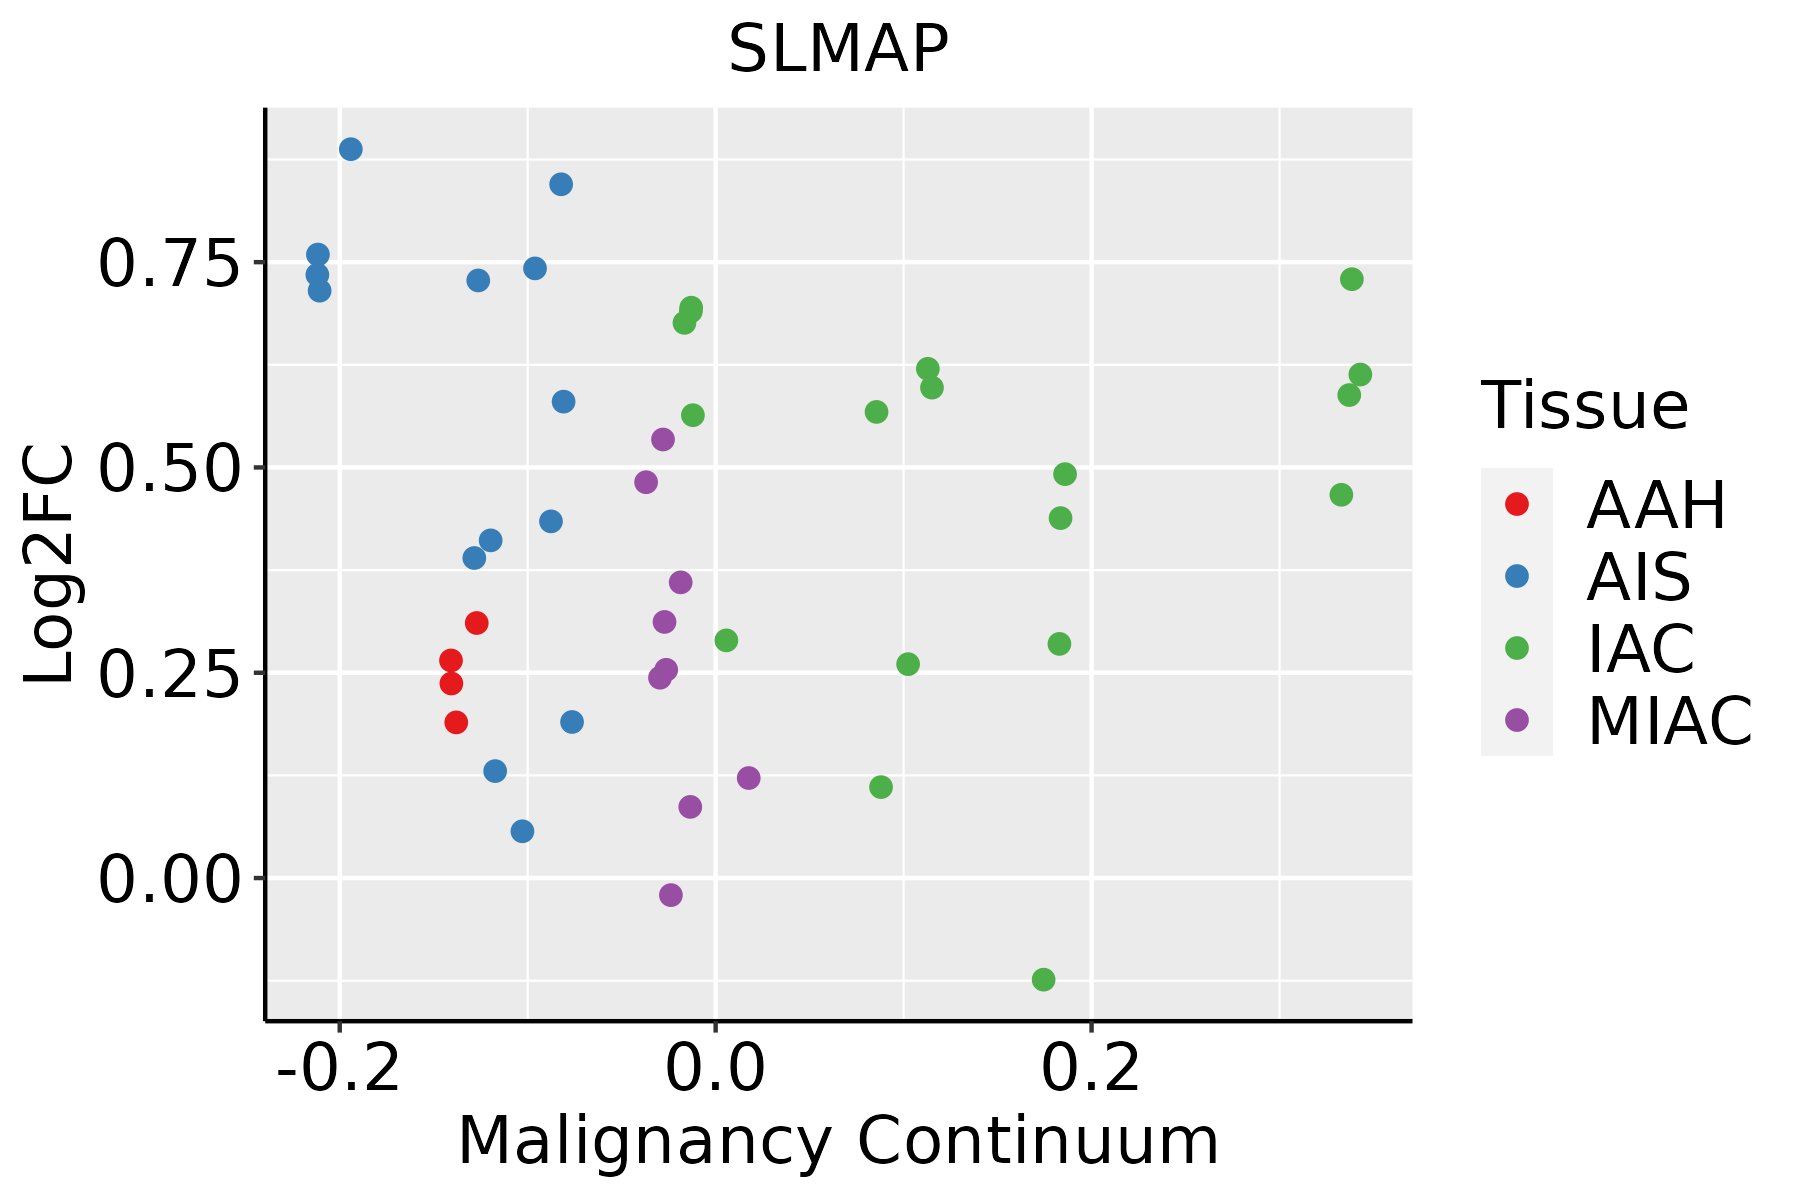
AAH: Atypical adenomatous hyperplasia
AIS: Adenocarcinoma in situ
IAC: Invasive lung adenocarcinoma
MIA: Minimally invasive adenocarcinoma
Oral CavityThe image shows the transcriptomic changes along malignancy continuum.log2FC in expression of this searched gene in stem-like cells from each diseased tissue sample relative to stem-like cells in normal samples in each tissue plotted against the malignancy continuum. Samples are colored based on if they are from different disease stage.EOLP: Erosive Oral lichen planus
LP: leukoplakia
NEOLP: Non-erosive oral lichen planus
OSCC: Oral squamous cell carcinoma
ProstateThe image shows the transcriptomic changes along malignancy continuum.log2FC in expression of this searched gene in stem-like cells from each diseased tissue sample relative to stem-like cells in normal samples in each tissue plotted against the malignancy continuum. Samples are colored based on if they are from different disease stage.
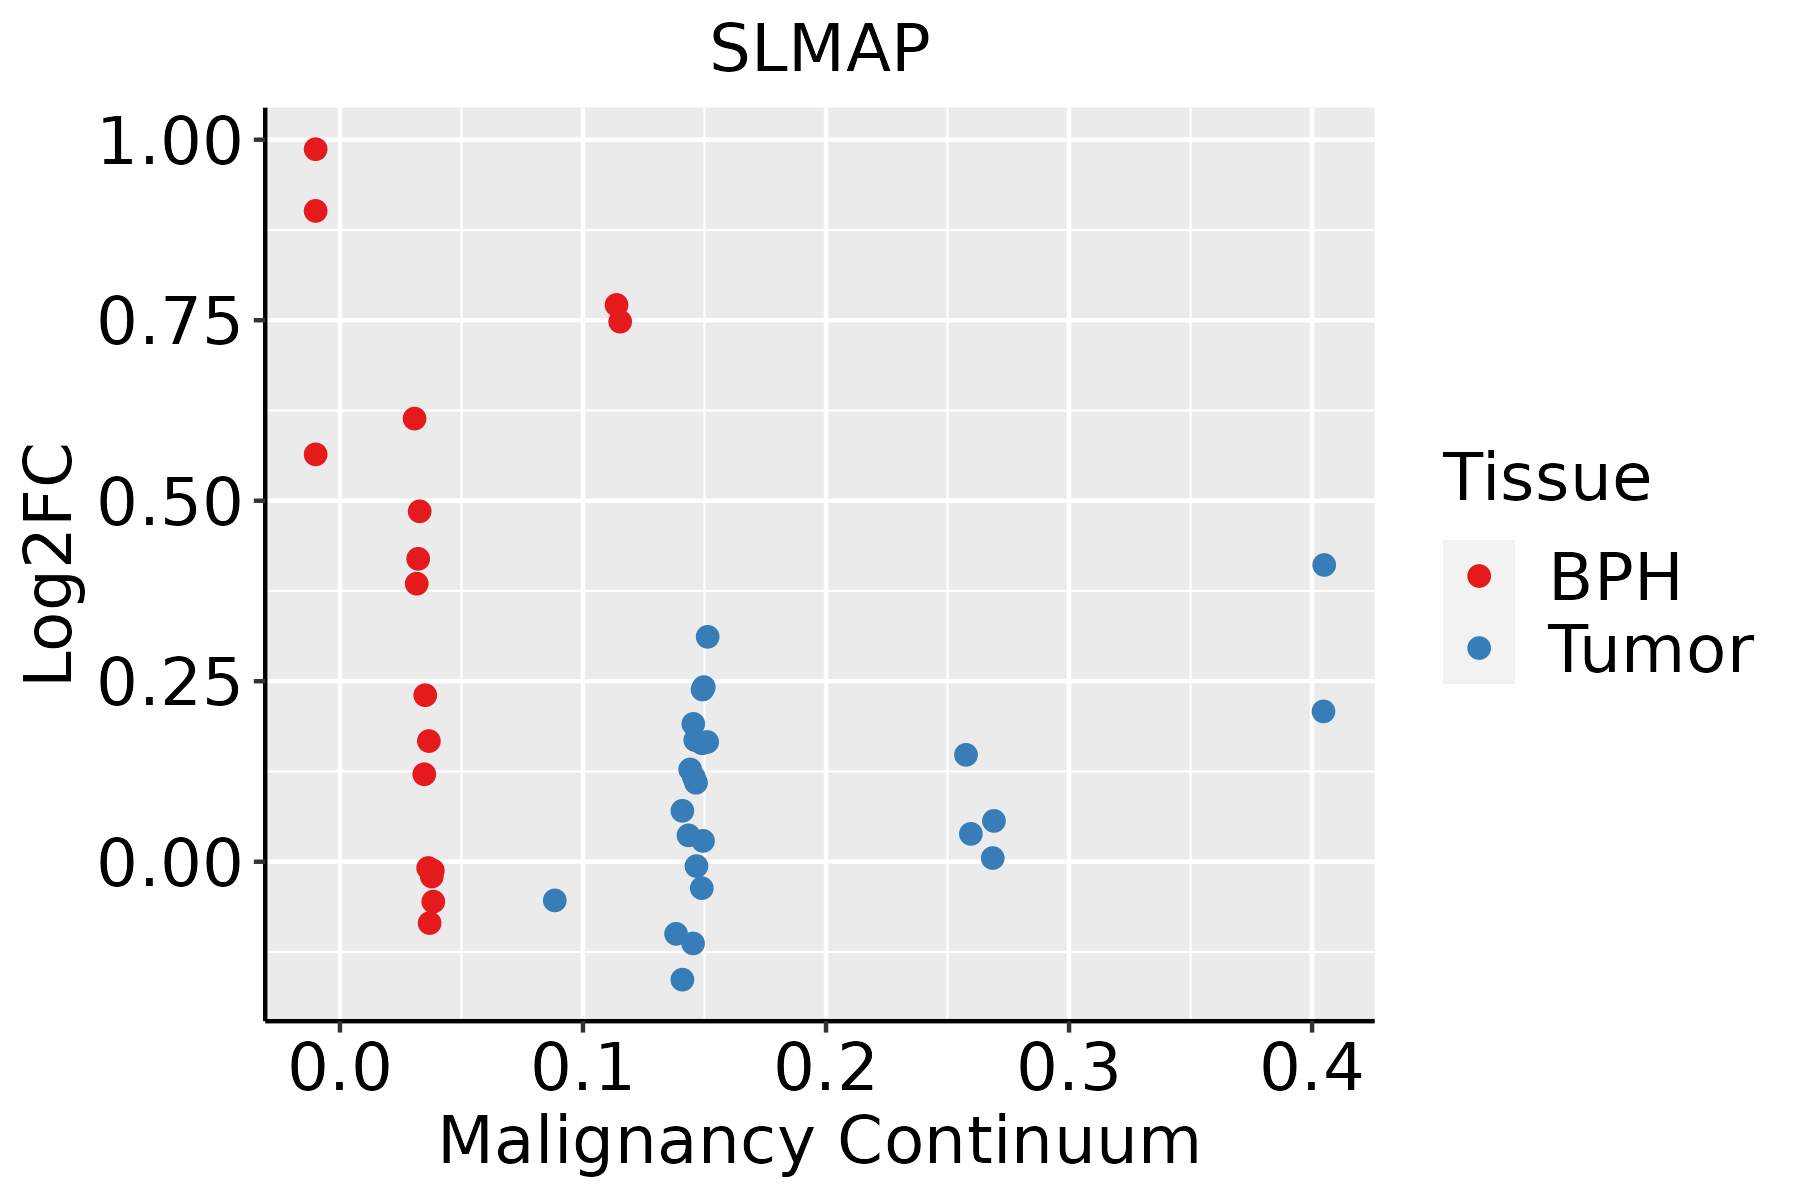
BPH: Benign Prostatic Hyperplasia
SkinThe image shows the transcriptomic changes along malignancy continuum.log2FC in expression of this searched gene in stem-like cells from each diseased tissue sample relative to stem-like cells in normal samples in each tissue plotted against the malignancy continuum. Samples are colored based on if they are from different disease stage.
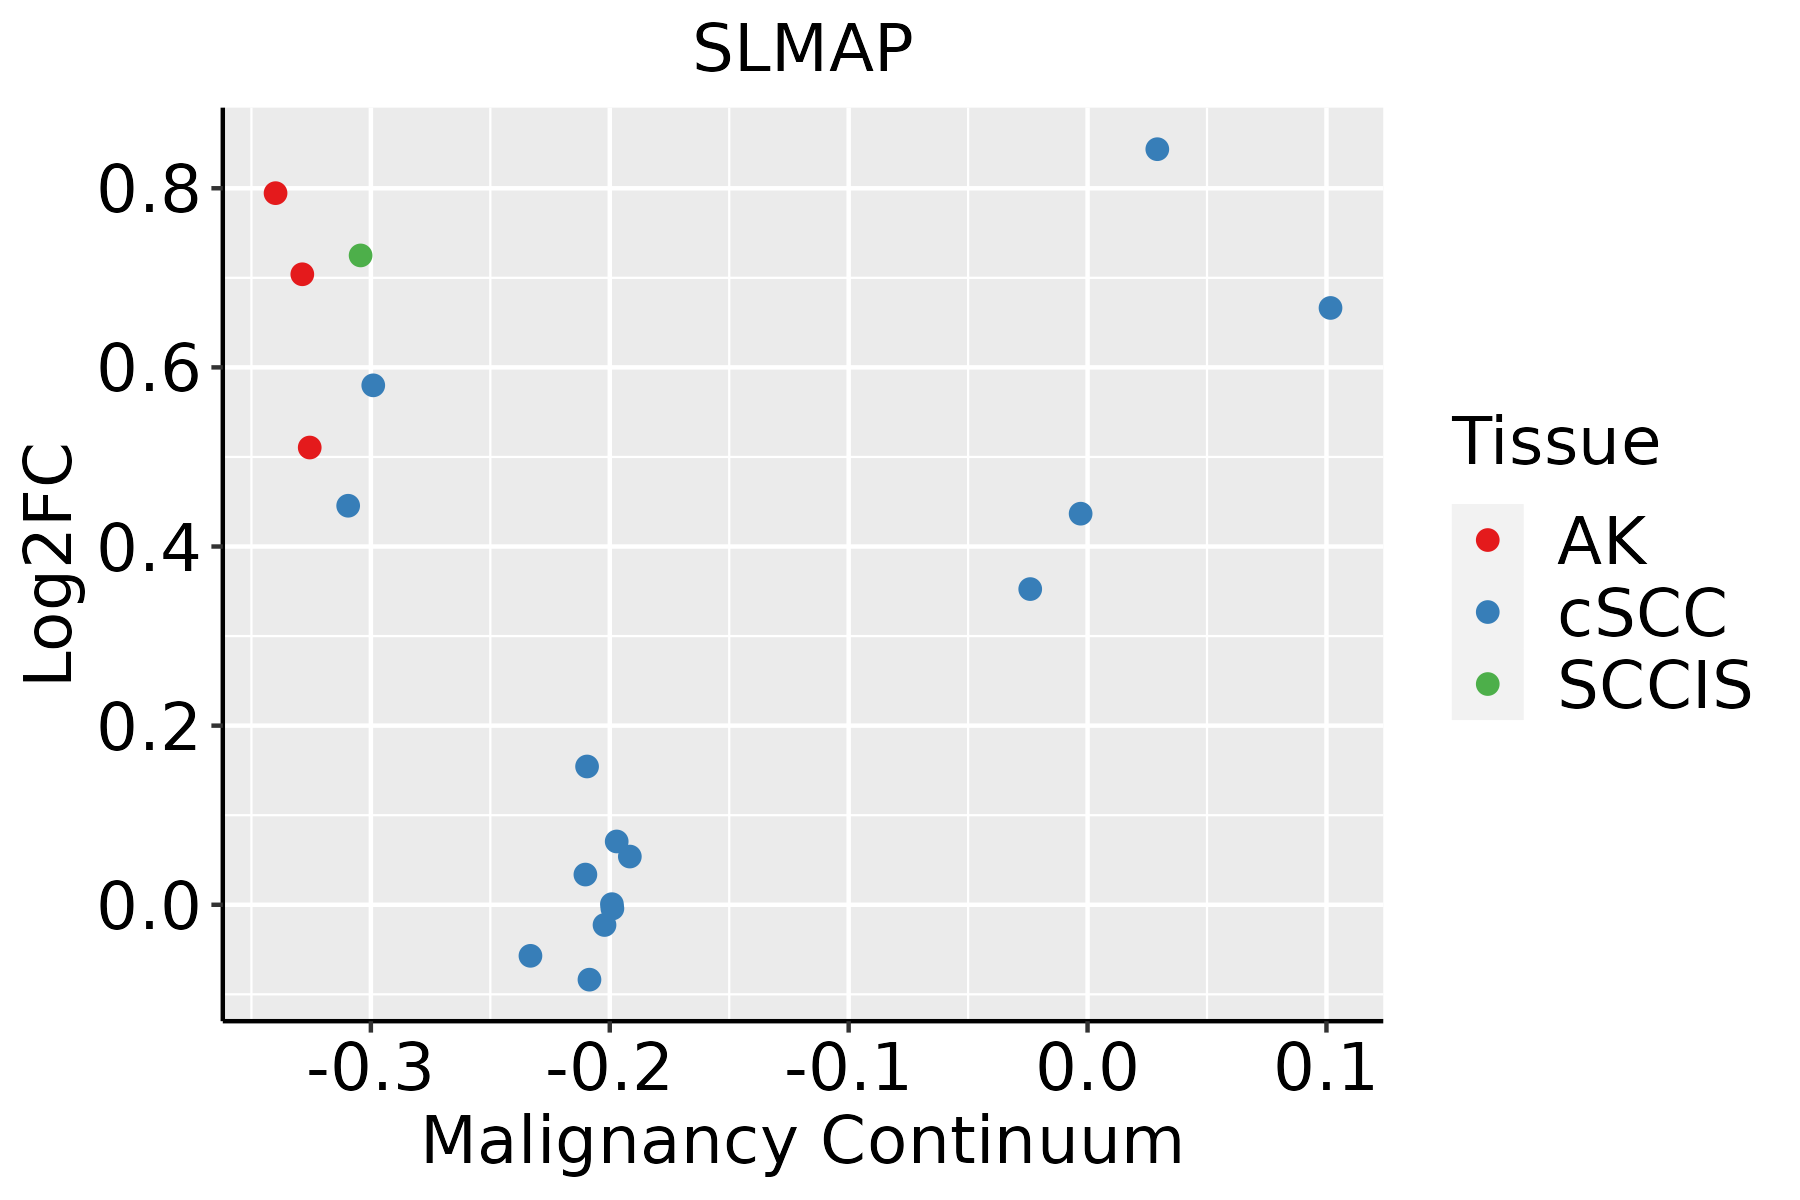
AK: Actinic keratosis
cSCC: Cutaneous squamous cell carcinoma
SCCIS:squamous cell carcinoma in situ
ThyroidThe image shows the transcriptomic changes along malignancy continuum.log2FC in expression of this searched gene in stem-like cells from each diseased tissue sample relative to stem-like cells in normal samples in each tissue plotted against the malignancy continuum. Samples are colored based on if they are from different disease stage.
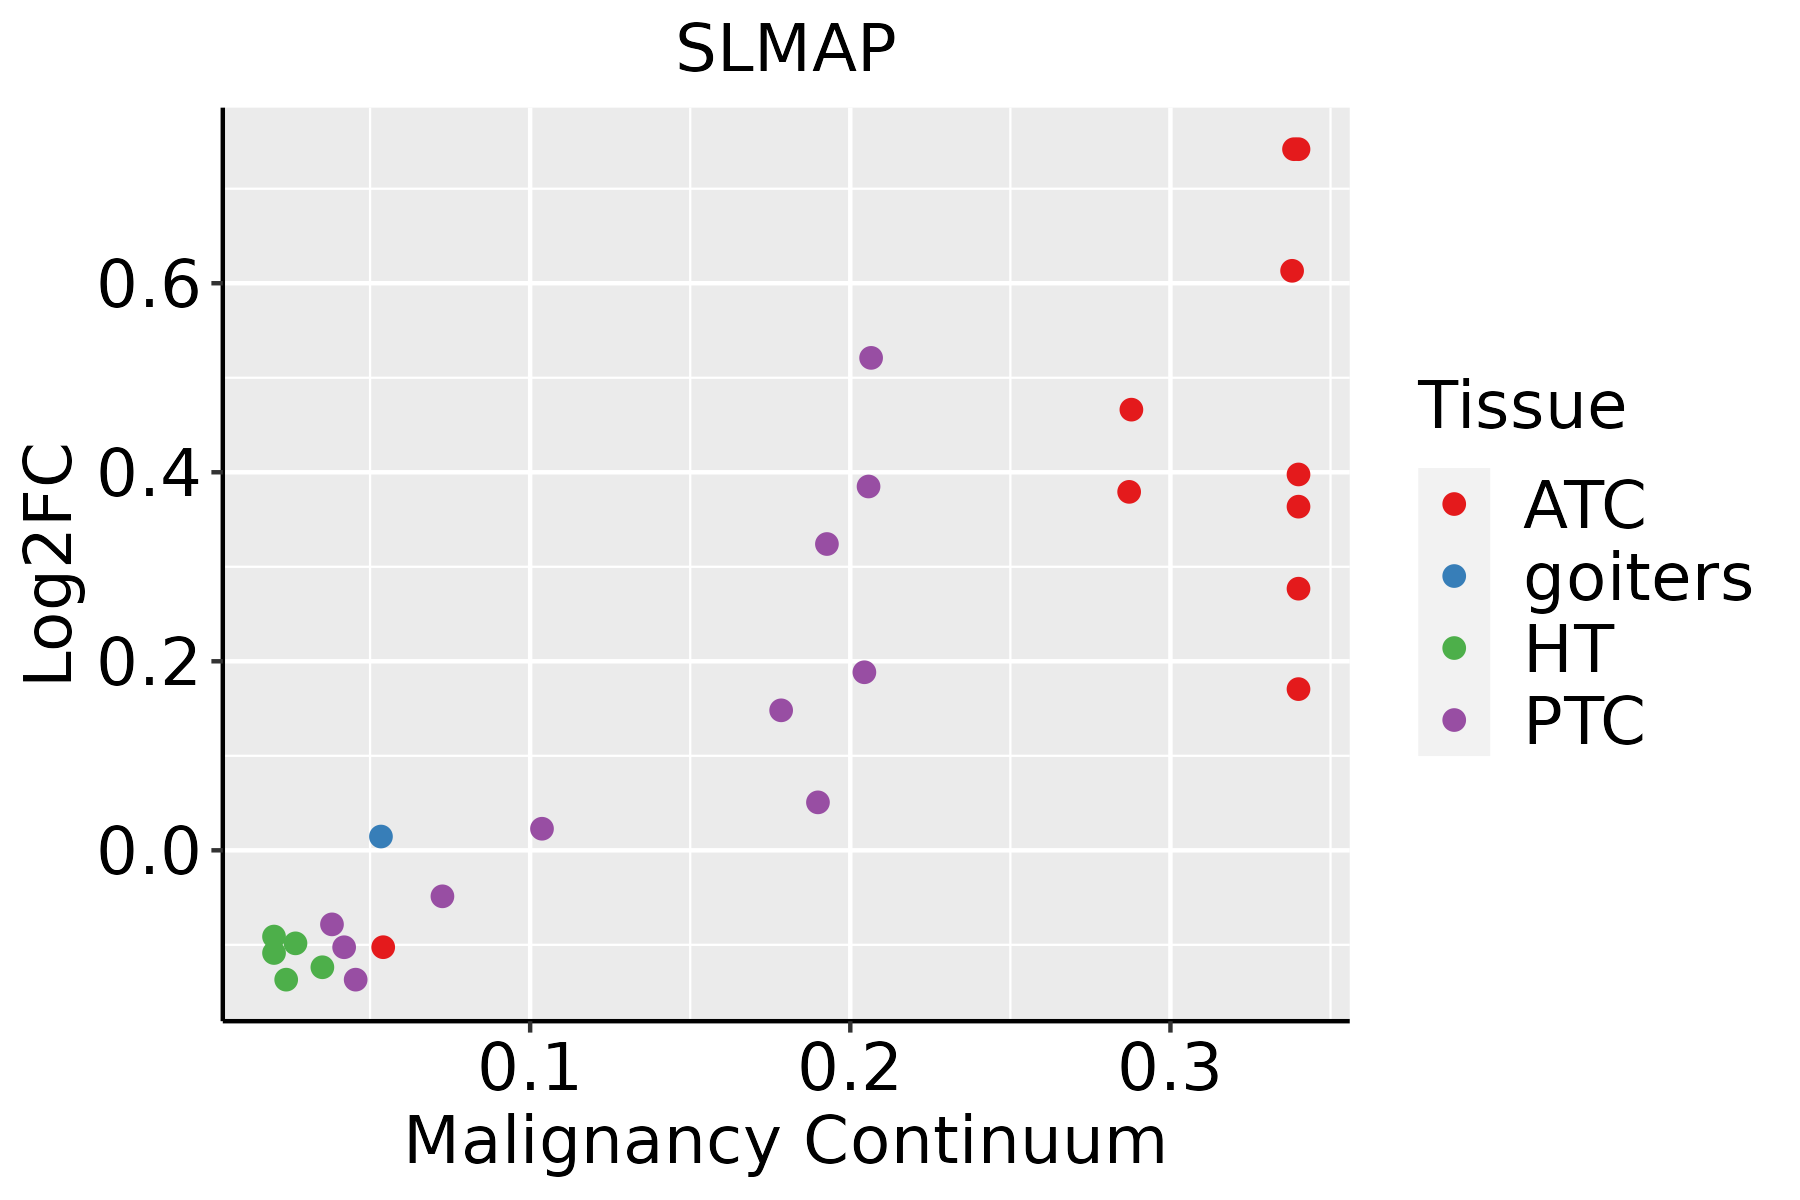
ATC: Anaplastic thyroid cancer
HT: Hashimoto's thyroiditis
PTC: Papillary thyroid cancer
∗log2FC in expression of this searched gene in stem-like cells from each diseased tissue sample relative to stem-like cells in normal samples in each tissue plotted against the malignancy continuum. Samples are colored based on if they are from different disease stage.

Top

Malignant transformation related pathway analysis

check buttonFind out the enriched GO biological processes and KEGG pathways involved in transition from healthy to precancer to cancer
check button Figure of enriched GO biological processes.
TissueDisease StageEnriched GO biological Processes
ColorectumADGO analysis - Figure of enriched GO biological processes: Top 15 enriched GO BP terms are showed in the bar plot of each disease state in each tissue. Each row represents a significant GO biological process which is colored according to the -log10(p.adjust).
ColorectumSERGO analysis - Figure of enriched GO biological processes: Top 15 enriched GO BP terms are showed in the bar plot of each disease state in each tissue. Each row represents a significant GO biological process which is colored according to the -log10(p.adjust).
ColorectumMSSGO analysis - Figure of enriched GO biological processes: Top 15 enriched GO BP terms are showed in the bar plot of each disease state in each tissue. Each row represents a significant GO biological process which is colored according to the -log10(p.adjust).
ColorectumMSI-HGO analysis - Figure of enriched GO biological processes: Top 15 enriched GO BP terms are showed in the bar plot of each disease state in each tissue. Each row represents a significant GO biological process which is colored according to the -log10(p.adjust).
ColorectumFAPGO analysis - Figure of enriched GO biological processes: Top 15 enriched GO BP terms are showed in the bar plot of each disease state in each tissue. Each row represents a significant GO biological process which is colored according to the -log10(p.adjust).
∗Top 15 enriched GO BP terms are showed in the bar plot of each disease state in each tissue. Each row represents a significant GO biological process which is colored according to the -log10(p.adjust).
Page: 1 2 3 4 5 6 7 8 9 

check button Enriched GO biological processes.
GO IDTissueDisease StageDescriptionGene RatioBg Ratiopvaluep.adjustCount
GO:007265910CervixCCprotein localization to plasma membrane73/2311284/187234.95e-106.73e-0873
GO:19907788CervixCCprotein localization to cell periphery78/2311333/187231.22e-089.73e-0778
GO:19023059CervixCCregulation of sodium ion transmembrane transport19/231168/187234.21e-044.25e-0319
GO:00020288CervixCCregulation of sodium ion transport21/231190/187232.71e-031.85e-0221
GO:20006498CervixCCregulation of sodium ion transmembrane transporter activity15/231158/187233.75e-032.38e-0215
GO:007265913CervixHSIL_HPVprotein localization to plasma membrane21/737284/187234.36e-033.68e-0221
GO:0072659ColorectumADprotein localization to plasma membrane122/3918284/187232.86e-171.49e-14122
GO:1990778ColorectumADprotein localization to cell periphery129/3918333/187235.51e-141.15e-11129
GO:0002028ColorectumADregulation of sodium ion transport36/391890/187232.89e-055.37e-0436
GO:1902305ColorectumADregulation of sodium ion transmembrane transport27/391868/187233.19e-043.80e-0327
GO:2000649ColorectumADregulation of sodium ion transmembrane transporter activity23/391858/187238.82e-048.53e-0323
GO:00726591ColorectumSERprotein localization to plasma membrane92/2897284/187236.36e-131.86e-1092
GO:19907781ColorectumSERprotein localization to cell periphery98/2897333/187236.09e-119.57e-0998
GO:00020281ColorectumSERregulation of sodium ion transport28/289790/187231.45e-042.86e-0328
GO:19023051ColorectumSERregulation of sodium ion transmembrane transport21/289768/187231.05e-031.22e-0221
GO:20006491ColorectumSERregulation of sodium ion transmembrane transporter activity18/289758/187232.18e-032.11e-0218
GO:0003012ColorectumSERmuscle system process92/2897452/187232.98e-032.63e-0292
GO:0032409ColorectumSERregulation of transporter activity65/2897310/187235.71e-034.19e-0265
GO:00726592ColorectumMSSprotein localization to plasma membrane113/3467284/187233.23e-171.55e-14113
GO:19907782ColorectumMSSprotein localization to cell periphery120/3467333/187232.02e-145.47e-12120
Page: 1 2 3 4 5 6 7 8 

check button Enriched KEGG pathways.
Pathway IDTissueDisease StageDescriptionGene RatioBg Ratiopvaluep.adjustqvalueCount
Page: 1 

Top

Cell-cell communication analysis

check buttonIdentification of potential cell-cell interactions between two cell types and their ligand-receptor pairs for different disease states
LigandReceptorLRpairPathwayTissueDisease Stage
Page: 1 

Top

Single-cell gene regulatory network inference analysis

check buttonFind out the significant the regulons (TFs) and the target genes of each regulon across cell types for different disease states
TFCell TypeTissueDisease StageTarget GeneRSSRegulon Activity
∗The dot plots of a searched regulon are shown for all cell subpopulations in each disease state of each tissue based on the regulon specific score inferred using pySCENIC and by calculating the average expression.
Page: 1 

Top

Somatic mutation of malignant transformation related genes

check buttonAnnotation of somatic variants for genes involved in malignant transformation
Hugo SymbolVariant ClassVariant ClassificationdbSNP RSHGVScHGVSpHGVSp ShortSWISSPROTBIOTYPESIFTPolyPhenTumor Sample BarcodeTissueHistologySexAgeStageTherapy TypesDrugsOutcome
SLMAPSNVMissense_Mutationc.292C>Gp.Leu98Valp.L98VQ14BN4protein_codingtolerated(0.11)benign(0.174)TCGA-A2-A0CR-01Breastbreast invasive carcinomaFemale<65I/IIChemotherapyadriamycinCR
SLMAPSNVMissense_Mutationnovelc.2287N>Cp.Glu763Glnp.E763QQ14BN4protein_codingdeleterious_low_confidence(0.04)benign(0.103)TCGA-A2-A0CX-01Breastbreast invasive carcinomaFemale<65I/IIChemotherapyadriamycinSD
SLMAPSNVMissense_Mutationc.1948N>Cp.Glu650Glnp.E650QQ14BN4protein_codingdeleterious_low_confidence(0.04)benign(0.164)TCGA-AC-A23H-01Breastbreast invasive carcinomaFemale>=65I/IIUnknownUnknownPD
SLMAPSNVMissense_Mutationc.560N>Tp.Ala187Valp.A187VQ14BN4protein_codingdeleterious(0.04)probably_damaging(0.954)TCGA-BH-A18G-01Breastbreast invasive carcinomaFemale>=65I/IIUnknownUnknownSD
SLMAPSNVMissense_Mutationnovelc.487C>Gp.Gln163Glup.Q163EQ14BN4protein_codingtolerated(0.16)probably_damaging(0.986)TCGA-BH-A2L8-01Breastbreast invasive carcinomaFemale<65I/IIChemotherapycytoxanCR
SLMAPSNVMissense_Mutationnovelc.1996T>Cp.Trp666Argp.W666RQ14BN4protein_codingtolerated_low_confidence(0.25)benign(0.445)TCGA-EW-A2FR-01Breastbreast invasive carcinomaFemale<65III/IVChemotherapyepirubicinSD
SLMAPSNVMissense_Mutationrs146606397c.826N>Ap.Glu276Lysp.E276KQ14BN4protein_codingdeleterious(0.01)probably_damaging(0.997)TCGA-PE-A5DE-01Breastbreast invasive carcinomaFemale<65I/IIChemotherapytaxotereCR
SLMAPSNVMissense_Mutationrs372758327c.1604N>Ap.Arg535Glnp.R535QQ14BN4protein_codingtolerated_low_confidence(0.07)benign(0.107)TCGA-S3-A6ZG-01Breastbreast invasive carcinomaFemale>=65I/IIChemotherapydoxorubicinCR
SLMAPinsertionIn_Frame_Insnovelc.2388_2389insAATp.Asn798dupp.N798dupQ14BN4protein_codingTCGA-C8-A138-01Breastbreast invasive carcinomaFemale<65III/IVUnknownUnknownSD
SLMAPSNVMissense_Mutationrs765688735c.1508G>Ap.Arg503Glnp.R503QQ14BN4protein_codingdeleterious_low_confidence(0.01)benign(0.023)TCGA-2W-A8YY-01Cervixcervical & endocervical cancerFemale<65I/IIChemotherapycisplatinCR
Page: 1 2 3 4 5 6 7 

Top

Related drugs of malignant transformation related genes

check buttonIdentification of chemicals and drugs interact with genes involved in malignant transfromation
(DGIdb 4.0)
Entrez IDSymbolCategoryInteraction TypesDrug Claim NameDrug NamePMIDs
Page: 1