Schematic overview of the cellular and molecular mechanisms involved in the cancer progression, including the proposed cellular and molecular mechanisms in cancer cells trajectory. AT1: alveolar type 1 cells; AT2: alveolar type 2 cells; AAH: atypical adenomatous hyperplasia; AIS: adenocarcinoma in situ; MIA: minimally invasive adenocarcinoma; IA: invasive adenocarcinoma; EMT: epithelial-mesenchymal transition

Home

Download

Statistics

Help

Contact

Center for Computational Systems Medicine
leaf

Gene summary

leaf

Malignant transformation analysis

leaf

Malignant transformation related pathway analysis

leaf

Cell-cell communication analysis

leaf

Single-cell gene regulatory network inference analysis

leaf

Somatic mutation of malignant transformation related genes

leaf

Related drugs of malignant transformation related genes

Gene: SLK

Gene summary for SLK

check button Gene summary.

Gene informationSpeciesHuman
Gene symbol

SLK

Gene ID

9748

Gene nameSTE20 like kinase
Gene AliasLOSK
Cytomap10q24.33-q25.1
Gene Typeprotein-coding
GO ID

GO:0000226

UniProtAcc

Q9H2G2


Top

Malignant transformation analysis

check button Identification of the aberrant gene expression in precancerous and cancerous lesions by comparing the gene expression of stem-like cells in diseased tissues with normal stem cells
check button Malignant transformation involving gene list.
Entrez IDSymbolReplicatesSpeciesOrganTissueAdj P-valueLog2FCMalignancy
9748SLKCCI_1HumanCervixCC1.55e-047.48e-010.528
9748SLKCCI_2HumanCervixCC5.31e-121.09e+000.5249
9748SLKsample3HumanCervixCC8.00e-113.50e-010.1387
9748SLKH2HumanCervixHSIL_HPV2.28e-053.65e-010.0632
9748SLKT3HumanCervixCC6.73e-113.67e-010.1389
9748SLKHTA11_3410_2000001011HumanColorectumAD4.10e-03-3.46e-010.0155
9748SLKHTA11_347_2000001011HumanColorectumAD1.66e-022.70e-01-0.1954
9748SLKHTA11_99999974143_84620HumanColorectumMSS2.55e-07-4.00e-010.3005
9748SLKA015-C-203HumanColorectumFAP8.84e-14-6.08e-02-0.1294
9748SLKA002-C-201HumanColorectumFAP2.20e-06-7.81e-020.0324
9748SLKA001-C-119HumanColorectumFAP4.37e-023.61e-02-0.1557
9748SLKA001-C-108HumanColorectumFAP1.42e-113.04e-01-0.0272
9748SLKA002-C-205HumanColorectumFAP2.03e-158.12e-02-0.1236
9748SLKA015-C-006HumanColorectumFAP6.32e-121.90e-01-0.0994
9748SLKA015-C-106HumanColorectumFAP1.28e-066.84e-02-0.0511
9748SLKA002-C-114HumanColorectumFAP1.16e-126.58e-02-0.1561
9748SLKA015-C-104HumanColorectumFAP4.31e-199.81e-02-0.1899
9748SLKA001-C-014HumanColorectumFAP1.06e-062.21e-010.0135
9748SLKA002-C-016HumanColorectumFAP7.79e-092.43e-020.0521
9748SLKA015-C-002HumanColorectumFAP1.17e-05-1.60e-01-0.0763
Page: 1 2 3 4 5 6 7 8 

check button Transcriptomic changes along malignancy continuum.
TissueExpression DynamicsAbbreviation
CervixThe image shows the transcriptomic changes along malignancy continuum.log2FC in expression of this searched gene in stem-like cells from each diseased tissue sample relative to stem-like cells in normal samples in each tissue plotted against the malignancy continuum. Samples are colored based on if they are from different disease stage.CC: Cervix cancer
HSIL_HPV: HPV-infected high-grade squamous intraepithelial lesions
N_HPV: HPV-infected normal cervix
Colorectum (GSE201348)The image shows the transcriptomic changes along malignancy continuum.log2FC in expression of this searched gene in stem-like cells from each diseased tissue sample relative to stem-like cells in normal samples in each tissue plotted against the malignancy continuum. Samples are colored based on if they are from different disease stage.FAP: Familial adenomatous polyposis
CRC: Colorectal cancer
Colorectum (HTA11)The image shows the transcriptomic changes along malignancy continuum.log2FC in expression of this searched gene in stem-like cells from each diseased tissue sample relative to stem-like cells in normal samples in each tissue plotted against the malignancy continuum. Samples are colored based on if they are from different disease stage.AD: Adenomas
SER: Sessile serrated lesions
MSI-H: Microsatellite-high colorectal cancer
MSS: Microsatellite stable colorectal cancer
EsophagusThe image shows the transcriptomic changes along malignancy continuum.log2FC in expression of this searched gene in stem-like cells from each diseased tissue sample relative to stem-like cells in normal samples in each tissue plotted against the malignancy continuum. Samples are colored based on if they are from different disease stage.ESCC: Esophageal squamous cell carcinoma
HGIN: High-grade intraepithelial neoplasias
LGIN: Low-grade intraepithelial neoplasias
LiverThe image shows the transcriptomic changes along malignancy continuum.log2FC in expression of this searched gene in stem-like cells from each diseased tissue sample relative to stem-like cells in normal samples in each tissue plotted against the malignancy continuum. Samples are colored based on if they are from different disease stage.
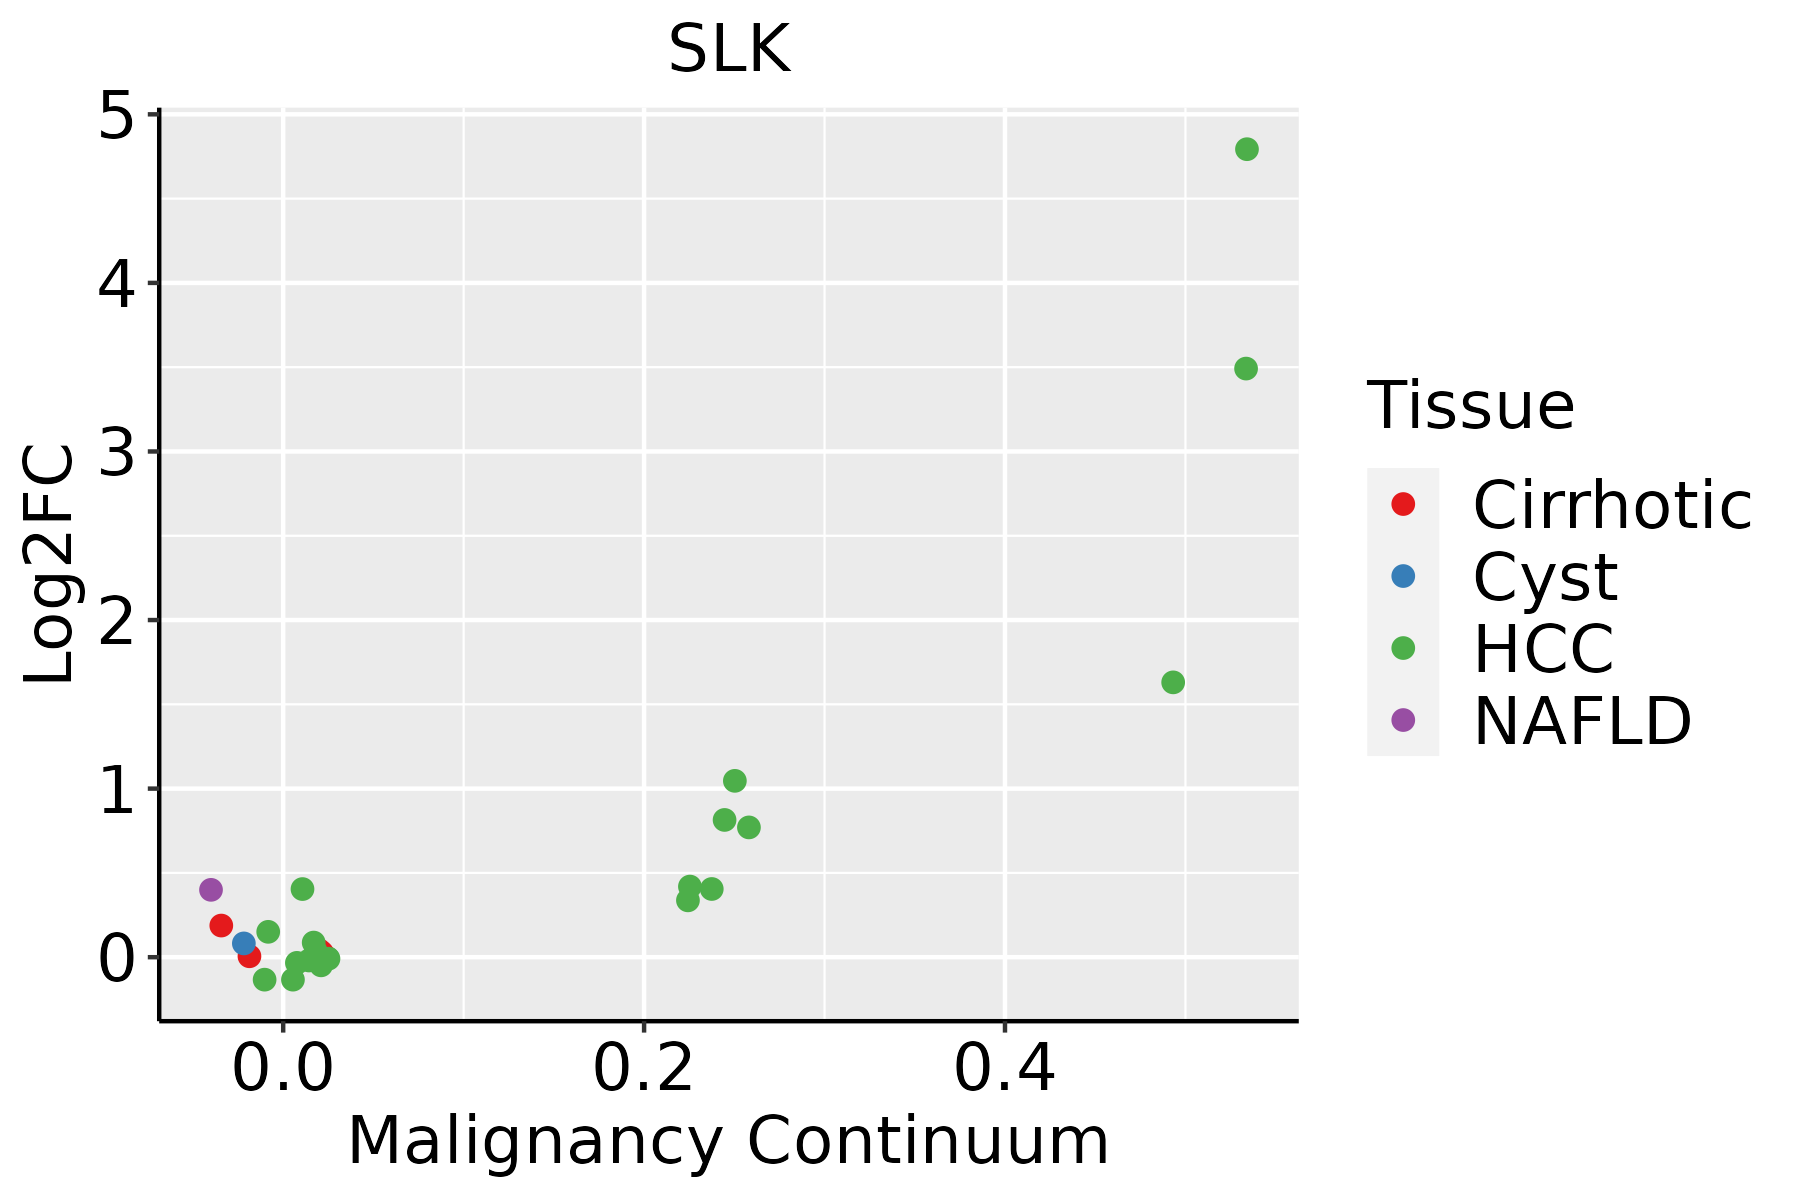
HCC: Hepatocellular carcinoma
NAFLD: Non-alcoholic fatty liver disease
Oral CavityThe image shows the transcriptomic changes along malignancy continuum.log2FC in expression of this searched gene in stem-like cells from each diseased tissue sample relative to stem-like cells in normal samples in each tissue plotted against the malignancy continuum. Samples are colored based on if they are from different disease stage.
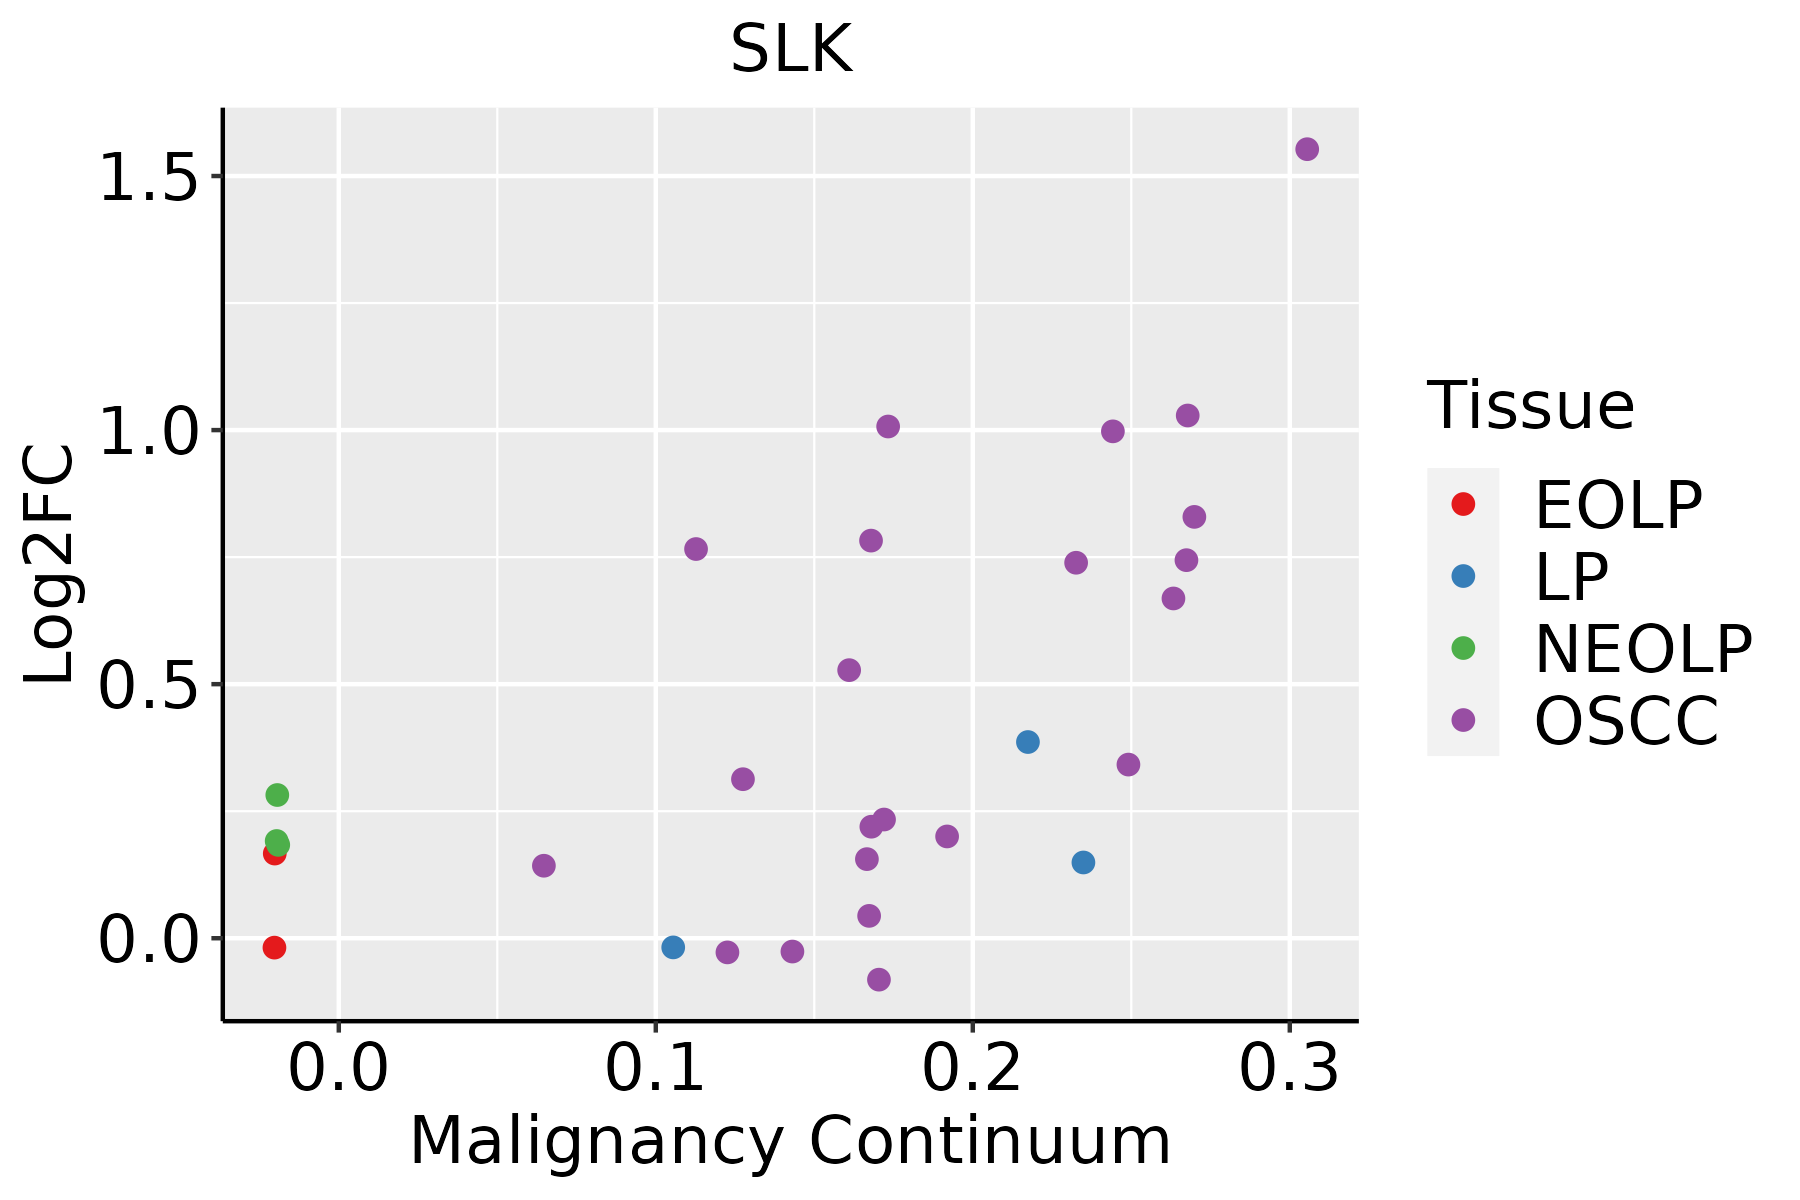
EOLP: Erosive Oral lichen planus
LP: leukoplakia
NEOLP: Non-erosive oral lichen planus
OSCC: Oral squamous cell carcinoma
ProstateThe image shows the transcriptomic changes along malignancy continuum.log2FC in expression of this searched gene in stem-like cells from each diseased tissue sample relative to stem-like cells in normal samples in each tissue plotted against the malignancy continuum. Samples are colored based on if they are from different disease stage.BPH: Benign Prostatic Hyperplasia
SkinThe image shows the transcriptomic changes along malignancy continuum.log2FC in expression of this searched gene in stem-like cells from each diseased tissue sample relative to stem-like cells in normal samples in each tissue plotted against the malignancy continuum. Samples are colored based on if they are from different disease stage.
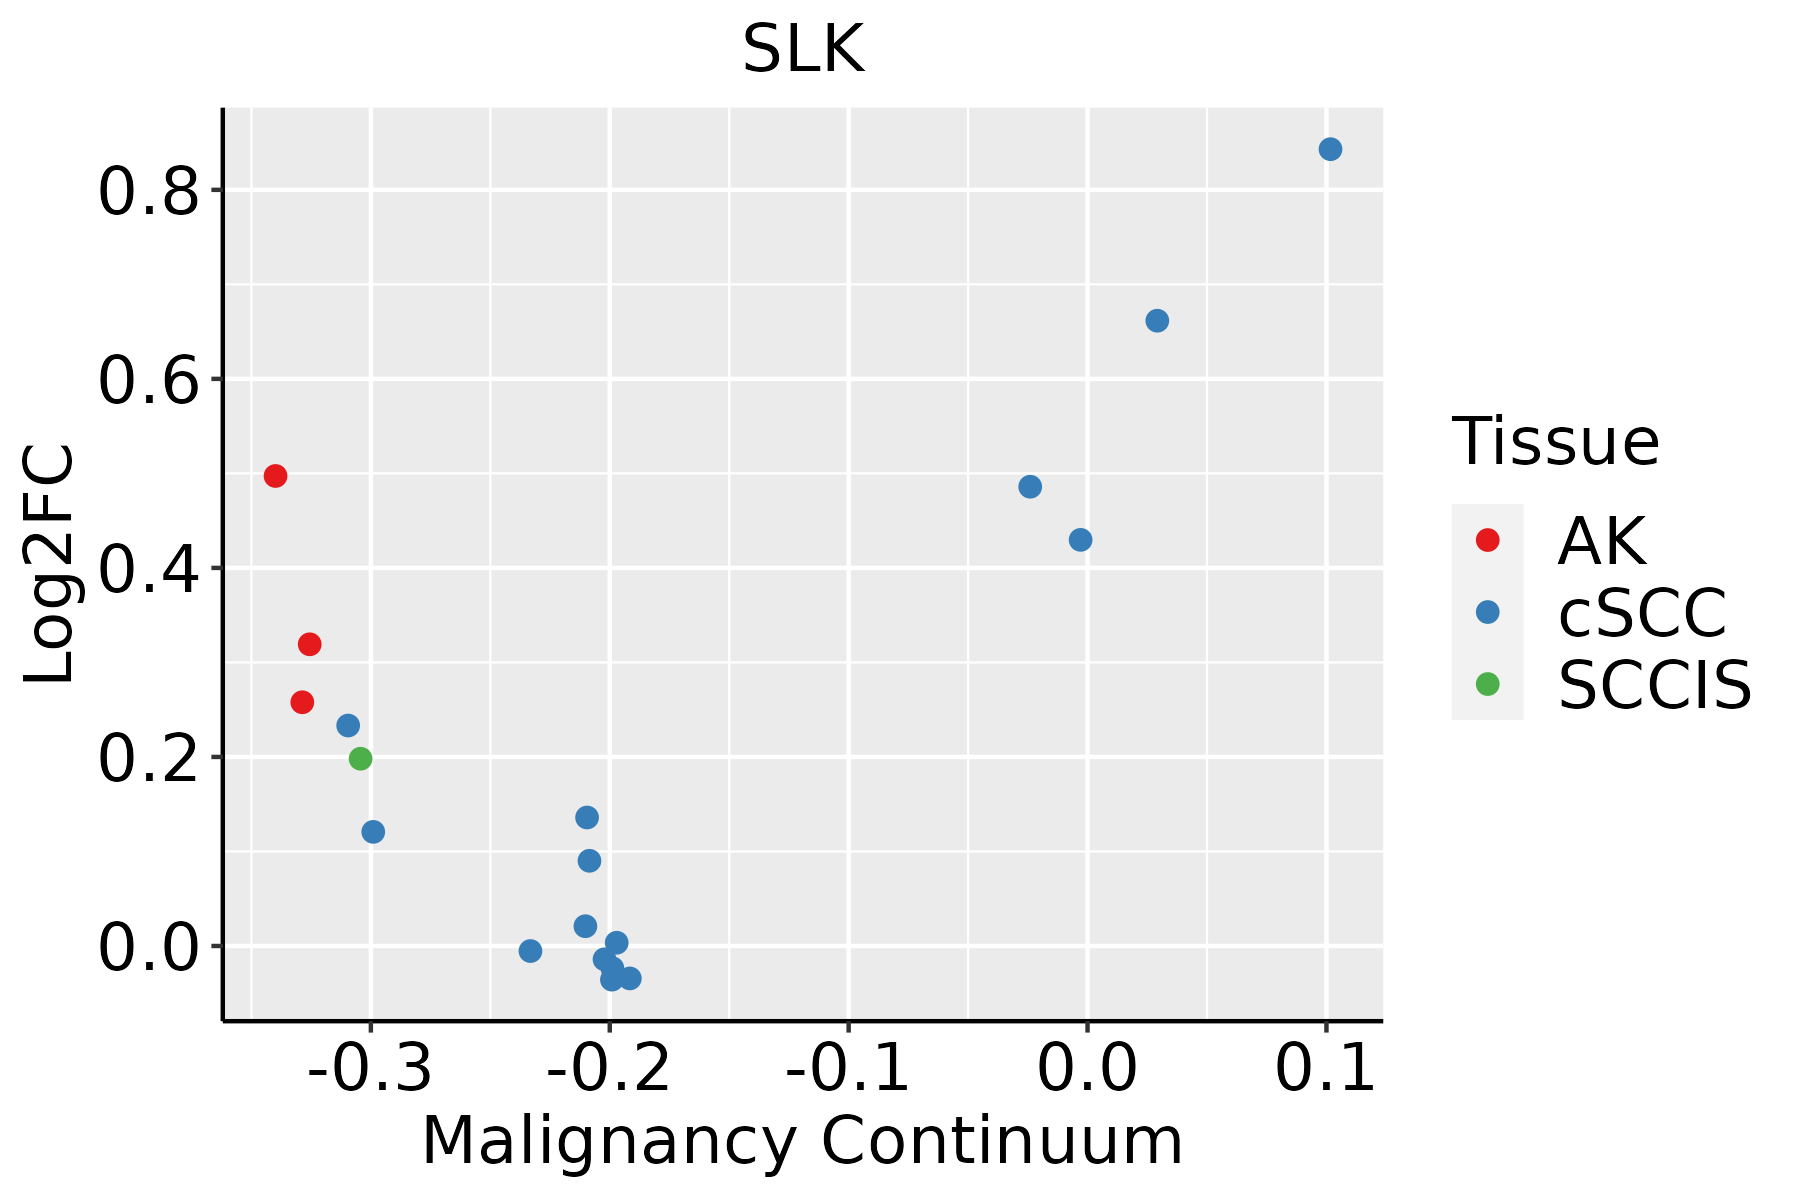
AK: Actinic keratosis
cSCC: Cutaneous squamous cell carcinoma
SCCIS:squamous cell carcinoma in situ
ThyroidThe image shows the transcriptomic changes along malignancy continuum.log2FC in expression of this searched gene in stem-like cells from each diseased tissue sample relative to stem-like cells in normal samples in each tissue plotted against the malignancy continuum. Samples are colored based on if they are from different disease stage.
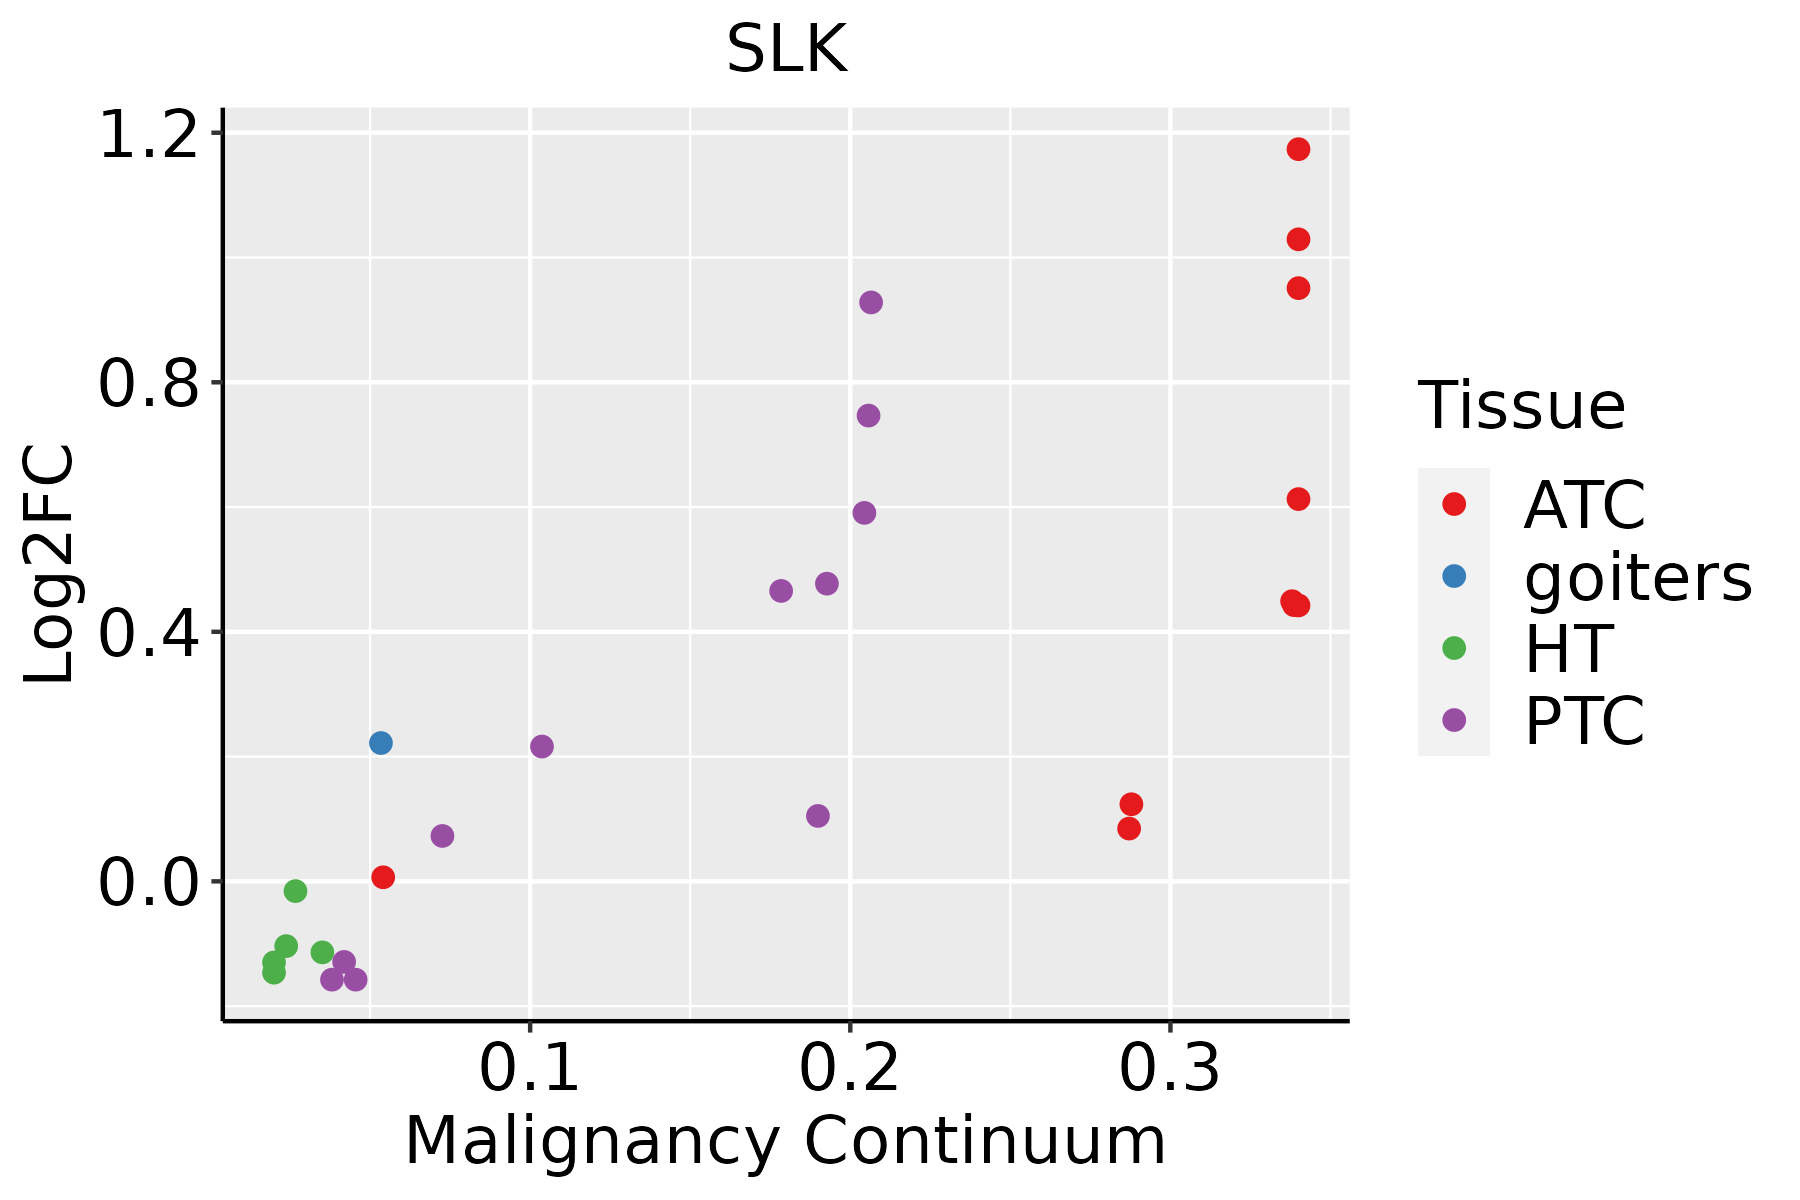
ATC: Anaplastic thyroid cancer
HT: Hashimoto's thyroiditis
PTC: Papillary thyroid cancer
∗log2FC in expression of this searched gene in stem-like cells from each diseased tissue sample relative to stem-like cells in normal samples in each tissue plotted against the malignancy continuum. Samples are colored based on if they are from different disease stage.

Top

Malignant transformation related pathway analysis

check buttonFind out the enriched GO biological processes and KEGG pathways involved in transition from healthy to precancer to cancer
check button Figure of enriched GO biological processes.
TissueDisease StageEnriched GO biological Processes
ColorectumADGO analysis - Figure of enriched GO biological processes: Top 15 enriched GO BP terms are showed in the bar plot of each disease state in each tissue. Each row represents a significant GO biological process which is colored according to the -log10(p.adjust).
ColorectumSERGO analysis - Figure of enriched GO biological processes: Top 15 enriched GO BP terms are showed in the bar plot of each disease state in each tissue. Each row represents a significant GO biological process which is colored according to the -log10(p.adjust).
ColorectumMSSGO analysis - Figure of enriched GO biological processes: Top 15 enriched GO BP terms are showed in the bar plot of each disease state in each tissue. Each row represents a significant GO biological process which is colored according to the -log10(p.adjust).
ColorectumMSI-HGO analysis - Figure of enriched GO biological processes: Top 15 enriched GO BP terms are showed in the bar plot of each disease state in each tissue. Each row represents a significant GO biological process which is colored according to the -log10(p.adjust).
ColorectumFAPGO analysis - Figure of enriched GO biological processes: Top 15 enriched GO BP terms are showed in the bar plot of each disease state in each tissue. Each row represents a significant GO biological process which is colored according to the -log10(p.adjust).
∗Top 15 enriched GO BP terms are showed in the bar plot of each disease state in each tissue. Each row represents a significant GO biological process which is colored according to the -log10(p.adjust).
Page: 1 2 3 4 5 6 7 8 9 

check button Enriched GO biological processes.
GO IDTissueDisease StageDescriptionGene RatioBg Ratiopvaluep.adjustCount
GO:001081010CervixCCregulation of cell-substrate adhesion69/2311221/187238.57e-145.69e-1169
GO:00315898CervixCCcell-substrate adhesion96/2311363/187231.48e-138.85e-1196
GO:01501159CervixCCcell-substrate junction organization37/2311101/187233.20e-104.46e-0837
GO:00070448CervixCCcell-substrate junction assembly34/231195/187233.35e-093.45e-0734
GO:00019528CervixCCregulation of cell-matrix adhesion40/2311128/187231.32e-081.04e-0640
GO:00071608CervixCCcell-matrix adhesion60/2311233/187231.58e-081.23e-0660
GO:00343298CervixCCcell junction assembly88/2311420/187233.42e-071.38e-0588
GO:01501169CervixCCregulation of cell-substrate junction organization25/231171/187235.58e-072.06e-0525
GO:00480417CervixCCfocal adhesion assembly28/231187/187239.86e-073.45e-0528
GO:00518938CervixCCregulation of focal adhesion assembly22/231166/187237.37e-061.73e-0422
GO:00901098CervixCCregulation of cell-substrate junction assembly22/231166/187237.37e-061.73e-0422
GO:19018886CervixCCregulation of cell junction assembly42/2311204/187235.50e-045.29e-0342
GO:00311224CervixCCcytoplasmic microtubule organization14/231156/187236.93e-033.74e-0214
GO:003158914CervixHSIL_HPVcell-substrate adhesion30/737363/187231.12e-042.34e-0330
GO:001081014CervixHSIL_HPVregulation of cell-substrate adhesion19/737221/187231.22e-031.44e-0219
GO:003432913CervixHSIL_HPVcell junction assembly28/737420/187234.82e-033.98e-0228
GO:0034329ColorectumADcell junction assembly136/3918420/187232.02e-081.15e-06136
GO:0010810ColorectumADregulation of cell-substrate adhesion81/3918221/187234.80e-082.55e-0681
GO:0150115ColorectumADcell-substrate junction organization44/3918101/187232.38e-079.81e-0644
GO:0031589ColorectumADcell-substrate adhesion116/3918363/187234.68e-071.76e-05116
Page: 1 2 3 4 5 6 7 8 9 10 11 

check button Enriched KEGG pathways.
Pathway IDTissueDisease StageDescriptionGene RatioBg Ratiopvaluep.adjustqvalueCount
hsa041146EsophagusESCCOocyte meiosis77/4205131/84652.19e-024.80e-022.46e-0277
hsa0411411EsophagusESCCOocyte meiosis77/4205131/84652.19e-024.80e-022.46e-0277
hsa04114Oral cavityOSCCOocyte meiosis74/3704131/84652.13e-035.75e-032.92e-0374
hsa041141Oral cavityOSCCOocyte meiosis74/3704131/84652.13e-035.75e-032.92e-0374
hsa041142Oral cavityEOLPOocyte meiosis33/1218131/84657.09e-042.69e-031.59e-0333
hsa041143Oral cavityEOLPOocyte meiosis33/1218131/84657.09e-042.69e-031.59e-0333
hsa041144Oral cavityNEOLPOocyte meiosis31/1112131/84656.64e-043.52e-032.21e-0331
hsa041145Oral cavityNEOLPOocyte meiosis31/1112131/84656.64e-043.52e-032.21e-0331
Page: 1 

Top

Cell-cell communication analysis

check buttonIdentification of potential cell-cell interactions between two cell types and their ligand-receptor pairs for different disease states
LigandReceptorLRpairPathwayTissueDisease Stage
Page: 1 

Top

Single-cell gene regulatory network inference analysis

check buttonFind out the significant the regulons (TFs) and the target genes of each regulon across cell types for different disease states
TFCell TypeTissueDisease StageTarget GeneRSSRegulon Activity
∗The dot plots of a searched regulon are shown for all cell subpopulations in each disease state of each tissue based on the regulon specific score inferred using pySCENIC and by calculating the average expression.
Page: 1 

Top

Somatic mutation of malignant transformation related genes

check buttonAnnotation of somatic variants for genes involved in malignant transformation
Hugo SymbolVariant ClassVariant ClassificationdbSNP RSHGVScHGVSpHGVSp ShortSWISSPROTBIOTYPESIFTPolyPhenTumor Sample BarcodeTissueHistologySexAgeStageTherapy TypesDrugsOutcome
SLKSNVMissense_Mutationrs771440768c.1735N>Ap.Glu579Lysp.E579KQ9H2G2protein_codingtolerated(0.74)benign(0.001)TCGA-AN-A046-01Breastbreast invasive carcinomaFemale>=65I/IIUnknownUnknownSD
SLKSNVMissense_Mutationnovelc.3034N>Ap.Glu1012Lysp.E1012KQ9H2G2protein_codingdeleterious(0)probably_damaging(0.994)TCGA-AO-A0JC-01Breastbreast invasive carcinomaFemale<65I/IIChemotherapyfluorouracilSD
SLKSNVMissense_Mutationc.1360N>Tp.Asn454Tyrp.N454YQ9H2G2protein_codingdeleterious(0.01)benign(0.115)TCGA-BH-A0DK-01Breastbreast invasive carcinomaFemale<65I/IIHormone TherapytamoxiphenSD
SLKSNVMissense_Mutationc.688N>Ap.Glu230Lysp.E230KQ9H2G2protein_codingdeleterious(0)benign(0.175)TCGA-D8-A27G-01Breastbreast invasive carcinomaFemale>=65I/IIUnknownUnknownSD
SLKSNVMissense_Mutationnovelc.179N>Ap.Ala60Aspp.A60DQ9H2G2protein_codingdeleterious(0)probably_damaging(0.999)TCGA-C5-A8YQ-01Cervixcervical & endocervical cancerFemale>=65I/IIChemotherapycisplatinPD
SLKSNVMissense_Mutationnovelc.2483G>Ap.Arg828Hisp.R828HQ9H2G2protein_codingdeleterious(0.01)probably_damaging(0.998)TCGA-EA-A3HS-01Cervixcervical & endocervical cancerFemale<65I/IIUnknownUnknownSD
SLKSNVMissense_Mutationc.1618N>Tp.Asp540Tyrp.D540YQ9H2G2protein_codingdeleterious(0.01)benign(0)TCGA-FU-A3HZ-01Cervixcervical & endocervical cancerFemale<65I/IIChemotherapycisplatinCR
SLKSNVMissense_Mutationrs554070501c.2774N>Ap.Arg925Glnp.R925QQ9H2G2protein_codingtolerated(0.06)possibly_damaging(0.453)TCGA-FU-A3HZ-01Cervixcervical & endocervical cancerFemale<65I/IIChemotherapycisplatinCR
SLKSNVMissense_Mutationc.64N>Ap.Glu22Lysp.E22KQ9H2G2protein_codingdeleterious(0)probably_damaging(0.97)TCGA-IR-A3LK-01Cervixcervical & endocervical cancerFemale>=65I/IIChemotherapycisplatinPD
SLKinsertionNonsense_Mutationnovelc.2732_2733insTAACTAGTATTTAAATTTp.Gln911delinsHisAsnTerTyrLeuAsnLeup.Q911delinsHN*YLNLQ9H2G2protein_codingTCGA-DS-A1OD-01Cervixcervical & endocervical cancerFemale<65I/IIChemotherapycisplatinSD
Page: 1 2 3 4 5 6 7 8 9 10 11 12 

Top

Related drugs of malignant transformation related genes

check buttonIdentification of chemicals and drugs interact with genes involved in malignant transfromation
(DGIdb 4.0)
Entrez IDSymbolCategoryInteraction TypesDrug Claim NameDrug NamePMIDs
9748SLKDRUGGABLE GENOME, ENZYME, SERINE THREONINE KINASE, KINASEALISERTIBALISERTIB
9748SLKDRUGGABLE GENOME, ENZYME, SERINE THREONINE KINASE, KINASECYC-116CYC-116
9748SLKDRUGGABLE GENOME, ENZYME, SERINE THREONINE KINASE, KINASEinhibitor249565620DANUSERTIB
9748SLKDRUGGABLE GENOME, ENZYME, SERINE THREONINE KINASE, KINASESNS-314SNS-314
9748SLKDRUGGABLE GENOME, ENZYME, SERINE THREONINE KINASE, KINASEOSI-632OSI-632
9748SLKDRUGGABLE GENOME, ENZYME, SERINE THREONINE KINASE, KINASEENTRECTINIBENTRECTINIB
9748SLKDRUGGABLE GENOME, ENZYME, SERINE THREONINE KINASE, KINASEBAY-613606CHEMBL541400
9748SLKDRUGGABLE GENOME, ENZYME, SERINE THREONINE KINASE, KINASERG-1530RG-1530
9748SLKDRUGGABLE GENOME, ENZYME, SERINE THREONINE KINASE, KINASEGEFITINIBGEFITINIB
9748SLKDRUGGABLE GENOME, ENZYME, SERINE THREONINE KINASE, KINASEGW441756XGW441756X
Page: 1 2 3 4