
|
|||||
|
 | |
| |
| |
| |
| |
| |
|
Gene: SLITRK6 |
Gene summary for SLITRK6 |
| Gene information | Species | Human | Gene symbol | SLITRK6 | Gene ID | 84189 |
| Gene name | SLIT and NTRK like family member 6 | |
| Gene Alias | DFNMYP | |
| Cytomap | 13q31.1 | |
| Gene Type | protein-coding | GO ID | GO:0000902 | UniProtAcc | Q9H5Y7 |
Top |
Malignant transformation analysis |
| Identification of the aberrant gene expression in precancerous and cancerous lesions by comparing the gene expression of stem-like cells in diseased tissues with normal stem cells |
| Entrez ID | Symbol | Replicates | Species | Organ | Tissue | Adj P-value | Log2FC | Malignancy |
| 84189 | SLITRK6 | GSM4909307 | Human | Breast | IDC | 5.00e-57 | 8.97e-01 | 0.1569 |
| 84189 | SLITRK6 | GSM4909308 | Human | Breast | IDC | 1.12e-92 | 1.19e+00 | 0.158 |
| 84189 | SLITRK6 | M5 | Human | Breast | IDC | 8.87e-13 | 7.97e-01 | 0.1598 |
| 84189 | SLITRK6 | DCIS2 | Human | Breast | DCIS | 1.99e-10 | 9.99e-02 | 0.0085 |
| 84189 | SLITRK6 | LZE7T | Human | Esophagus | ESCC | 4.77e-04 | 6.25e-01 | 0.0667 |
| 84189 | SLITRK6 | P8T-E | Human | Esophagus | ESCC | 2.19e-22 | 5.95e-01 | 0.0889 |
| 84189 | SLITRK6 | P10T-E | Human | Esophagus | ESCC | 8.24e-45 | 1.06e+00 | 0.116 |
| 84189 | SLITRK6 | P11T-E | Human | Esophagus | ESCC | 1.56e-11 | 6.61e-01 | 0.1426 |
| 84189 | SLITRK6 | P12T-E | Human | Esophagus | ESCC | 1.31e-06 | 2.92e-01 | 0.1122 |
| 84189 | SLITRK6 | P21T-E | Human | Esophagus | ESCC | 7.64e-13 | 4.38e-01 | 0.1617 |
| 84189 | SLITRK6 | P23T-E | Human | Esophagus | ESCC | 1.73e-04 | -2.85e-03 | 0.108 |
| 84189 | SLITRK6 | P26T-E | Human | Esophagus | ESCC | 3.35e-05 | 2.70e-01 | 0.1276 |
| 84189 | SLITRK6 | P31T-E | Human | Esophagus | ESCC | 6.81e-03 | -6.98e-02 | 0.1251 |
| 84189 | SLITRK6 | P32T-E | Human | Esophagus | ESCC | 3.29e-06 | 1.78e-01 | 0.1666 |
| 84189 | SLITRK6 | P37T-E | Human | Esophagus | ESCC | 6.02e-27 | 8.15e-01 | 0.1371 |
| 84189 | SLITRK6 | P47T-E | Human | Esophagus | ESCC | 2.70e-06 | 3.73e-02 | 0.1067 |
| 84189 | SLITRK6 | P49T-E | Human | Esophagus | ESCC | 1.78e-02 | 6.54e-01 | 0.1768 |
| 84189 | SLITRK6 | P54T-E | Human | Esophagus | ESCC | 5.06e-03 | 1.75e-01 | 0.0975 |
| 84189 | SLITRK6 | P57T-E | Human | Esophagus | ESCC | 2.23e-15 | 5.86e-01 | 0.0926 |
| 84189 | SLITRK6 | P61T-E | Human | Esophagus | ESCC | 3.81e-12 | 7.17e-01 | 0.099 |
| Page: 1 2 |
| Tissue | Expression Dynamics | Abbreviation |
| Breast | 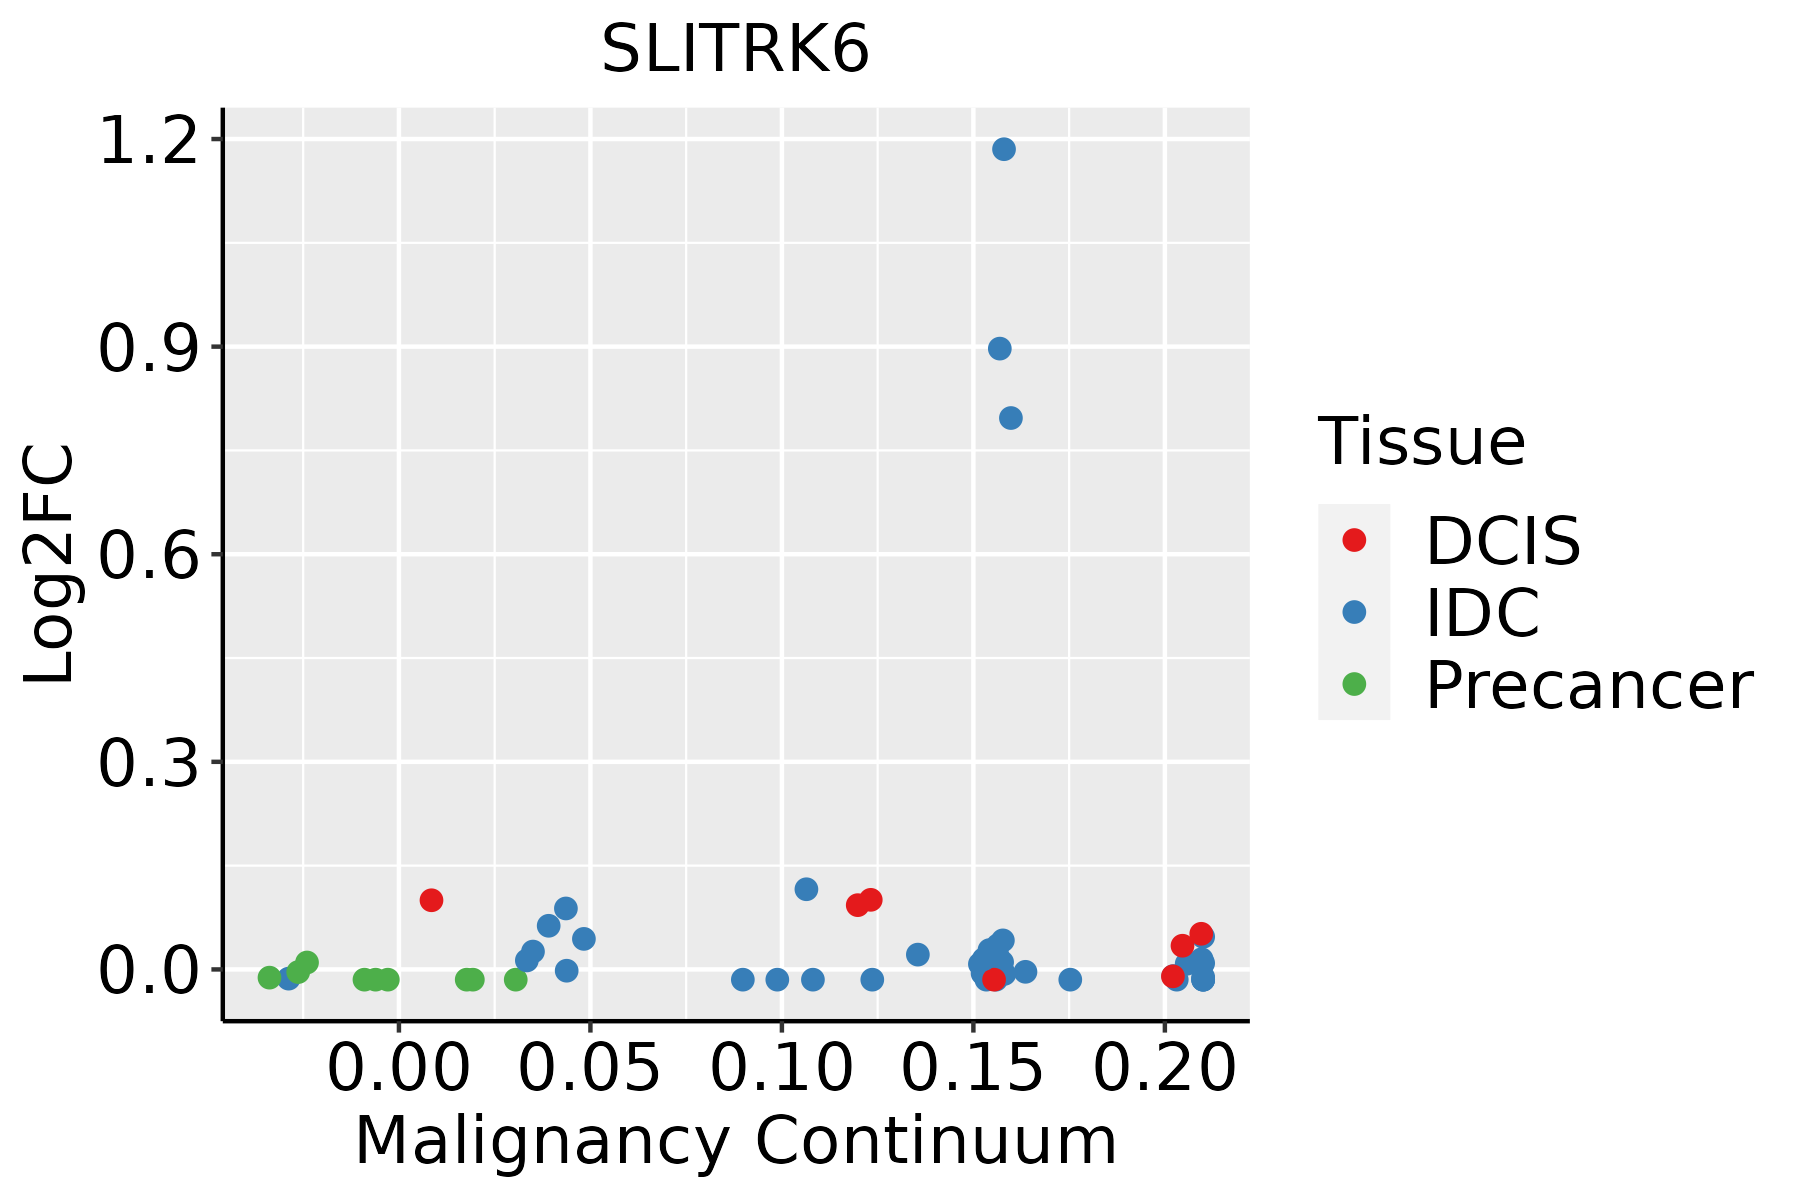 | IDC: Invasive ductal carcinoma |
| DCIS: Ductal carcinoma in situ | ||
| Precancer(BRCA1-mut): Precancerous lesion from BRCA1 mutation carriers | ||
| Esophagus | 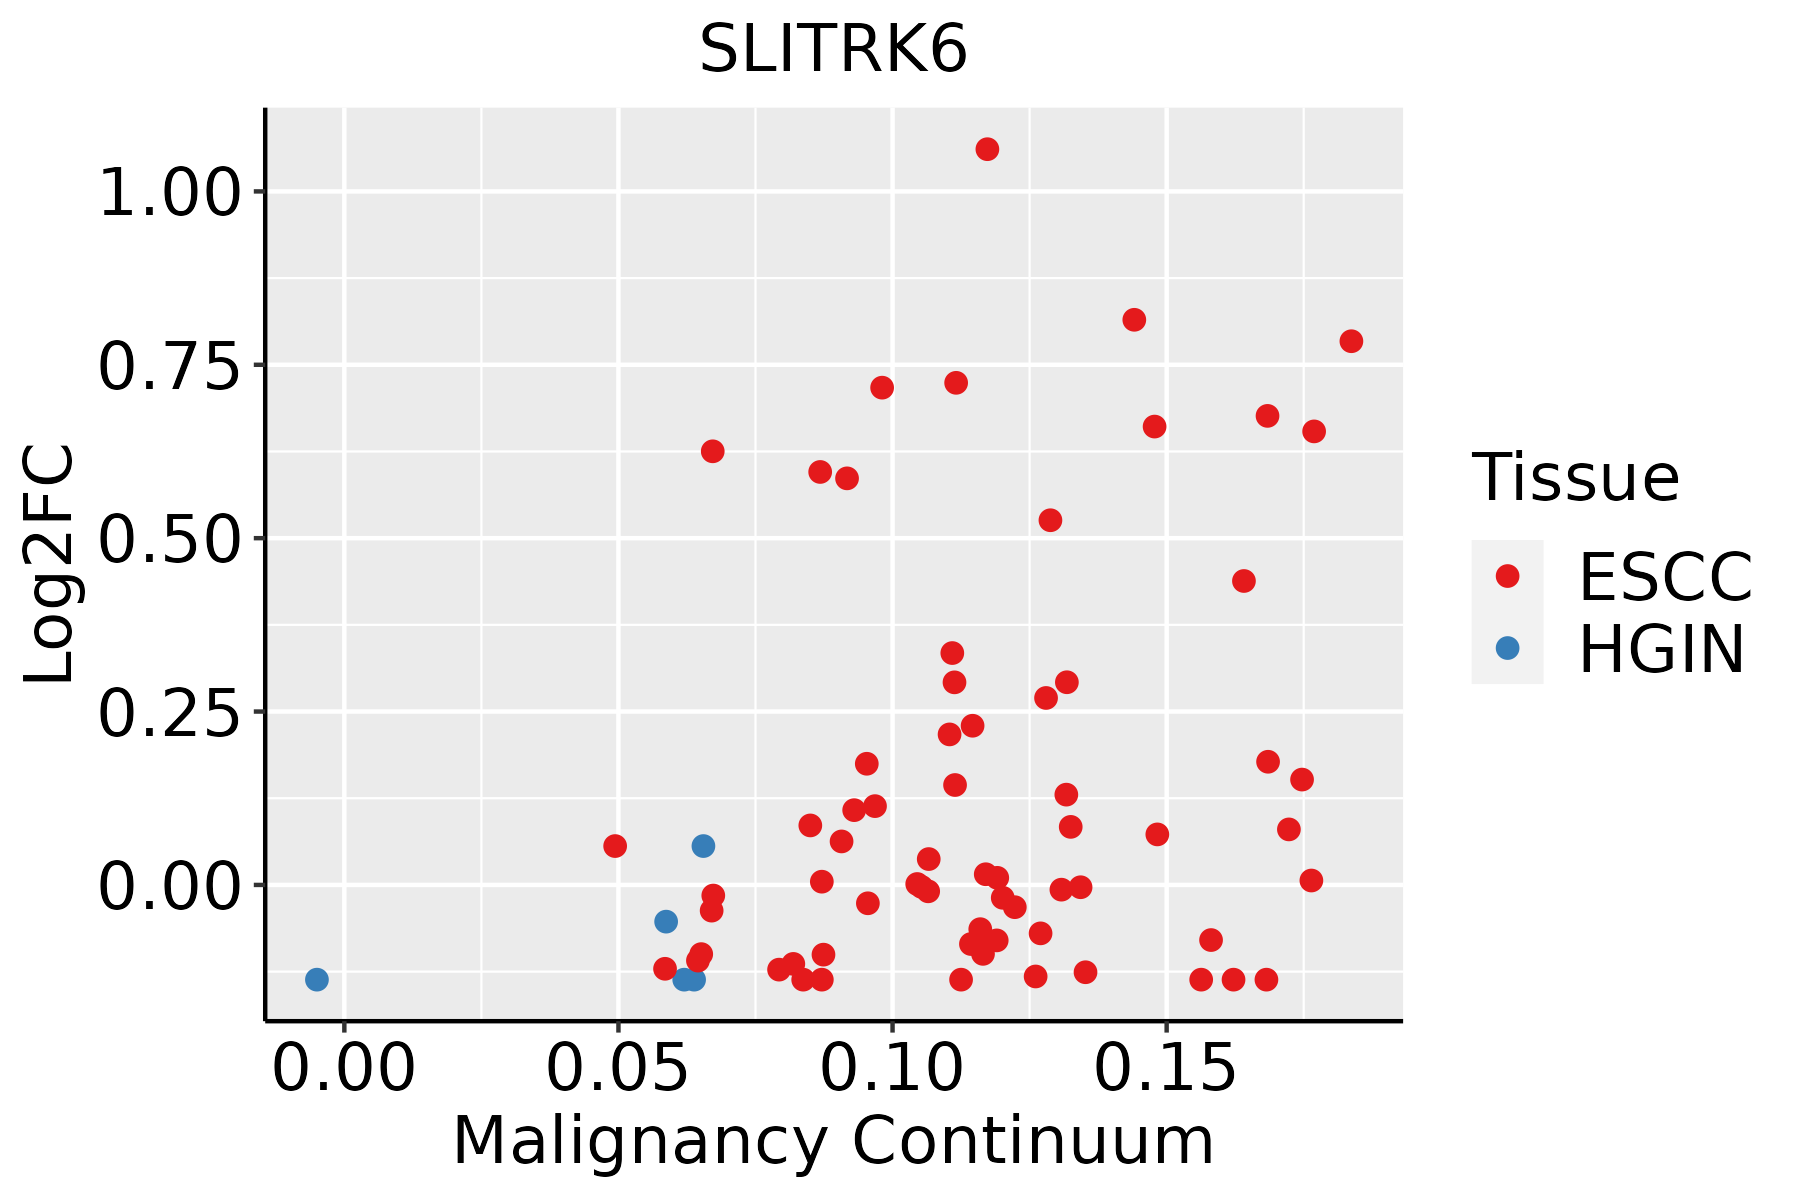 | ESCC: Esophageal squamous cell carcinoma |
| HGIN: High-grade intraepithelial neoplasias | ||
| LGIN: Low-grade intraepithelial neoplasias | ||
| Oral Cavity |  | EOLP: Erosive Oral lichen planus |
| LP: leukoplakia | ||
| NEOLP: Non-erosive oral lichen planus | ||
| OSCC: Oral squamous cell carcinoma | ||
| Prostate |  | BPH: Benign Prostatic Hyperplasia |
| Skin |  | AK: Actinic keratosis |
| cSCC: Cutaneous squamous cell carcinoma | ||
| SCCIS:squamous cell carcinoma in situ |
| ∗log2FC in expression of this searched gene in stem-like cells from each diseased tissue sample relative to stem-like cells in normal samples in each tissue plotted against the malignancy continuum. Samples are colored based on if they are from different disease stage. |
Top |
Malignant transformation related pathway analysis |
| Find out the enriched GO biological processes and KEGG pathways involved in transition from healthy to precancer to cancer |
| Tissue | Disease Stage | Enriched GO biological Processes |
| Colorectum | AD |  |
| Colorectum | SER |  |
| Colorectum | MSS |  |
| Colorectum | MSI-H |  |
| Colorectum | FAP |  |
| ∗Top 15 enriched GO BP terms are showed in the bar plot of each disease state in each tissue. Each row represents a significant GO biological process which is colored according to the -log10(p.adjust). |
| Page: 1 2 3 4 5 6 7 8 9 |
| GO ID | Tissue | Disease Stage | Description | Gene Ratio | Bg Ratio | pvalue | p.adjust | Count |
| GO:000961211 | Breast | IDC | response to mechanical stimulus | 34/1434 | 216/18723 | 4.59e-05 | 1.03e-03 | 34 |
| GO:000854412 | Breast | IDC | epidermis development | 41/1434 | 324/18723 | 1.03e-03 | 1.14e-02 | 41 |
| GO:000991312 | Breast | IDC | epidermal cell differentiation | 28/1434 | 202/18723 | 1.62e-03 | 1.60e-02 | 28 |
| GO:000206414 | Breast | IDC | epithelial cell development | 28/1434 | 220/18723 | 5.53e-03 | 4.05e-02 | 28 |
| GO:000961221 | Breast | DCIS | response to mechanical stimulus | 32/1390 | 216/18723 | 1.36e-04 | 2.33e-03 | 32 |
| GO:000854422 | Breast | DCIS | epidermis development | 40/1390 | 324/18723 | 1.05e-03 | 1.16e-02 | 40 |
| GO:000991322 | Breast | DCIS | epidermal cell differentiation | 27/1390 | 202/18723 | 2.11e-03 | 1.97e-02 | 27 |
| GO:000854410 | Esophagus | ESCC | epidermis development | 193/8552 | 324/18723 | 2.87e-07 | 4.19e-06 | 193 |
| GO:000206420 | Esophagus | ESCC | epithelial cell development | 136/8552 | 220/18723 | 9.50e-07 | 1.21e-05 | 136 |
| GO:000991310 | Esophagus | ESCC | epidermal cell differentiation | 122/8552 | 202/18723 | 1.69e-05 | 1.51e-04 | 122 |
| GO:006156415 | Esophagus | ESCC | axon development | 251/8552 | 467/18723 | 2.41e-04 | 1.49e-03 | 251 |
| GO:003432918 | Esophagus | ESCC | cell junction assembly | 227/8552 | 420/18723 | 3.06e-04 | 1.83e-03 | 227 |
| GO:000961216 | Esophagus | ESCC | response to mechanical stimulus | 124/8552 | 216/18723 | 3.30e-04 | 1.94e-03 | 124 |
| GO:00352647 | Esophagus | ESCC | multicellular organism growth | 80/8552 | 132/18723 | 3.84e-04 | 2.22e-03 | 80 |
| GO:00519606 | Esophagus | ESCC | regulation of nervous system development | 237/8552 | 443/18723 | 5.02e-04 | 2.78e-03 | 237 |
| GO:00485687 | Esophagus | ESCC | embryonic organ development | 228/8552 | 427/18723 | 7.28e-04 | 3.79e-03 | 228 |
| GO:00519625 | Esophagus | ESCC | positive regulation of nervous system development | 149/8552 | 272/18723 | 1.50e-03 | 7.06e-03 | 149 |
| GO:000740915 | Esophagus | ESCC | axonogenesis | 219/8552 | 418/18723 | 3.14e-03 | 1.31e-02 | 219 |
| GO:190188810 | Esophagus | ESCC | regulation of cell junction assembly | 109/8552 | 204/18723 | 1.53e-02 | 4.96e-02 | 109 |
| GO:00085449 | Oral cavity | OSCC | epidermis development | 171/7305 | 324/18723 | 2.89e-07 | 4.43e-06 | 171 |
| Page: 1 2 3 |
| Pathway ID | Tissue | Disease Stage | Description | Gene Ratio | Bg Ratio | pvalue | p.adjust | qvalue | Count |
| Page: 1 |
Top |
Cell-cell communication analysis |
| Identification of potential cell-cell interactions between two cell types and their ligand-receptor pairs for different disease states |
| Ligand | Receptor | LRpair | Pathway | Tissue | Disease Stage |
| Page: 1 |
Top |
Single-cell gene regulatory network inference analysis |
| Find out the significant the regulons (TFs) and the target genes of each regulon across cell types for different disease states |
| TF | Cell Type | Tissue | Disease Stage | Target Gene | RSS | Regulon Activity |
| ∗The dot plots of a searched regulon are shown for all cell subpopulations in each disease state of each tissue based on the regulon specific score inferred using pySCENIC and by calculating the average expression. |
| Page: 1 |
Top |
Somatic mutation of malignant transformation related genes |
| Annotation of somatic variants for genes involved in malignant transformation |
| Hugo Symbol | Variant Class | Variant Classification | dbSNP RS | HGVSc | HGVSp | HGVSp Short | SWISSPROT | BIOTYPE | SIFT | PolyPhen | Tumor Sample Barcode | Tissue | Histology | Sex | Age | Stage | Therapy Types | Drugs | Outcome |
| SLITRK6 | SNV | Missense_Mutation | novel | c.1348N>T | p.Ile450Leu | p.I450L | Q9H5Y7 | protein_coding | deleterious(0.02) | benign(0.009) | TCGA-A7-A5ZX-01 | Breast | breast invasive carcinoma | Female | <65 | III/IV | Chemotherapy | doxorubicin | CR |
| SLITRK6 | SNV | Missense_Mutation | rs375862571 | c.1025N>A | p.Gly342Glu | p.G342E | Q9H5Y7 | protein_coding | deleterious(0) | probably_damaging(0.968) | TCGA-A8-A081-01 | Breast | breast invasive carcinoma | Female | >=65 | I/II | Unknown | Unknown | SD |
| SLITRK6 | SNV | Missense_Mutation | c.1324N>G | p.Leu442Val | p.L442V | Q9H5Y7 | protein_coding | deleterious(0) | benign(0.037) | TCGA-AC-A23H-01 | Breast | breast invasive carcinoma | Female | >=65 | I/II | Unknown | Unknown | PD | |
| SLITRK6 | SNV | Missense_Mutation | novel | c.2095N>A | p.His699Asn | p.H699N | Q9H5Y7 | protein_coding | tolerated(0.37) | probably_damaging(0.98) | TCGA-AC-A2QH-01 | Breast | breast invasive carcinoma | Female | <65 | I/II | Chemotherapy | cytoxan | CR |
| SLITRK6 | SNV | Missense_Mutation | novel | c.969N>C | p.Gln323His | p.Q323H | Q9H5Y7 | protein_coding | tolerated(0.21) | benign(0) | TCGA-AC-A3W5-01 | Breast | breast invasive carcinoma | Female | >=65 | I/II | Chemotherapy | docetaxel | CR |
| SLITRK6 | SNV | Missense_Mutation | rs537634510 | c.613N>A | p.Glu205Lys | p.E205K | Q9H5Y7 | protein_coding | deleterious(0) | probably_damaging(0.996) | TCGA-AN-A046-01 | Breast | breast invasive carcinoma | Female | >=65 | I/II | Unknown | Unknown | SD |
| SLITRK6 | SNV | Missense_Mutation | c.98N>T | p.Ser33Phe | p.S33F | Q9H5Y7 | protein_coding | deleterious(0.01) | benign(0.144) | TCGA-BH-A0B4-01 | Breast | breast invasive carcinoma | Male | >=65 | III/IV | Hormone Therapy | tamoxiphen | SD | |
| SLITRK6 | SNV | Missense_Mutation | c.97N>C | p.Ser33Pro | p.S33P | Q9H5Y7 | protein_coding | tolerated(0.06) | benign(0.132) | TCGA-BH-A0B4-01 | Breast | breast invasive carcinoma | Male | >=65 | III/IV | Hormone Therapy | tamoxiphen | SD | |
| SLITRK6 | SNV | Missense_Mutation | c.736G>T | p.Val246Phe | p.V246F | Q9H5Y7 | protein_coding | deleterious(0) | possibly_damaging(0.454) | TCGA-BH-A0DL-01 | Breast | breast invasive carcinoma | Female | <65 | I/II | Chemotherapy | cytoxan | CR | |
| SLITRK6 | SNV | Missense_Mutation | c.652A>T | p.Asn218Tyr | p.N218Y | Q9H5Y7 | protein_coding | deleterious(0) | probably_damaging(0.963) | TCGA-EW-A1PD-01 | Breast | breast invasive carcinoma | Male | <65 | I/II | Chemotherapy | docetaxel | SD |
| Page: 1 2 3 4 5 6 7 8 9 10 11 12 13 14 15 16 17 18 19 20 |
Top |
Related drugs of malignant transformation related genes |
| Identification of chemicals and drugs interact with genes involved in malignant transfromation |
| (DGIdb 4.0) |
| Entrez ID | Symbol | Category | Interaction Types | Drug Claim Name | Drug Name | PMIDs |
| 84189 | SLITRK6 | CELL SURFACE | ASG-15ME |
| Page: 1 |

Copyright 2023-Present -The University of Texas Health Science Center at Houston |