
|
|||||
|
 | |
| |
| |
| |
| |
| |
|
Gene: SLIRP |
Gene summary for SLIRP |
| Gene information | Species | Human | Gene symbol | SLIRP | Gene ID | 81892 |
| Gene name | SRA stem-loop interacting RNA binding protein | |
| Gene Alias | C14orf156 | |
| Cytomap | 14q24.3 | |
| Gene Type | protein-coding | GO ID | GO:0000003 | UniProtAcc | Q9GZT3 |
Top |
Malignant transformation analysis |
| Identification of the aberrant gene expression in precancerous and cancerous lesions by comparing the gene expression of stem-like cells in diseased tissues with normal stem cells |
| Entrez ID | Symbol | Replicates | Species | Organ | Tissue | Adj P-value | Log2FC | Malignancy |
| 81892 | SLIRP | GSM4909281 | Human | Breast | IDC | 8.33e-06 | 4.21e-01 | 0.21 |
| 81892 | SLIRP | GSM4909282 | Human | Breast | IDC | 1.34e-05 | 3.84e-01 | -0.0288 |
| 81892 | SLIRP | GSM4909285 | Human | Breast | IDC | 1.28e-05 | 3.51e-01 | 0.21 |
| 81892 | SLIRP | GSM4909286 | Human | Breast | IDC | 3.00e-03 | -1.64e-01 | 0.1081 |
| 81892 | SLIRP | GSM4909290 | Human | Breast | IDC | 5.84e-28 | 7.23e-01 | 0.2096 |
| 81892 | SLIRP | GSM4909293 | Human | Breast | IDC | 1.01e-06 | 3.36e-01 | 0.1581 |
| 81892 | SLIRP | GSM4909294 | Human | Breast | IDC | 2.37e-10 | 2.75e-01 | 0.2022 |
| 81892 | SLIRP | GSM4909296 | Human | Breast | IDC | 2.08e-27 | 5.35e-01 | 0.1524 |
| 81892 | SLIRP | GSM4909297 | Human | Breast | IDC | 2.95e-19 | 1.85e-01 | 0.1517 |
| 81892 | SLIRP | GSM4909298 | Human | Breast | IDC | 6.78e-06 | 3.79e-01 | 0.1551 |
| 81892 | SLIRP | GSM4909301 | Human | Breast | IDC | 1.25e-06 | 3.19e-01 | 0.1577 |
| 81892 | SLIRP | GSM4909304 | Human | Breast | IDC | 2.27e-12 | 5.02e-01 | 0.1636 |
| 81892 | SLIRP | GSM4909305 | Human | Breast | IDC | 2.34e-03 | 2.78e-01 | 0.0436 |
| 81892 | SLIRP | GSM4909307 | Human | Breast | IDC | 3.26e-03 | 3.11e-01 | 0.1569 |
| 81892 | SLIRP | GSM4909308 | Human | Breast | IDC | 1.72e-05 | 2.39e-01 | 0.158 |
| 81892 | SLIRP | GSM4909311 | Human | Breast | IDC | 7.53e-51 | 2.20e-01 | 0.1534 |
| 81892 | SLIRP | GSM4909312 | Human | Breast | IDC | 4.73e-19 | 3.42e-01 | 0.1552 |
| 81892 | SLIRP | GSM4909316 | Human | Breast | IDC | 3.54e-08 | 4.42e-01 | 0.21 |
| 81892 | SLIRP | GSM4909317 | Human | Breast | IDC | 3.17e-02 | 2.11e-01 | 0.1355 |
| 81892 | SLIRP | GSM4909319 | Human | Breast | IDC | 6.62e-49 | -1.01e-01 | 0.1563 |
| Page: 1 2 3 4 5 6 7 8 9 10 11 12 13 |
| Tissue | Expression Dynamics | Abbreviation |
| Breast |  | IDC: Invasive ductal carcinoma |
| DCIS: Ductal carcinoma in situ | ||
| Precancer(BRCA1-mut): Precancerous lesion from BRCA1 mutation carriers | ||
| Colorectum (GSE201348) |  | FAP: Familial adenomatous polyposis |
| CRC: Colorectal cancer | ||
| Colorectum (HTA11) |  | AD: Adenomas |
| SER: Sessile serrated lesions | ||
| MSI-H: Microsatellite-high colorectal cancer | ||
| MSS: Microsatellite stable colorectal cancer | ||
| Endometrium |  | AEH: Atypical endometrial hyperplasia |
| EEC: Endometrioid Cancer | ||
| Esophagus | 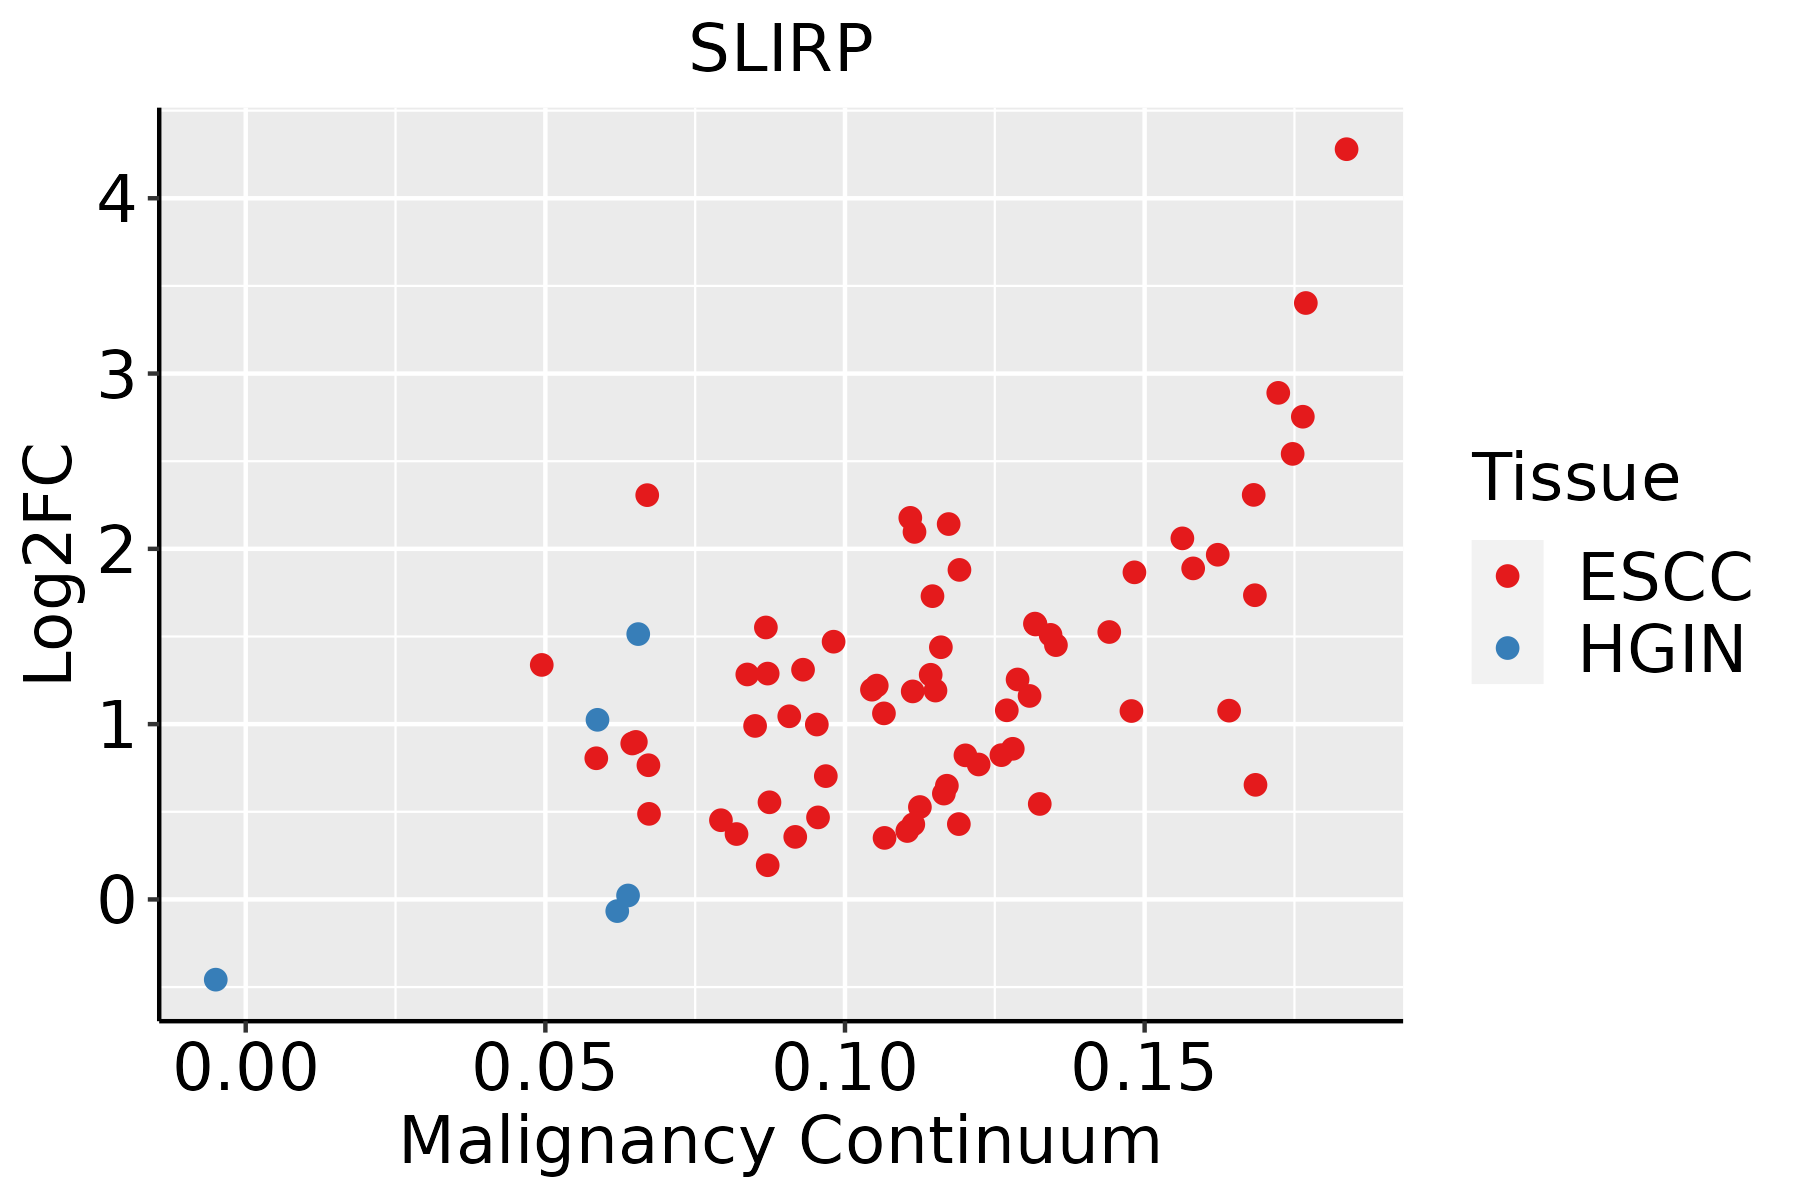 | ESCC: Esophageal squamous cell carcinoma |
| HGIN: High-grade intraepithelial neoplasias | ||
| LGIN: Low-grade intraepithelial neoplasias | ||
| GC | 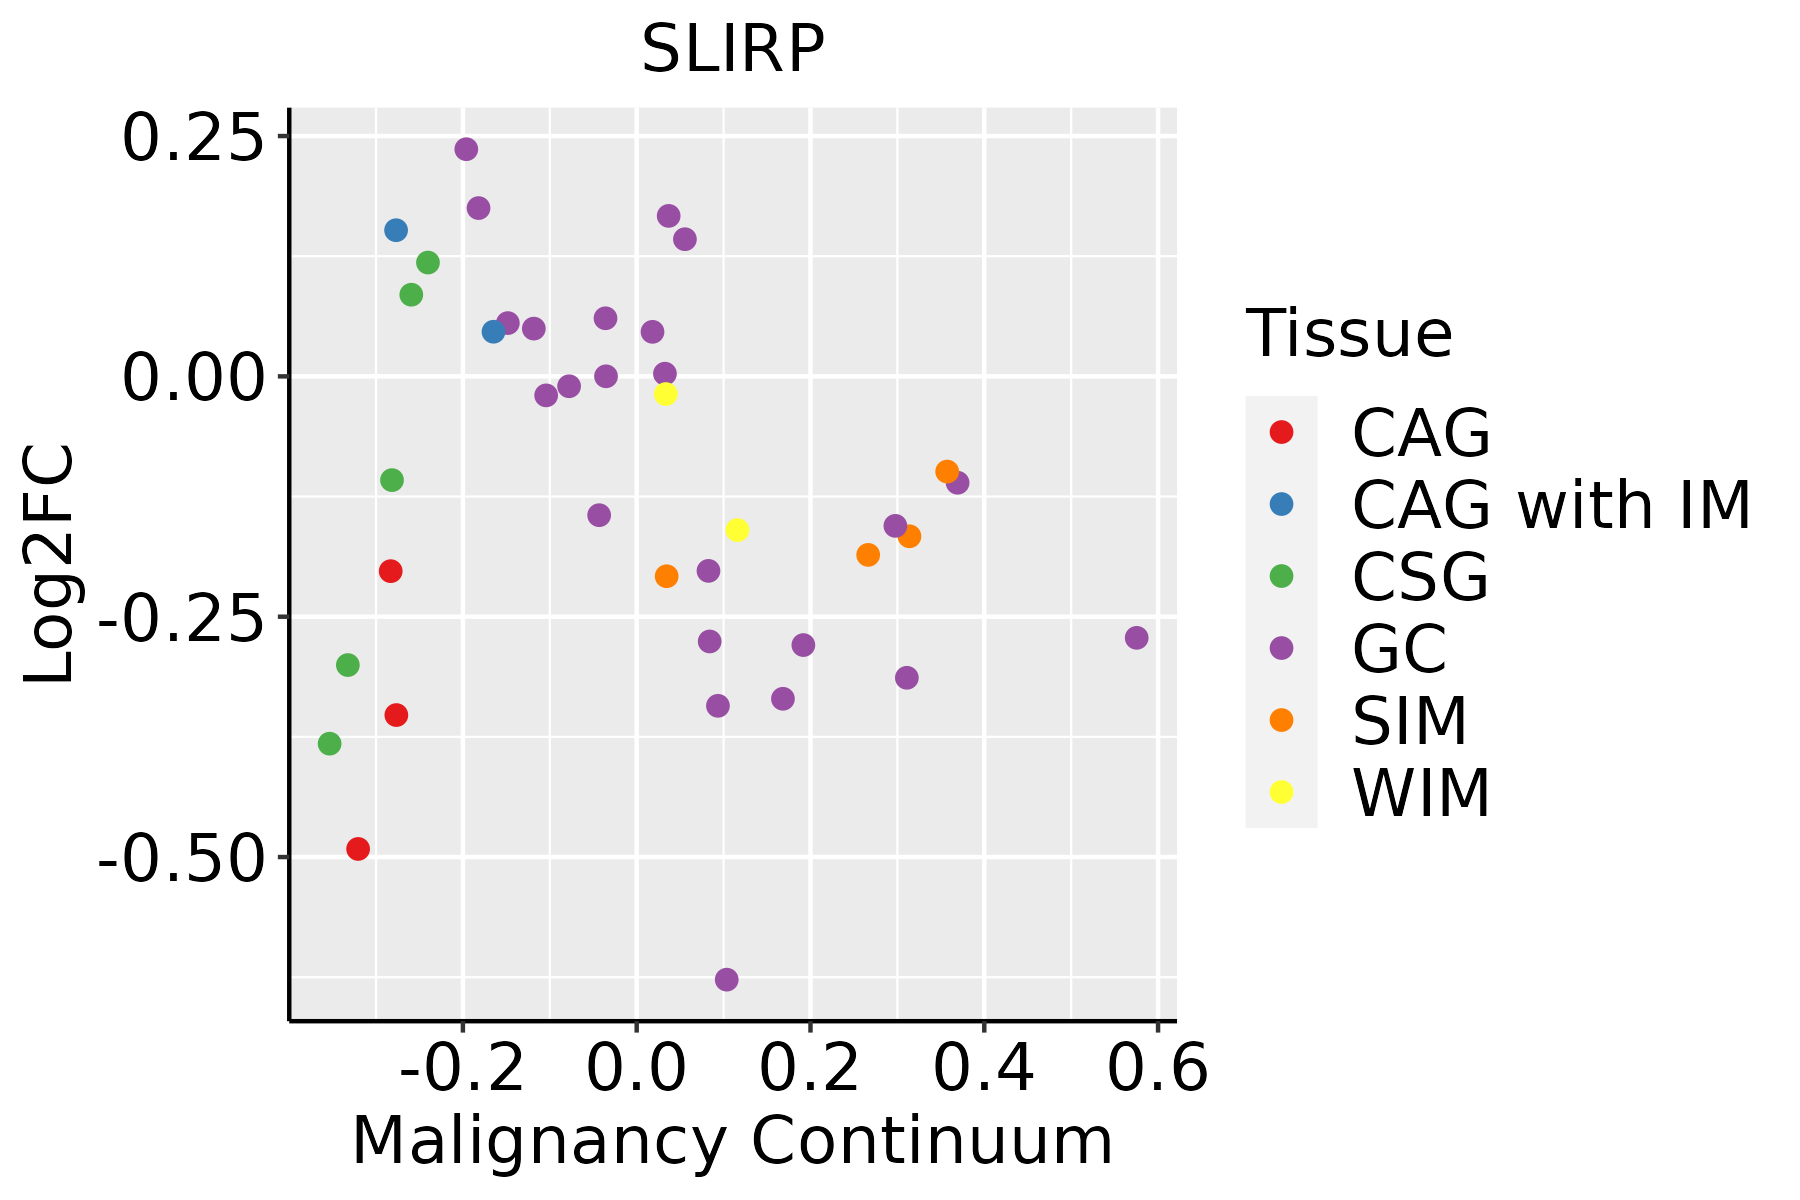 | CAG: Chronic atrophic gastritis |
| CAG with IM: Chronic atrophic gastritis with intestinal metaplasia | ||
| CSG: Chronic superficial gastritis | ||
| GC: Gastric cancer | ||
| SIM: Severe intestinal metaplasia | ||
| WIM: Wild intestinal metaplasia | ||
| Liver |  | HCC: Hepatocellular carcinoma |
| NAFLD: Non-alcoholic fatty liver disease | ||
| Oral Cavity | 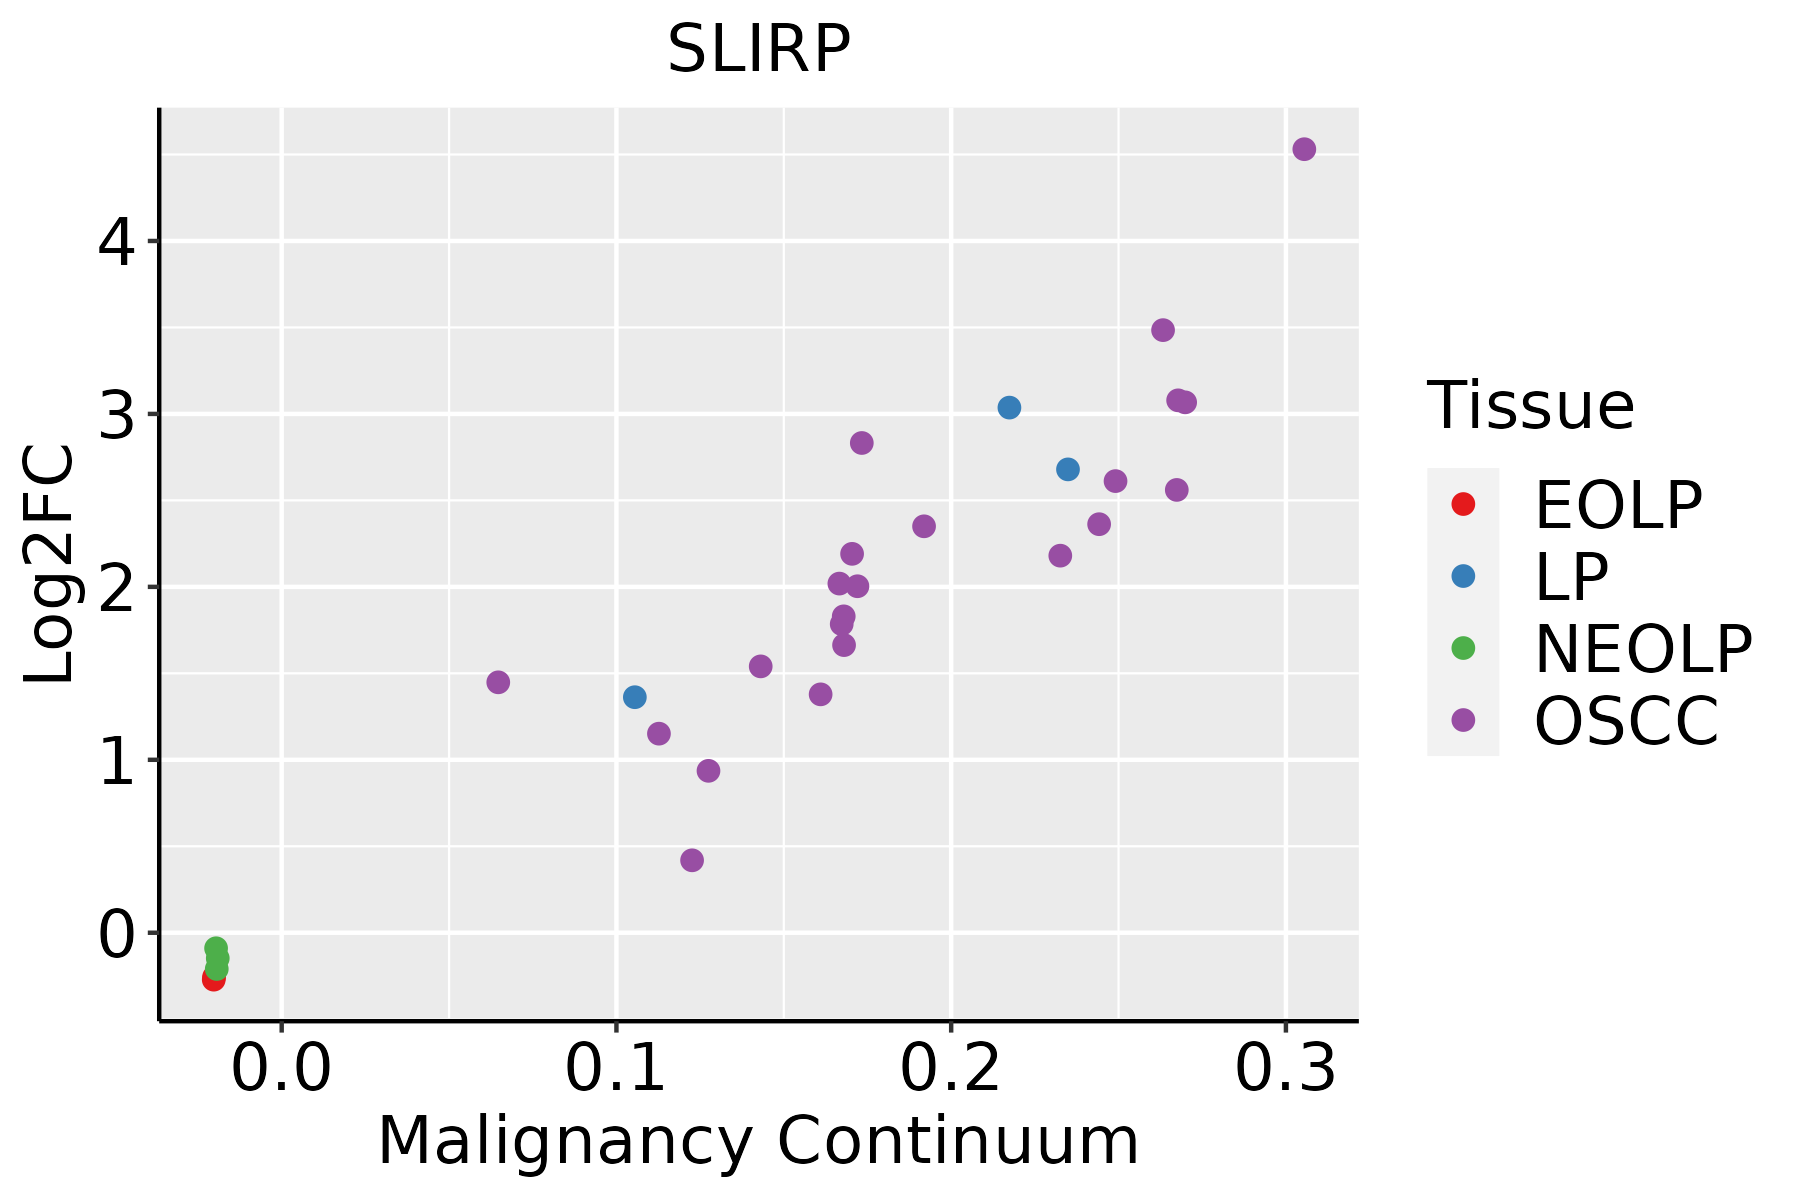 | EOLP: Erosive Oral lichen planus |
| LP: leukoplakia | ||
| NEOLP: Non-erosive oral lichen planus | ||
| OSCC: Oral squamous cell carcinoma | ||
| Prostate | 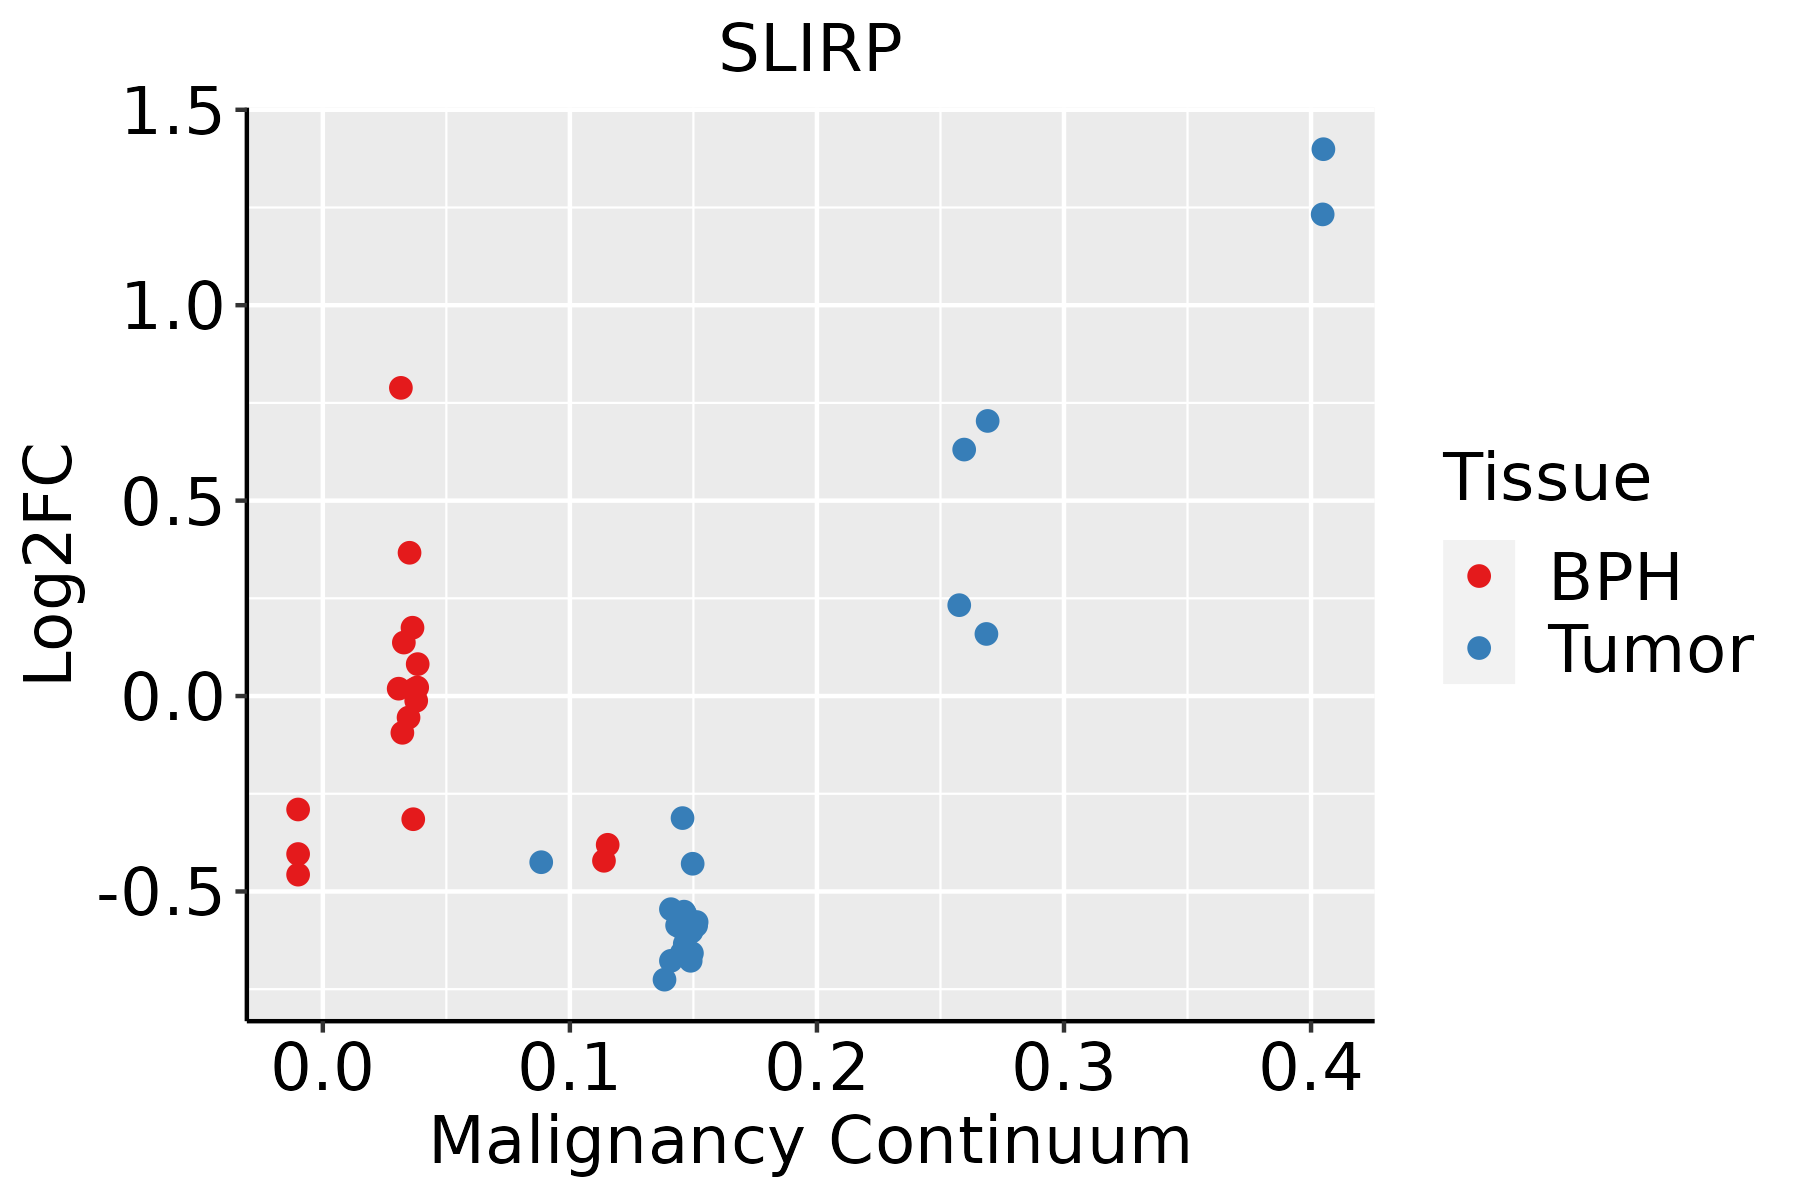 | BPH: Benign Prostatic Hyperplasia |
| Skin | 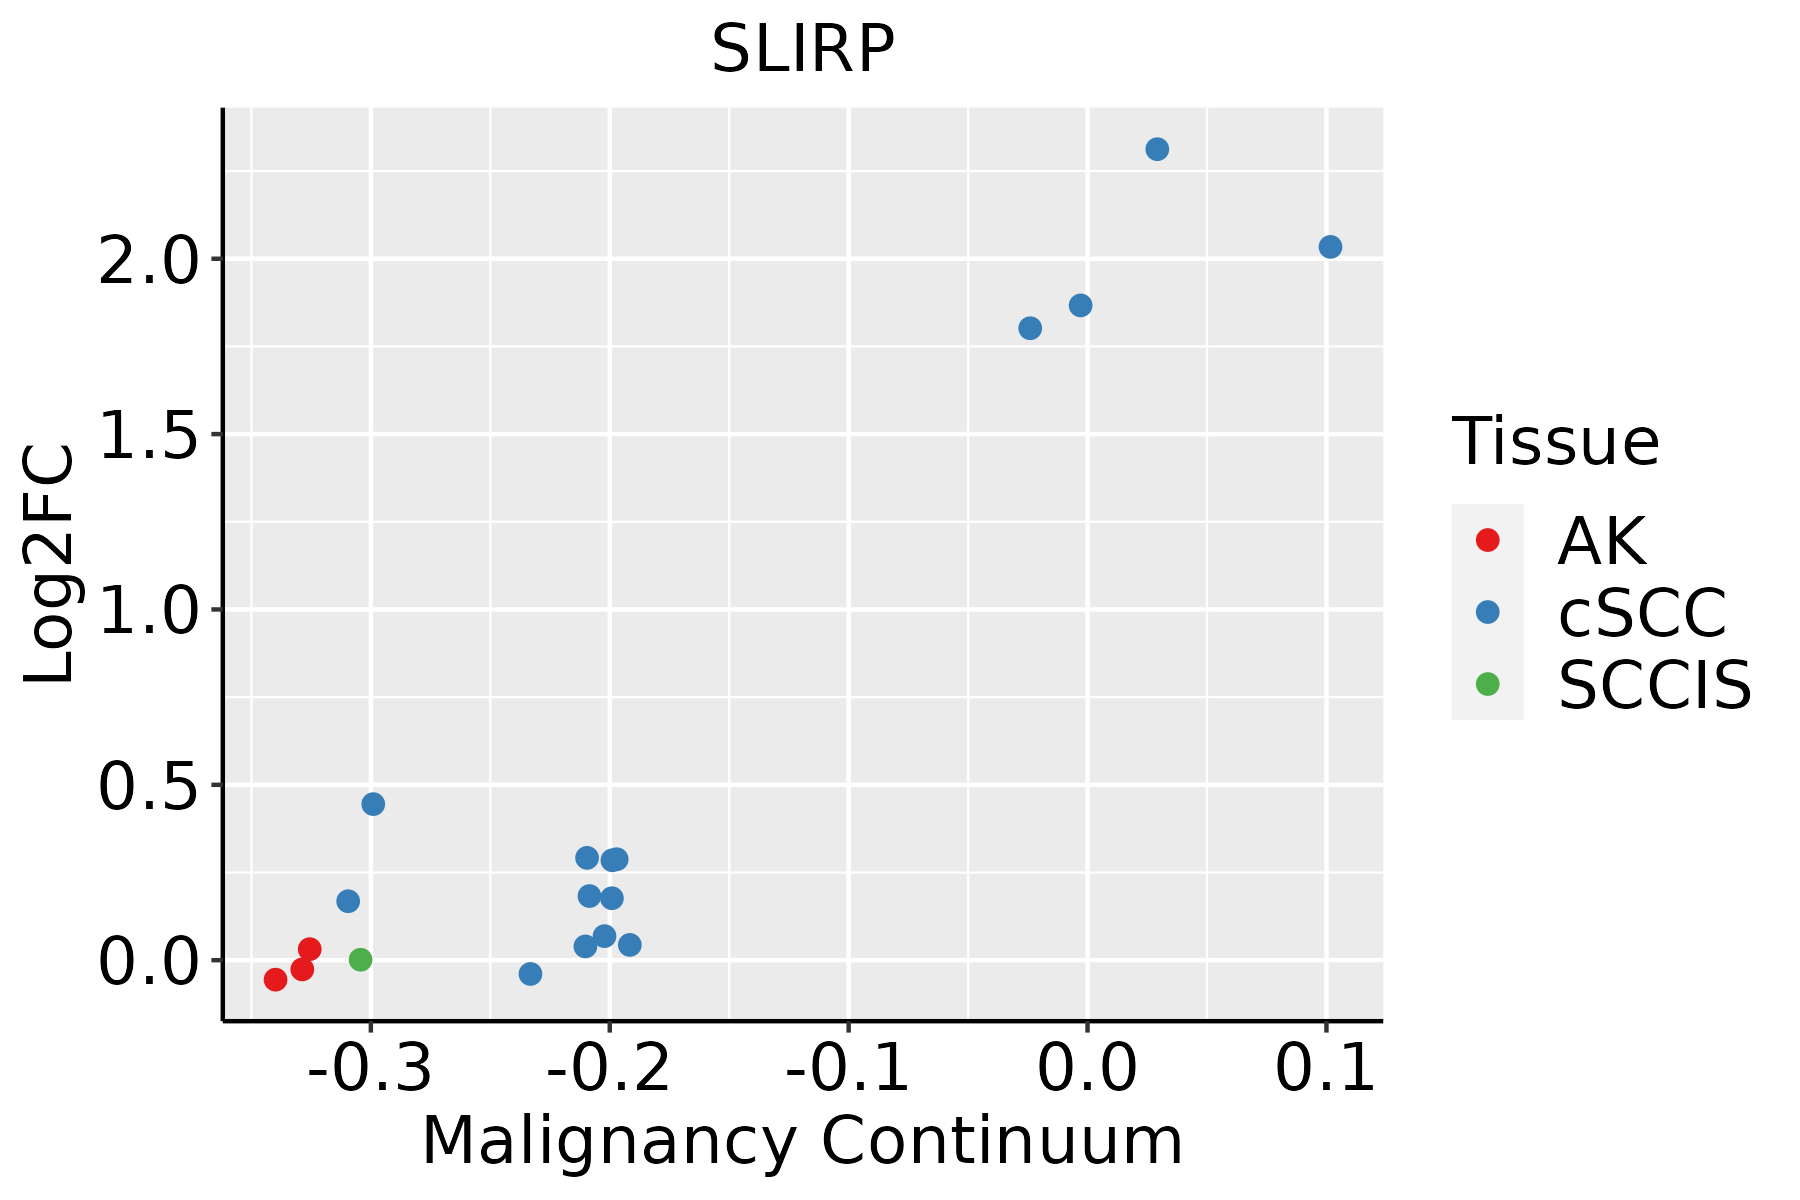 | AK: Actinic keratosis |
| cSCC: Cutaneous squamous cell carcinoma | ||
| SCCIS:squamous cell carcinoma in situ | ||
| Thyroid | 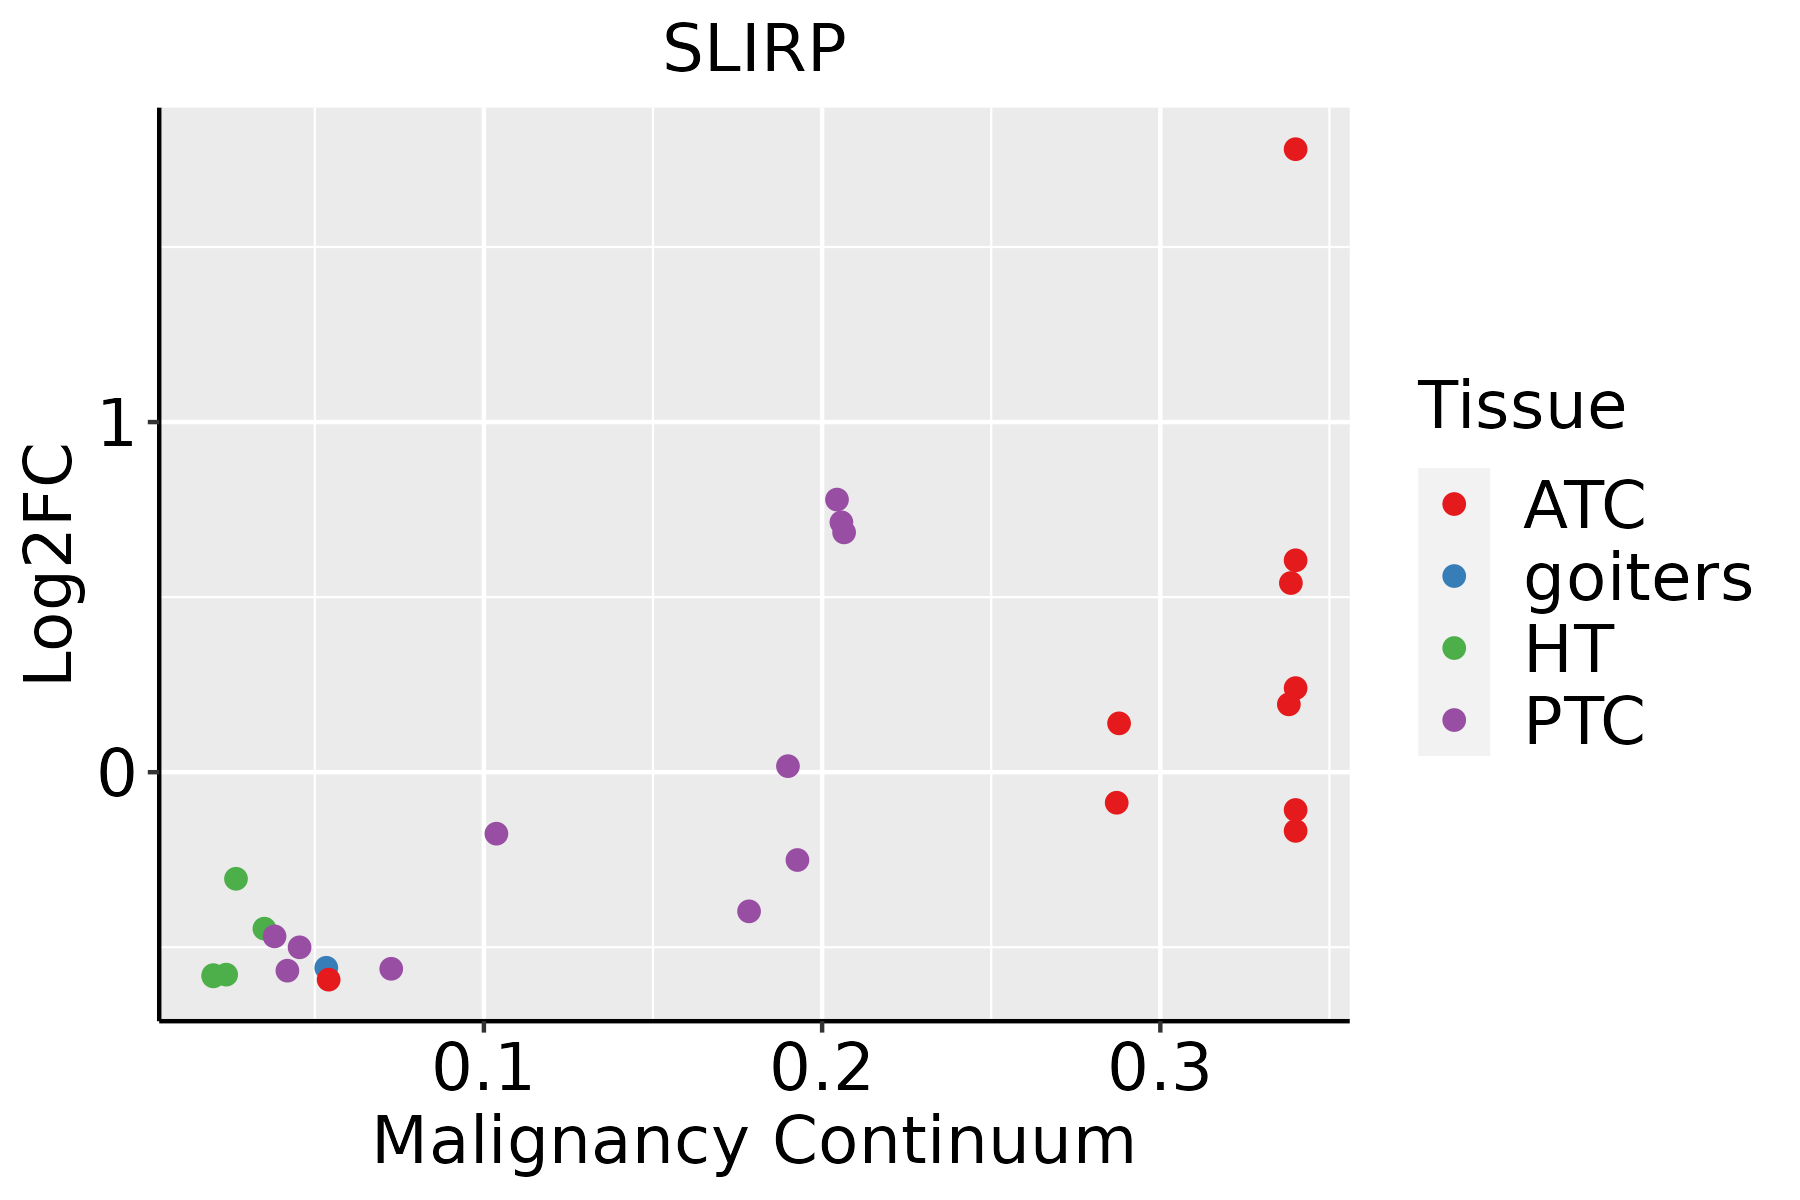 | ATC: Anaplastic thyroid cancer |
| HT: Hashimoto's thyroiditis | ||
| PTC: Papillary thyroid cancer |
| ∗log2FC in expression of this searched gene in stem-like cells from each diseased tissue sample relative to stem-like cells in normal samples in each tissue plotted against the malignancy continuum. Samples are colored based on if they are from different disease stage. |
Top |
Malignant transformation related pathway analysis |
| Find out the enriched GO biological processes and KEGG pathways involved in transition from healthy to precancer to cancer |
| Tissue | Disease Stage | Enriched GO biological Processes |
| Colorectum | AD |  |
| Colorectum | SER |  |
| Colorectum | MSS |  |
| Colorectum | MSI-H |  |
| Colorectum | FAP |  |
| ∗Top 15 enriched GO BP terms are showed in the bar plot of each disease state in each tissue. Each row represents a significant GO biological process which is colored according to the -log10(p.adjust). |
| Page: 1 2 3 4 5 6 7 8 9 |
| GO ID | Tissue | Disease Stage | Description | Gene Ratio | Bg Ratio | pvalue | p.adjust | Count |
| GO:00313309 | Breast | Precancer | negative regulation of cellular catabolic process | 34/1080 | 262/18723 | 8.16e-06 | 2.20e-04 | 34 |
| GO:00064018 | Breast | Precancer | RNA catabolic process | 34/1080 | 278/18723 | 2.88e-05 | 6.39e-04 | 34 |
| GO:00098959 | Breast | Precancer | negative regulation of catabolic process | 36/1080 | 320/18723 | 9.92e-05 | 1.83e-03 | 36 |
| GO:00346558 | Breast | Precancer | nucleobase-containing compound catabolic process | 42/1080 | 407/18723 | 1.91e-04 | 3.06e-03 | 42 |
| GO:00467007 | Breast | Precancer | heterocycle catabolic process | 44/1080 | 445/18723 | 3.49e-04 | 4.88e-03 | 44 |
| GO:00442708 | Breast | Precancer | cellular nitrogen compound catabolic process | 44/1080 | 451/18723 | 4.64e-04 | 6.12e-03 | 44 |
| GO:00194397 | Breast | Precancer | aromatic compound catabolic process | 44/1080 | 467/18723 | 9.55e-04 | 1.07e-02 | 44 |
| GO:19013617 | Breast | Precancer | organic cyclic compound catabolic process | 45/1080 | 495/18723 | 1.73e-03 | 1.74e-02 | 45 |
| GO:19023697 | Breast | Precancer | negative regulation of RNA catabolic process | 11/1080 | 75/18723 | 3.67e-03 | 3.02e-02 | 11 |
| GO:003133014 | Breast | IDC | negative regulation of cellular catabolic process | 37/1434 | 262/18723 | 2.20e-04 | 3.52e-03 | 37 |
| GO:000640113 | Breast | IDC | RNA catabolic process | 38/1434 | 278/18723 | 3.54e-04 | 5.16e-03 | 38 |
| GO:000989514 | Breast | IDC | negative regulation of catabolic process | 40/1434 | 320/18723 | 1.49e-03 | 1.50e-02 | 40 |
| GO:190136112 | Breast | IDC | organic cyclic compound catabolic process | 56/1434 | 495/18723 | 2.12e-03 | 1.99e-02 | 56 |
| GO:004670012 | Breast | IDC | heterocycle catabolic process | 51/1434 | 445/18723 | 2.51e-03 | 2.25e-02 | 51 |
| GO:003465513 | Breast | IDC | nucleobase-containing compound catabolic process | 47/1434 | 407/18723 | 3.12e-03 | 2.63e-02 | 47 |
| GO:004427012 | Breast | IDC | cellular nitrogen compound catabolic process | 50/1434 | 451/18723 | 5.29e-03 | 3.93e-02 | 50 |
| GO:001943912 | Breast | IDC | aromatic compound catabolic process | 51/1434 | 467/18723 | 6.54e-03 | 4.59e-02 | 51 |
| GO:003133024 | Breast | DCIS | negative regulation of cellular catabolic process | 37/1390 | 262/18723 | 1.18e-04 | 2.07e-03 | 37 |
| GO:000640123 | Breast | DCIS | RNA catabolic process | 38/1390 | 278/18723 | 1.91e-04 | 3.08e-03 | 38 |
| GO:000989524 | Breast | DCIS | negative regulation of catabolic process | 40/1390 | 320/18723 | 8.29e-04 | 9.46e-03 | 40 |
| Page: 1 2 3 4 5 6 7 8 9 10 11 |
| Pathway ID | Tissue | Disease Stage | Description | Gene Ratio | Bg Ratio | pvalue | p.adjust | qvalue | Count |
| Page: 1 |
Top |
Cell-cell communication analysis |
| Identification of potential cell-cell interactions between two cell types and their ligand-receptor pairs for different disease states |
| Ligand | Receptor | LRpair | Pathway | Tissue | Disease Stage |
| Page: 1 |
Top |
Single-cell gene regulatory network inference analysis |
| Find out the significant the regulons (TFs) and the target genes of each regulon across cell types for different disease states |
| TF | Cell Type | Tissue | Disease Stage | Target Gene | RSS | Regulon Activity |
| ∗The dot plots of a searched regulon are shown for all cell subpopulations in each disease state of each tissue based on the regulon specific score inferred using pySCENIC and by calculating the average expression. |
| Page: 1 |
Top |
Somatic mutation of malignant transformation related genes |
| Annotation of somatic variants for genes involved in malignant transformation |
| Hugo Symbol | Variant Class | Variant Classification | dbSNP RS | HGVSc | HGVSp | HGVSp Short | SWISSPROT | BIOTYPE | SIFT | PolyPhen | Tumor Sample Barcode | Tissue | Histology | Sex | Age | Stage | Therapy Types | Drugs | Outcome |
| SLIRP | SNV | Missense_Mutation | novel | c.8C>A | p.Ala3Asp | p.A3D | Q9GZT3 | protein_coding | deleterious(0) | probably_damaging(0.996) | TCGA-C8-A26X-01 | Breast | breast invasive carcinoma | Female | <65 | I/II | Chemotherapy | 5-fluorouracil | CR |
| SLIRP | SNV | Missense_Mutation | novel | c.179G>T | p.Arg60Ile | p.R60I | Q9GZT3 | protein_coding | deleterious(0) | probably_damaging(0.973) | TCGA-A5-A0G2-01 | Endometrium | uterine corpus endometrioid carcinoma | Female | <65 | III/IV | Unknown | Unknown | SD |
| SLIRP | SNV | Missense_Mutation | novel | c.248N>C | p.Ile83Thr | p.I83T | Q9GZT3 | protein_coding | tolerated(0.07) | benign(0.084) | TCGA-AJ-A3EK-01 | Endometrium | uterine corpus endometrioid carcinoma | Female | <65 | I/II | Chemotherapy | carboplatin | CR |
| SLIRP | SNV | Missense_Mutation | novel | c.221N>A | p.Arg74Gln | p.R74Q | Q9GZT3 | protein_coding | tolerated(1) | benign(0.001) | TCGA-AX-A1C9-01 | Endometrium | uterine corpus endometrioid carcinoma | Female | >=65 | I/II | Unknown | Unknown | SD |
| SLIRP | SNV | Missense_Mutation | c.20G>A | p.Arg7Lys | p.R7K | Q9GZT3 | protein_coding | tolerated(0.24) | benign(0.005) | TCGA-B5-A0JY-01 | Endometrium | uterine corpus endometrioid carcinoma | Female | <65 | III/IV | Chemotherapy | doxorubicin | SD | |
| SLIRP | SNV | Missense_Mutation | c.20N>A | p.Arg7Lys | p.R7K | Q9GZT3 | protein_coding | tolerated(0.24) | benign(0.005) | TCGA-DD-AADG-01 | Liver | liver hepatocellular carcinoma | Male | >=65 | III/IV | Unknown | Unknown | PD | |
| SLIRP | SNV | Missense_Mutation | c.80N>T | p.Pro27Leu | p.P27L | Q9GZT3 | protein_coding | deleterious(0) | probably_damaging(0.981) | TCGA-CG-5726-01 | Stomach | stomach adenocarcinoma | Male | >=65 | I/II | Unknown | Unknown | SD | |
| SLIRP | SNV | Missense_Mutation | novel | c.134N>C | p.Val45Ala | p.V45A | Q9GZT3 | protein_coding | deleterious(0) | possibly_damaging(0.903) | TCGA-VQ-A8P2-01 | Stomach | stomach adenocarcinoma | Male | >=65 | III/IV | Unspecific | Complete Response |
| Page: 1 |
Top |
Related drugs of malignant transformation related genes |
| Identification of chemicals and drugs interact with genes involved in malignant transfromation |
| (DGIdb 4.0) |
| Entrez ID | Symbol | Category | Interaction Types | Drug Claim Name | Drug Name | PMIDs |
| Page: 1 |

Copyright 2023-Present -The University of Texas Health Science Center at Houston |