Schematic overview of the cellular and molecular mechanisms involved in the cancer progression, including the proposed cellular and molecular mechanisms in cancer cells trajectory. AT1: alveolar type 1 cells; AT2: alveolar type 2 cells; AAH: atypical adenomatous hyperplasia; AIS: adenocarcinoma in situ; MIA: minimally invasive adenocarcinoma; IA: invasive adenocarcinoma; EMT: epithelial-mesenchymal transition

Home

Download

Statistics

Help

Contact

Center for Computational Systems Medicine
leaf

Gene summary

leaf

Malignant transformation analysis

leaf

Malignant transformation related pathway analysis

leaf

Cell-cell communication analysis

leaf

Single-cell gene regulatory network inference analysis

leaf

Somatic mutation of malignant transformation related genes

leaf

Related drugs of malignant transformation related genes

Gene: SLF2

Gene summary for SLF2

check button Gene summary.

Gene informationSpeciesHuman
Gene symbol

SLF2

Gene ID

55719

Gene nameSMC5-SMC6 complex localization factor 2
Gene AliasC10orf6
Cytomap10q24.31
Gene Typeprotein-coding
GO ID

GO:0000070

UniProtAcc

Q8IX21


Top

Malignant transformation analysis

check button Identification of the aberrant gene expression in precancerous and cancerous lesions by comparing the gene expression of stem-like cells in diseased tissues with normal stem cells
check button Malignant transformation involving gene list.
Entrez IDSymbolReplicatesSpeciesOrganTissueAdj P-valueLog2FCMalignancy
55719SLF2LZE24THumanEsophagusESCC6.67e-152.50e-010.0596
55719SLF2P2T-EHumanEsophagusESCC4.51e-081.90e-010.1177
55719SLF2P4T-EHumanEsophagusESCC9.22e-081.81e-010.1323
55719SLF2P5T-EHumanEsophagusESCC6.71e-112.30e-010.1327
55719SLF2P8T-EHumanEsophagusESCC4.72e-122.31e-010.0889
55719SLF2P9T-EHumanEsophagusESCC2.39e-031.27e-010.1131
55719SLF2P10T-EHumanEsophagusESCC2.45e-081.10e-010.116
55719SLF2P11T-EHumanEsophagusESCC1.49e-072.72e-010.1426
55719SLF2P12T-EHumanEsophagusESCC2.41e-142.59e-010.1122
55719SLF2P15T-EHumanEsophagusESCC9.78e-031.18e-010.1149
55719SLF2P16T-EHumanEsophagusESCC6.66e-101.80e-010.1153
55719SLF2P20T-EHumanEsophagusESCC3.11e-102.16e-010.1124
55719SLF2P21T-EHumanEsophagusESCC3.85e-029.16e-020.1617
55719SLF2P22T-EHumanEsophagusESCC1.23e-021.18e-010.1236
55719SLF2P23T-EHumanEsophagusESCC3.15e-143.28e-010.108
55719SLF2P24T-EHumanEsophagusESCC6.58e-041.04e-010.1287
55719SLF2P26T-EHumanEsophagusESCC3.84e-111.44e-010.1276
55719SLF2P27T-EHumanEsophagusESCC6.44e-102.38e-010.1055
55719SLF2P28T-EHumanEsophagusESCC5.69e-091.91e-010.1149
55719SLF2P30T-EHumanEsophagusESCC2.88e-062.07e-010.137
Page: 1 2 3 4 5 

check button Transcriptomic changes along malignancy continuum.
TissueExpression DynamicsAbbreviation
EsophagusThe image shows the transcriptomic changes along malignancy continuum.log2FC in expression of this searched gene in stem-like cells from each diseased tissue sample relative to stem-like cells in normal samples in each tissue plotted against the malignancy continuum. Samples are colored based on if they are from different disease stage.
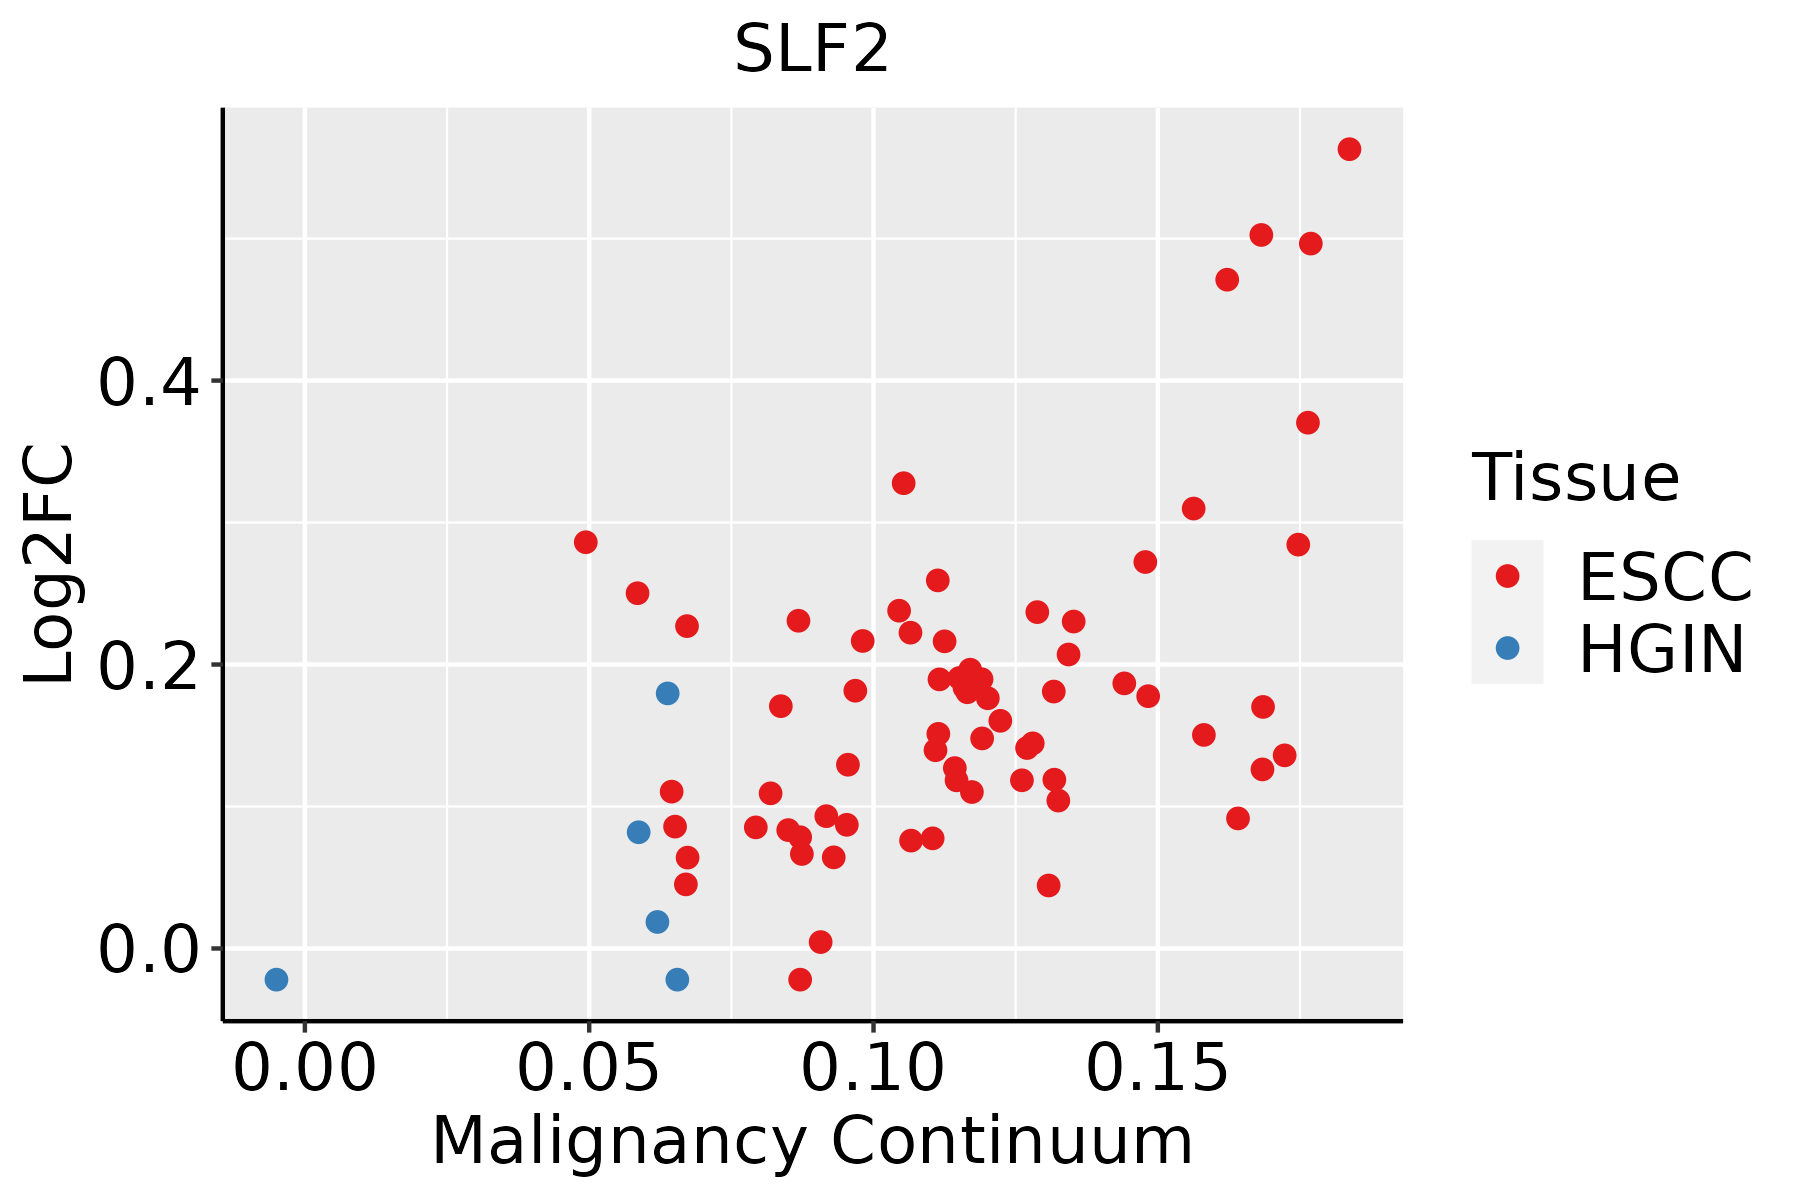
ESCC: Esophageal squamous cell carcinoma
HGIN: High-grade intraepithelial neoplasias
LGIN: Low-grade intraepithelial neoplasias
LiverThe image shows the transcriptomic changes along malignancy continuum.log2FC in expression of this searched gene in stem-like cells from each diseased tissue sample relative to stem-like cells in normal samples in each tissue plotted against the malignancy continuum. Samples are colored based on if they are from different disease stage.
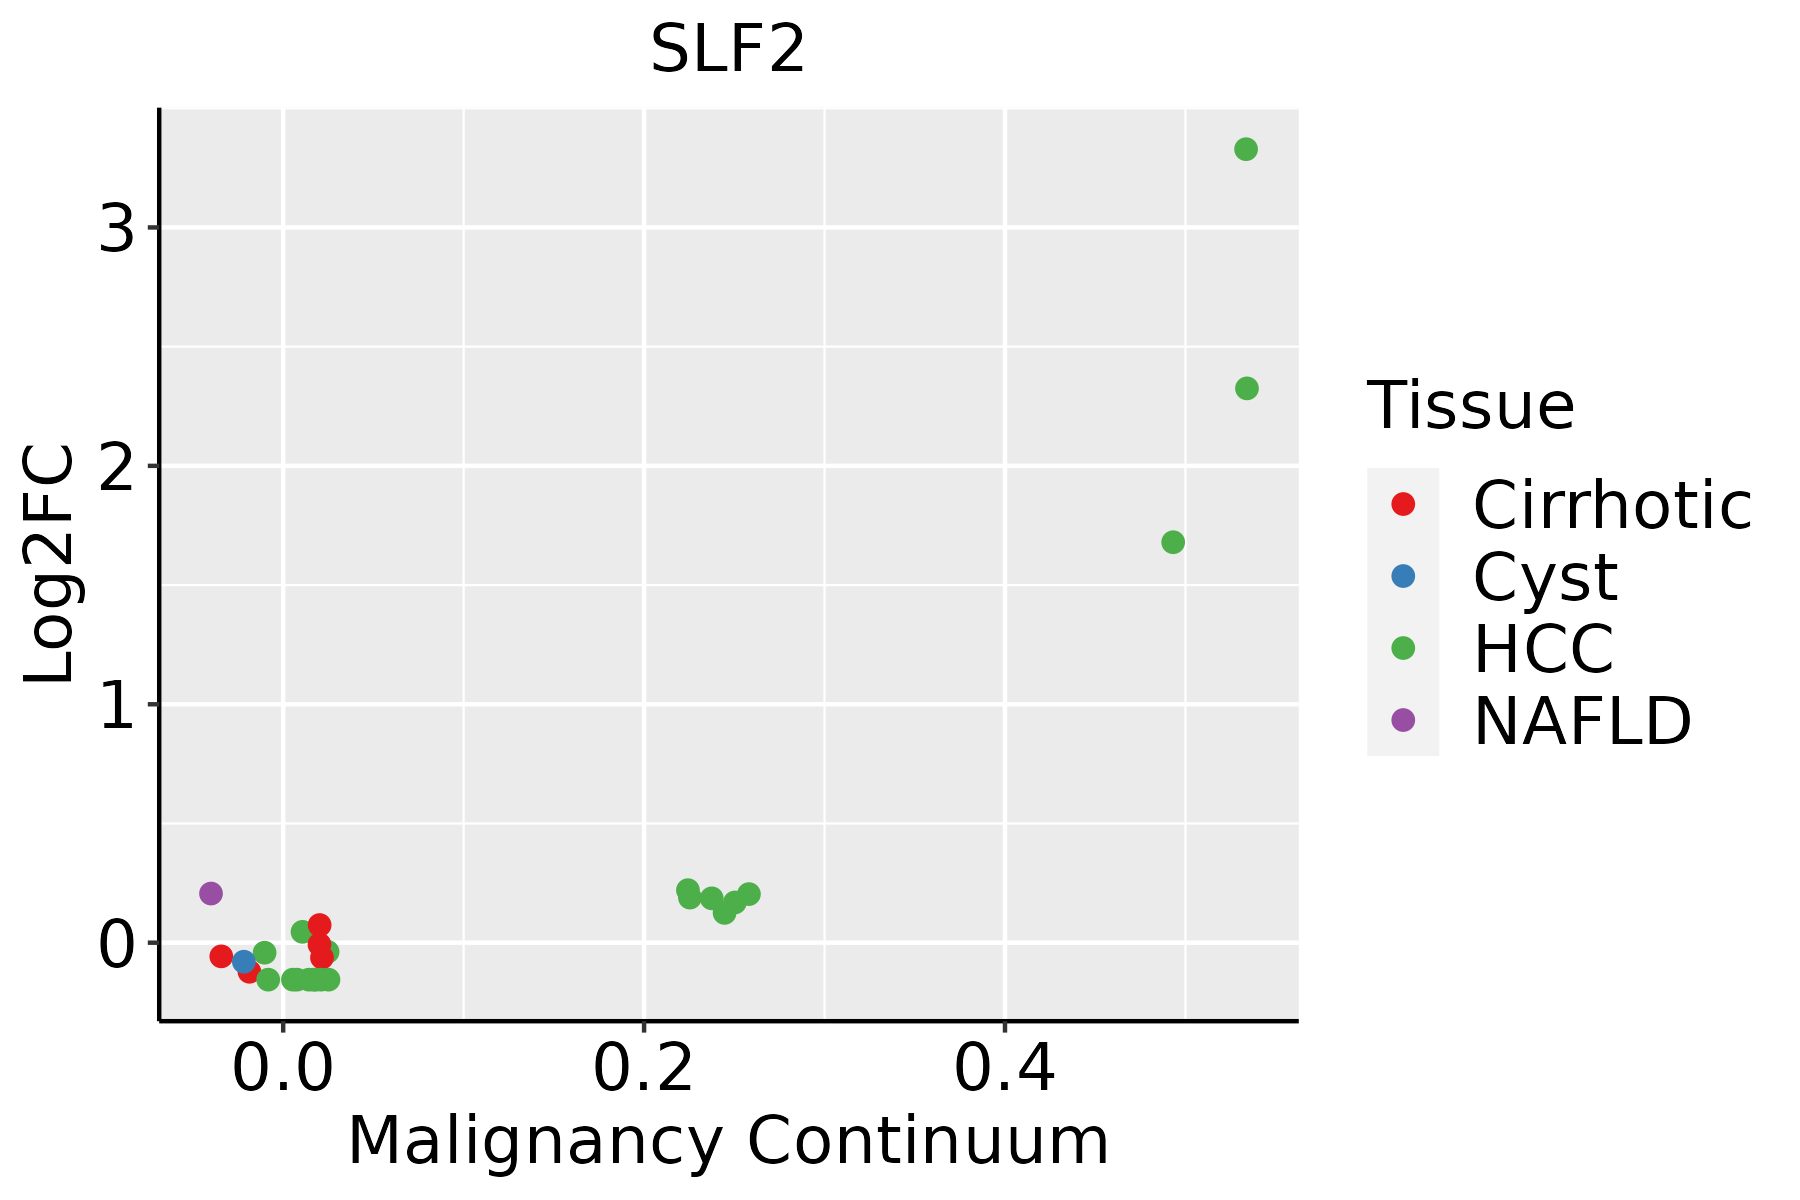
HCC: Hepatocellular carcinoma
NAFLD: Non-alcoholic fatty liver disease
Oral CavityThe image shows the transcriptomic changes along malignancy continuum.log2FC in expression of this searched gene in stem-like cells from each diseased tissue sample relative to stem-like cells in normal samples in each tissue plotted against the malignancy continuum. Samples are colored based on if they are from different disease stage.EOLP: Erosive Oral lichen planus
LP: leukoplakia
NEOLP: Non-erosive oral lichen planus
OSCC: Oral squamous cell carcinoma
ThyroidThe image shows the transcriptomic changes along malignancy continuum.log2FC in expression of this searched gene in stem-like cells from each diseased tissue sample relative to stem-like cells in normal samples in each tissue plotted against the malignancy continuum. Samples are colored based on if they are from different disease stage.
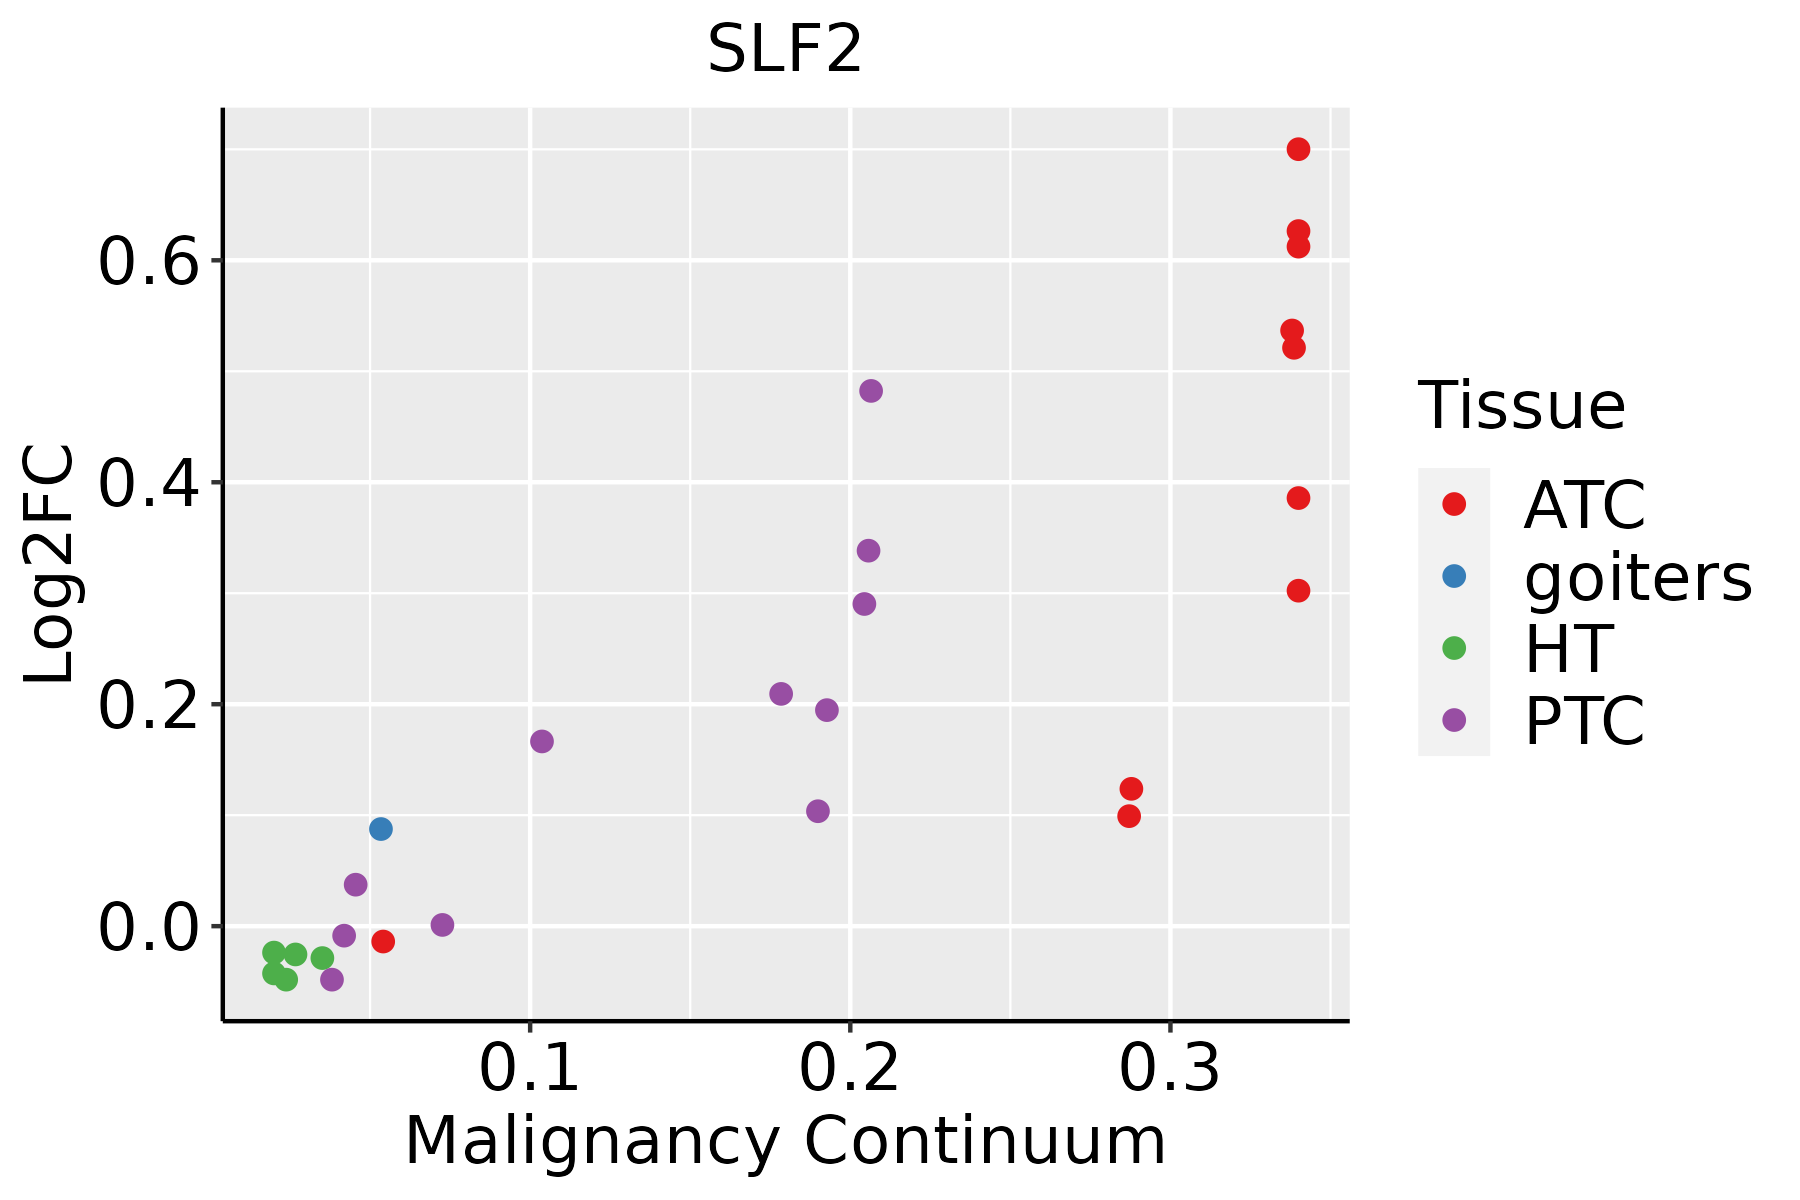
ATC: Anaplastic thyroid cancer
HT: Hashimoto's thyroiditis
PTC: Papillary thyroid cancer
∗log2FC in expression of this searched gene in stem-like cells from each diseased tissue sample relative to stem-like cells in normal samples in each tissue plotted against the malignancy continuum. Samples are colored based on if they are from different disease stage.

Top

Malignant transformation related pathway analysis

check buttonFind out the enriched GO biological processes and KEGG pathways involved in transition from healthy to precancer to cancer
check button Figure of enriched GO biological processes.
TissueDisease StageEnriched GO biological Processes
ColorectumADGO analysis - Figure of enriched GO biological processes: Top 15 enriched GO BP terms are showed in the bar plot of each disease state in each tissue. Each row represents a significant GO biological process which is colored according to the -log10(p.adjust).
ColorectumSERGO analysis - Figure of enriched GO biological processes: Top 15 enriched GO BP terms are showed in the bar plot of each disease state in each tissue. Each row represents a significant GO biological process which is colored according to the -log10(p.adjust).
ColorectumMSSGO analysis - Figure of enriched GO biological processes: Top 15 enriched GO BP terms are showed in the bar plot of each disease state in each tissue. Each row represents a significant GO biological process which is colored according to the -log10(p.adjust).
ColorectumMSI-HGO analysis - Figure of enriched GO biological processes: Top 15 enriched GO BP terms are showed in the bar plot of each disease state in each tissue. Each row represents a significant GO biological process which is colored according to the -log10(p.adjust).
ColorectumFAPGO analysis - Figure of enriched GO biological processes: Top 15 enriched GO BP terms are showed in the bar plot of each disease state in each tissue. Each row represents a significant GO biological process which is colored according to the -log10(p.adjust).
∗Top 15 enriched GO BP terms are showed in the bar plot of each disease state in each tissue. Each row represents a significant GO biological process which is colored according to the -log10(p.adjust).
Page: 1 2 3 4 5 6 7 8 9 

check button Enriched GO biological processes.
GO IDTissueDisease StageDescriptionGene RatioBg Ratiopvaluep.adjustCount
GO:014001414EsophagusESCCmitotic nuclear division218/8552287/187236.17e-261.78e-23218
GO:000007011EsophagusESCCmitotic sister chromatid segregation138/8552168/187231.37e-222.63e-20138
GO:00008194EsophagusESCCsister chromatid segregation157/8552202/187238.41e-211.33e-18157
GO:003304416EsophagusESCCregulation of chromosome organization145/8552187/187233.80e-194.31e-17145
GO:000705911EsophagusESCCchromosome segregation238/8552346/187231.72e-181.82e-16238
GO:0043254111EsophagusESCCregulation of protein-containing complex assembly278/8552428/187233.81e-162.77e-14278
GO:0031334111EsophagusESCCpositive regulation of protein-containing complex assembly166/8552237/187232.06e-141.07e-12166
GO:005105215EsophagusESCCregulation of DNA metabolic process232/8552359/187232.40e-131.13e-11232
GO:00482853EsophagusESCCorganelle fission301/8552488/187234.64e-132.12e-11301
GO:00988133EsophagusESCCnuclear chromosome segregation187/8552281/187231.00e-124.36e-11187
GO:00002802EsophagusESCCnuclear division270/8552439/187231.17e-114.24e-10270
GO:005105417EsophagusESCCpositive regulation of DNA metabolic process139/8552201/187231.20e-114.33e-10139
GO:2001020110EsophagusESCCregulation of response to DNA damage stimulus145/8552219/187235.97e-101.50e-08145
GO:004578710EsophagusESCCpositive regulation of cell cycle196/8552313/187239.27e-102.24e-08196
GO:200125219EsophagusESCCpositive regulation of chromosome organization64/855282/187231.98e-094.52e-0864
GO:003450211EsophagusESCCprotein localization to chromosome70/855292/187232.54e-095.64e-0870
GO:00063024EsophagusESCCdouble-strand break repair152/8552251/187231.33e-061.62e-05152
GO:00900689EsophagusESCCpositive regulation of cell cycle process142/8552236/187234.79e-065.08e-05142
GO:20010228EsophagusESCCpositive regulation of response to DNA damage stimulus69/8552105/187232.66e-052.22e-0469
GO:00062826EsophagusESCCregulation of DNA repair82/8552130/187234.65e-053.66e-0482
Page: 1 2 3 4 5 6 7 8 

check button Enriched KEGG pathways.
Pathway IDTissueDisease StageDescriptionGene RatioBg Ratiopvaluep.adjustqvalueCount
Page: 1 

Top

Cell-cell communication analysis

check buttonIdentification of potential cell-cell interactions between two cell types and their ligand-receptor pairs for different disease states
LigandReceptorLRpairPathwayTissueDisease Stage
Page: 1 

Top

Single-cell gene regulatory network inference analysis

check buttonFind out the significant the regulons (TFs) and the target genes of each regulon across cell types for different disease states
TFCell TypeTissueDisease StageTarget GeneRSSRegulon Activity
∗The dot plots of a searched regulon are shown for all cell subpopulations in each disease state of each tissue based on the regulon specific score inferred using pySCENIC and by calculating the average expression.
Page: 1 

Top

Somatic mutation of malignant transformation related genes

check buttonAnnotation of somatic variants for genes involved in malignant transformation
Hugo SymbolVariant ClassVariant ClassificationdbSNP RSHGVScHGVSpHGVSp ShortSWISSPROTBIOTYPESIFTPolyPhenTumor Sample BarcodeTissueHistologySexAgeStageTherapy TypesDrugsOutcome
SLF2SNVMissense_Mutationnovelc.1189N>Gp.Ser397Glyp.S397GQ8IX21protein_codingtolerated(0.45)benign(0.006)TCGA-A2-A1FZ-01Breastbreast invasive carcinomaFemale<65I/IIUnspecificArimidexSD
SLF2SNVMissense_Mutationnovelc.725C>Tp.Ser242Phep.S242FQ8IX21protein_codingdeleterious(0)benign(0.025)TCGA-BH-A2L8-01Breastbreast invasive carcinomaFemale<65I/IIChemotherapycytoxanCR
SLF2SNVMissense_Mutationnovelc.337N>Ap.Glu113Lysp.E113KQ8IX21protein_codingtolerated(0.12)benign(0.007)TCGA-D8-A73U-01Breastbreast invasive carcinomaFemale>=65I/IIHormone TherapytamoxiphenSD
SLF2SNVMissense_Mutationc.685N>Cp.Glu229Glnp.E229QQ8IX21protein_codingtolerated(0.11)probably_damaging(0.947)TCGA-E2-A1LG-01Breastbreast invasive carcinomaFemale<65I/IIChemotherapydoxorubicinSD
SLF2insertionNonsense_Mutationnovelc.825_826insTACATGAGTCACGTCGGCCTTGTCTGTCACTAGCCTCCp.Lys276TyrfsTer11p.K276Yfs*11Q8IX21protein_codingTCGA-BH-A0DZ-01Breastbreast invasive carcinomaFemale<65I/IIChemotherapydocetaxelSD
SLF2SNVMissense_Mutationnovelc.577A>Gp.Thr193Alap.T193AQ8IX21protein_codingtolerated(0.48)benign(0.001)TCGA-2W-A8YY-01Cervixcervical & endocervical cancerFemale<65I/IIChemotherapycisplatinCR
SLF2SNVMissense_Mutationnovelc.1412C>Tp.Thr471Ilep.T471IQ8IX21protein_codingtolerated(0.51)benign(0.084)TCGA-2W-A8YY-01Cervixcervical & endocervical cancerFemale<65I/IIChemotherapycisplatinCR
SLF2SNVMissense_Mutationrs747051897c.1636C>Tp.Arg546Cysp.R546CQ8IX21protein_codingtolerated(0.2)benign(0)TCGA-2W-A8YY-01Cervixcervical & endocervical cancerFemale<65I/IIChemotherapycisplatinCR
SLF2SNVMissense_Mutationc.1090N>Ap.Arg364Serp.R364SQ8IX21protein_codingtolerated(0.45)benign(0.151)TCGA-C5-A1MH-01Cervixcervical & endocervical cancerFemale>=65III/IVChemotherapycisplatinPD
SLF2SNVMissense_Mutationnovelc.1708N>Ap.Ala570Thrp.A570TQ8IX21protein_codingtolerated(0.88)benign(0)TCGA-C5-A7XC-01Cervixcervical & endocervical cancerFemale<65I/IIUnknownUnknownSD
Page: 1 2 3 4 5 6 7 8 9 10 

Top

Related drugs of malignant transformation related genes

check buttonIdentification of chemicals and drugs interact with genes involved in malignant transfromation
(DGIdb 4.0)
Entrez IDSymbolCategoryInteraction TypesDrug Claim NameDrug NamePMIDs
Page: 1