
|
|||||
|
 | |
| |
| |
| |
| |
| |
|
Gene: SLF1 |
Gene summary for SLF1 |
| Gene information | Species | Human | Gene symbol | SLF1 | Gene ID | 84250 |
| Gene name | SMC5-SMC6 complex localization factor 1 | |
| Gene Alias | ANKRD32 | |
| Cytomap | 5q15 | |
| Gene Type | protein-coding | GO ID | GO:0000070 | UniProtAcc | I6L9F1 |
Top |
Malignant transformation analysis |
| Identification of the aberrant gene expression in precancerous and cancerous lesions by comparing the gene expression of stem-like cells in diseased tissues with normal stem cells |
| Entrez ID | Symbol | Replicates | Species | Organ | Tissue | Adj P-value | Log2FC | Malignancy |
| 84250 | SLF1 | LZE2T | Human | Esophagus | ESCC | 2.97e-02 | 4.02e-01 | 0.082 |
| 84250 | SLF1 | LZE7T | Human | Esophagus | ESCC | 1.45e-03 | 2.71e-01 | 0.0667 |
| 84250 | SLF1 | LZE24T | Human | Esophagus | ESCC | 5.17e-04 | 1.65e-01 | 0.0596 |
| 84250 | SLF1 | LZE6T | Human | Esophagus | ESCC | 3.75e-05 | 2.83e-01 | 0.0845 |
| 84250 | SLF1 | P1T-E | Human | Esophagus | ESCC | 3.45e-02 | 1.71e-01 | 0.0875 |
| 84250 | SLF1 | P2T-E | Human | Esophagus | ESCC | 6.62e-20 | 4.36e-01 | 0.1177 |
| 84250 | SLF1 | P4T-E | Human | Esophagus | ESCC | 1.19e-05 | 1.83e-01 | 0.1323 |
| 84250 | SLF1 | P5T-E | Human | Esophagus | ESCC | 4.40e-09 | 1.72e-01 | 0.1327 |
| 84250 | SLF1 | P8T-E | Human | Esophagus | ESCC | 4.24e-18 | 2.92e-01 | 0.0889 |
| 84250 | SLF1 | P9T-E | Human | Esophagus | ESCC | 5.72e-03 | 1.02e-01 | 0.1131 |
| 84250 | SLF1 | P10T-E | Human | Esophagus | ESCC | 1.62e-13 | 2.06e-01 | 0.116 |
| 84250 | SLF1 | P12T-E | Human | Esophagus | ESCC | 2.05e-07 | 1.49e-01 | 0.1122 |
| 84250 | SLF1 | P15T-E | Human | Esophagus | ESCC | 2.33e-05 | 1.84e-01 | 0.1149 |
| 84250 | SLF1 | P20T-E | Human | Esophagus | ESCC | 4.49e-10 | 2.55e-01 | 0.1124 |
| 84250 | SLF1 | P21T-E | Human | Esophagus | ESCC | 1.88e-04 | 8.52e-02 | 0.1617 |
| 84250 | SLF1 | P22T-E | Human | Esophagus | ESCC | 1.62e-13 | 2.52e-01 | 0.1236 |
| 84250 | SLF1 | P23T-E | Human | Esophagus | ESCC | 5.13e-09 | 3.11e-01 | 0.108 |
| 84250 | SLF1 | P24T-E | Human | Esophagus | ESCC | 3.75e-03 | 1.03e-01 | 0.1287 |
| 84250 | SLF1 | P26T-E | Human | Esophagus | ESCC | 7.98e-13 | 2.72e-01 | 0.1276 |
| 84250 | SLF1 | P27T-E | Human | Esophagus | ESCC | 9.35e-10 | 2.20e-01 | 0.1055 |
| Page: 1 2 3 |
| Tissue | Expression Dynamics | Abbreviation |
| Esophagus | 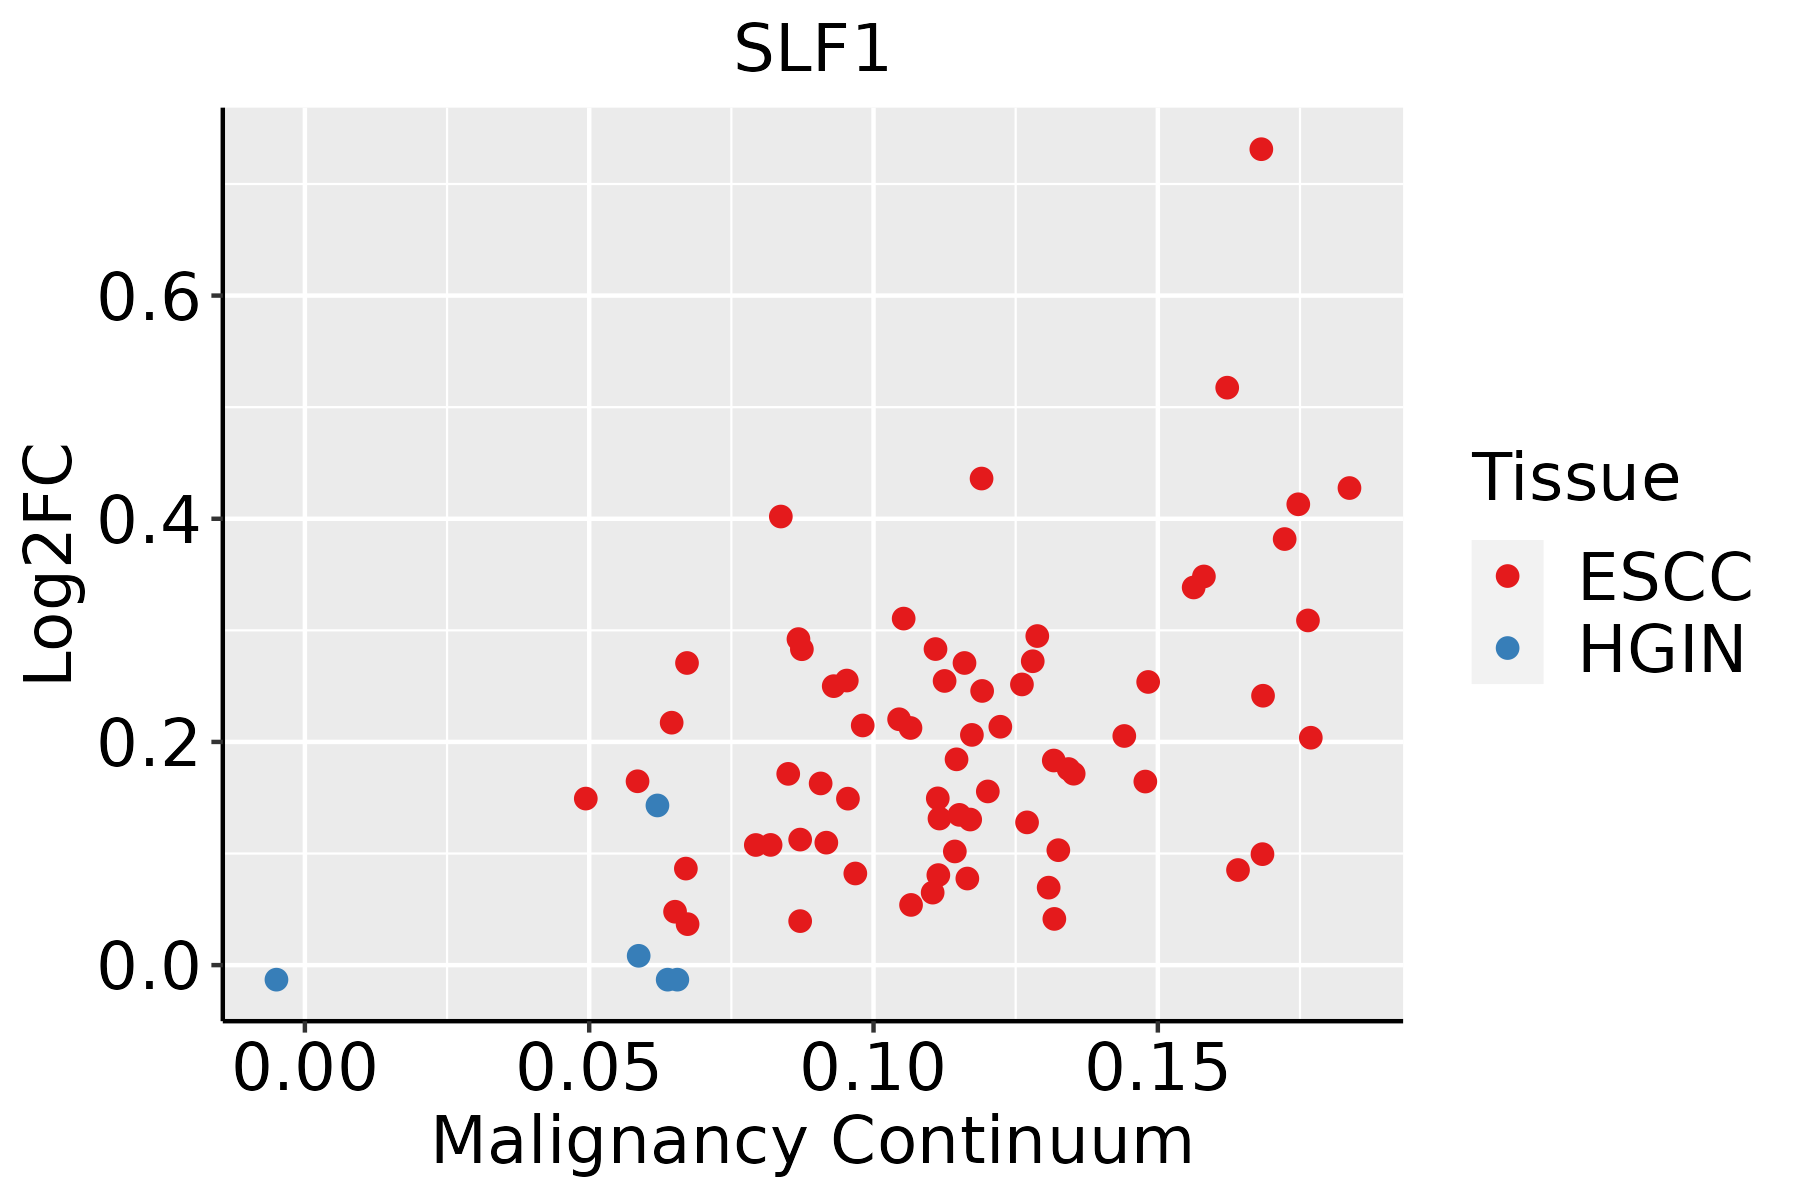 | ESCC: Esophageal squamous cell carcinoma |
| HGIN: High-grade intraepithelial neoplasias | ||
| LGIN: Low-grade intraepithelial neoplasias | ||
| Oral Cavity |  | EOLP: Erosive Oral lichen planus |
| LP: leukoplakia | ||
| NEOLP: Non-erosive oral lichen planus | ||
| OSCC: Oral squamous cell carcinoma |
| ∗log2FC in expression of this searched gene in stem-like cells from each diseased tissue sample relative to stem-like cells in normal samples in each tissue plotted against the malignancy continuum. Samples are colored based on if they are from different disease stage. |
Top |
Malignant transformation related pathway analysis |
| Find out the enriched GO biological processes and KEGG pathways involved in transition from healthy to precancer to cancer |
| Tissue | Disease Stage | Enriched GO biological Processes |
| Colorectum | AD |  |
| Colorectum | SER |  |
| Colorectum | MSS |  |
| Colorectum | MSI-H |  |
| Colorectum | FAP |  |
| ∗Top 15 enriched GO BP terms are showed in the bar plot of each disease state in each tissue. Each row represents a significant GO biological process which is colored according to the -log10(p.adjust). |
| Page: 1 2 3 4 5 6 7 8 9 |
| GO ID | Tissue | Disease Stage | Description | Gene Ratio | Bg Ratio | pvalue | p.adjust | Count |
| GO:014001414 | Esophagus | ESCC | mitotic nuclear division | 218/8552 | 287/18723 | 6.17e-26 | 1.78e-23 | 218 |
| GO:000007011 | Esophagus | ESCC | mitotic sister chromatid segregation | 138/8552 | 168/18723 | 1.37e-22 | 2.63e-20 | 138 |
| GO:00008194 | Esophagus | ESCC | sister chromatid segregation | 157/8552 | 202/18723 | 8.41e-21 | 1.33e-18 | 157 |
| GO:003304416 | Esophagus | ESCC | regulation of chromosome organization | 145/8552 | 187/18723 | 3.80e-19 | 4.31e-17 | 145 |
| GO:000705911 | Esophagus | ESCC | chromosome segregation | 238/8552 | 346/18723 | 1.72e-18 | 1.82e-16 | 238 |
| GO:0043254111 | Esophagus | ESCC | regulation of protein-containing complex assembly | 278/8552 | 428/18723 | 3.81e-16 | 2.77e-14 | 278 |
| GO:0031334111 | Esophagus | ESCC | positive regulation of protein-containing complex assembly | 166/8552 | 237/18723 | 2.06e-14 | 1.07e-12 | 166 |
| GO:005105215 | Esophagus | ESCC | regulation of DNA metabolic process | 232/8552 | 359/18723 | 2.40e-13 | 1.13e-11 | 232 |
| GO:00482853 | Esophagus | ESCC | organelle fission | 301/8552 | 488/18723 | 4.64e-13 | 2.12e-11 | 301 |
| GO:00988133 | Esophagus | ESCC | nuclear chromosome segregation | 187/8552 | 281/18723 | 1.00e-12 | 4.36e-11 | 187 |
| GO:00002802 | Esophagus | ESCC | nuclear division | 270/8552 | 439/18723 | 1.17e-11 | 4.24e-10 | 270 |
| GO:005105417 | Esophagus | ESCC | positive regulation of DNA metabolic process | 139/8552 | 201/18723 | 1.20e-11 | 4.33e-10 | 139 |
| GO:2001020110 | Esophagus | ESCC | regulation of response to DNA damage stimulus | 145/8552 | 219/18723 | 5.97e-10 | 1.50e-08 | 145 |
| GO:004578710 | Esophagus | ESCC | positive regulation of cell cycle | 196/8552 | 313/18723 | 9.27e-10 | 2.24e-08 | 196 |
| GO:200125219 | Esophagus | ESCC | positive regulation of chromosome organization | 64/8552 | 82/18723 | 1.98e-09 | 4.52e-08 | 64 |
| GO:003450211 | Esophagus | ESCC | protein localization to chromosome | 70/8552 | 92/18723 | 2.54e-09 | 5.64e-08 | 70 |
| GO:00063024 | Esophagus | ESCC | double-strand break repair | 152/8552 | 251/18723 | 1.33e-06 | 1.62e-05 | 152 |
| GO:00900689 | Esophagus | ESCC | positive regulation of cell cycle process | 142/8552 | 236/18723 | 4.79e-06 | 5.08e-05 | 142 |
| GO:20010228 | Esophagus | ESCC | positive regulation of response to DNA damage stimulus | 69/8552 | 105/18723 | 2.66e-05 | 2.22e-04 | 69 |
| GO:00062826 | Esophagus | ESCC | regulation of DNA repair | 82/8552 | 130/18723 | 4.65e-05 | 3.66e-04 | 82 |
| Page: 1 2 3 |
| Pathway ID | Tissue | Disease Stage | Description | Gene Ratio | Bg Ratio | pvalue | p.adjust | qvalue | Count |
| Page: 1 |
Top |
Cell-cell communication analysis |
| Identification of potential cell-cell interactions between two cell types and their ligand-receptor pairs for different disease states |
| Ligand | Receptor | LRpair | Pathway | Tissue | Disease Stage |
| Page: 1 |
Top |
Single-cell gene regulatory network inference analysis |
| Find out the significant the regulons (TFs) and the target genes of each regulon across cell types for different disease states |
| TF | Cell Type | Tissue | Disease Stage | Target Gene | RSS | Regulon Activity |
| ∗The dot plots of a searched regulon are shown for all cell subpopulations in each disease state of each tissue based on the regulon specific score inferred using pySCENIC and by calculating the average expression. |
| Page: 1 |
Top |
Somatic mutation of malignant transformation related genes |
| Annotation of somatic variants for genes involved in malignant transformation |
| Hugo Symbol | Variant Class | Variant Classification | dbSNP RS | HGVSc | HGVSp | HGVSp Short | SWISSPROT | BIOTYPE | SIFT | PolyPhen | Tumor Sample Barcode | Tissue | Histology | Sex | Age | Stage | Therapy Types | Drugs | Outcome |
| SLF1 | SNV | Missense_Mutation | c.2651C>T | p.Ser884Leu | p.S884L | Q9BQI6 | protein_coding | tolerated(0.09) | benign(0.1) | TCGA-A2-A0YC-01 | Breast | breast invasive carcinoma | Female | <65 | I/II | Hormone Therapy | arimidex | PD | |
| SLF1 | SNV | Missense_Mutation | rs781586963 | c.1598N>C | p.His533Pro | p.H533P | Q9BQI6 | protein_coding | deleterious(0.01) | benign(0.136) | TCGA-AQ-A04H-01 | Breast | breast invasive carcinoma | Female | <65 | III/IV | Chemotherapy | taxotere | SD |
| SLF1 | SNV | Missense_Mutation | c.1963N>G | p.Leu655Val | p.L655V | Q9BQI6 | protein_coding | tolerated(0.31) | benign(0.017) | TCGA-B6-A0IB-01 | Breast | breast invasive carcinoma | Female | <65 | III/IV | Unknown | Unknown | PD | |
| SLF1 | SNV | Missense_Mutation | rs760036880 | c.2728N>A | p.Gly910Arg | p.G910R | Q9BQI6 | protein_coding | deleterious(0) | probably_damaging(0.995) | TCGA-BH-A0HK-01 | Breast | breast invasive carcinoma | Female | >=65 | I/II | Hormone Therapy | arimidex | SD |
| SLF1 | insertion | Frame_Shift_Ins | novel | c.2305_2306insTTATAAATACA | p.Cys769PhefsTer9 | p.C769Ffs*9 | Q9BQI6 | protein_coding | TCGA-AC-A3QQ-01 | Breast | breast invasive carcinoma | Female | <65 | I/II | Unknown | Unknown | SD | ||
| SLF1 | SNV | Missense_Mutation | novel | c.2004C>G | p.Phe668Leu | p.F668L | Q9BQI6 | protein_coding | tolerated(0.09) | probably_damaging(0.985) | TCGA-C5-A7X5-01 | Cervix | cervical & endocervical cancer | Female | >=65 | I/II | Chemotherapy | carboplatin | PD |
| SLF1 | SNV | Missense_Mutation | c.1720N>C | p.Glu574Gln | p.E574Q | Q9BQI6 | protein_coding | deleterious(0.03) | benign(0.382) | TCGA-IR-A3LK-01 | Cervix | cervical & endocervical cancer | Female | >=65 | I/II | Chemotherapy | cisplatin | PD | |
| SLF1 | SNV | Missense_Mutation | novel | c.515G>C | p.Arg172Thr | p.R172T | Q9BQI6 | protein_coding | tolerated(0.74) | benign(0.007) | TCGA-ZJ-AAXT-01 | Cervix | cervical & endocervical cancer | Female | <65 | III/IV | Unknown | Unknown | SD |
| SLF1 | SNV | Missense_Mutation | c.1346N>T | p.Ala449Val | p.A449V | Q9BQI6 | protein_coding | tolerated(0.12) | benign(0.006) | TCGA-A6-3809-01 | Colorectum | colon adenocarcinoma | Female | >=65 | I/II | Unknown | Unknown | SD | |
| SLF1 | SNV | Missense_Mutation | c.2333N>G | p.Lys778Arg | p.K778R | Q9BQI6 | protein_coding | tolerated(0.56) | benign(0.015) | TCGA-A6-3809-01 | Colorectum | colon adenocarcinoma | Female | >=65 | I/II | Unknown | Unknown | SD |
| Page: 1 2 3 4 5 6 7 8 9 10 |
Top |
Related drugs of malignant transformation related genes |
| Identification of chemicals and drugs interact with genes involved in malignant transfromation |
| (DGIdb 4.0) |
| Entrez ID | Symbol | Category | Interaction Types | Drug Claim Name | Drug Name | PMIDs |
| Page: 1 |

Copyright 2023-Present -The University of Texas Health Science Center at Houston |