Schematic overview of the cellular and molecular mechanisms involved in the cancer progression, including the proposed cellular and molecular mechanisms in cancer cells trajectory. AT1: alveolar type 1 cells; AT2: alveolar type 2 cells; AAH: atypical adenomatous hyperplasia; AIS: adenocarcinoma in situ; MIA: minimally invasive adenocarcinoma; IA: invasive adenocarcinoma; EMT: epithelial-mesenchymal transition

Home

Download

Statistics

Help

Contact

Center for Computational Systems Medicine
leaf

Gene summary

leaf

Malignant transformation analysis

leaf

Malignant transformation related pathway analysis

leaf

Cell-cell communication analysis

leaf

Single-cell gene regulatory network inference analysis

leaf

Somatic mutation of malignant transformation related genes

leaf

Related drugs of malignant transformation related genes

Gene: SLCO3A1

Gene summary for SLCO3A1

check button Gene summary.

Gene informationSpeciesHuman
Gene symbol

SLCO3A1

Gene ID

28232

Gene namesolute carrier organic anion transporter family member 3A1
Gene AliasOATP-D
Cytomap15q26.1
Gene Typeprotein-coding
GO ID

GO:0001932

UniProtAcc

Q9UIG8


Top

Malignant transformation analysis

check button Identification of the aberrant gene expression in precancerous and cancerous lesions by comparing the gene expression of stem-like cells in diseased tissues with normal stem cells
check button Malignant transformation involving gene list.
Entrez IDSymbolReplicatesSpeciesOrganTissueAdj P-valueLog2FCMalignancy
28232SLCO3A1CA_HPV_2HumanCervixCC5.30e-032.93e-010.0391
28232SLCO3A1CCI_1HumanCervixCC8.20e-031.84e+000.528
28232SLCO3A1CCI_2HumanCervixCC3.54e-071.53e+000.5249
28232SLCO3A1CCI_3HumanCervixCC1.86e-071.14e+000.516
28232SLCO3A1H2HumanCervixHSIL_HPV4.34e-02-2.04e-010.0632
28232SLCO3A1HTA11_3410_2000001011HumanColorectumAD3.21e-13-4.76e-010.0155
28232SLCO3A1HTA11_2487_2000001011HumanColorectumSER2.13e-09-6.21e-01-0.1808
28232SLCO3A1HTA11_1938_2000001011HumanColorectumAD1.18e-07-6.09e-01-0.0811
28232SLCO3A1HTA11_78_2000001011HumanColorectumAD4.22e-13-6.73e-01-0.1088
28232SLCO3A1HTA11_3361_2000001011HumanColorectumAD1.12e-04-5.62e-01-0.1207
28232SLCO3A1HTA11_83_2000001011HumanColorectumSER1.36e-06-6.70e-01-0.1526
28232SLCO3A1HTA11_866_2000001011HumanColorectumAD3.94e-03-3.30e-01-0.1001
28232SLCO3A1HTA11_1391_2000001011HumanColorectumAD4.31e-06-4.86e-01-0.059
28232SLCO3A1HTA11_6818_2000001021HumanColorectumAD1.22e-02-3.90e-010.0588
28232SLCO3A1HTA11_99999971662_82457HumanColorectumMSS4.44e-19-5.44e-010.3859
28232SLCO3A1HTA11_99999974143_84620HumanColorectumMSS1.15e-08-4.54e-010.3005
28232SLCO3A1A015-C-203HumanColorectumFAP1.51e-181.58e-01-0.1294
28232SLCO3A1A015-C-204HumanColorectumFAP4.70e-06-3.61e-01-0.0228
28232SLCO3A1A002-C-201HumanColorectumFAP3.81e-09-2.50e-010.0324
28232SLCO3A1A002-C-203HumanColorectumFAP3.18e-13-4.28e-010.2786
Page: 1 2 3 4 5 6 7 

check button Transcriptomic changes along malignancy continuum.
TissueExpression DynamicsAbbreviation
CervixThe image shows the transcriptomic changes along malignancy continuum.log2FC in expression of this searched gene in stem-like cells from each diseased tissue sample relative to stem-like cells in normal samples in each tissue plotted against the malignancy continuum. Samples are colored based on if they are from different disease stage.CC: Cervix cancer
HSIL_HPV: HPV-infected high-grade squamous intraepithelial lesions
N_HPV: HPV-infected normal cervix
Colorectum (GSE201348)The image shows the transcriptomic changes along malignancy continuum.log2FC in expression of this searched gene in stem-like cells from each diseased tissue sample relative to stem-like cells in normal samples in each tissue plotted against the malignancy continuum. Samples are colored based on if they are from different disease stage.FAP: Familial adenomatous polyposis
CRC: Colorectal cancer
Colorectum (HTA11)The image shows the transcriptomic changes along malignancy continuum.log2FC in expression of this searched gene in stem-like cells from each diseased tissue sample relative to stem-like cells in normal samples in each tissue plotted against the malignancy continuum. Samples are colored based on if they are from different disease stage.AD: Adenomas
SER: Sessile serrated lesions
MSI-H: Microsatellite-high colorectal cancer
MSS: Microsatellite stable colorectal cancer
EsophagusThe image shows the transcriptomic changes along malignancy continuum.log2FC in expression of this searched gene in stem-like cells from each diseased tissue sample relative to stem-like cells in normal samples in each tissue plotted against the malignancy continuum. Samples are colored based on if they are from different disease stage.ESCC: Esophageal squamous cell carcinoma
HGIN: High-grade intraepithelial neoplasias
LGIN: Low-grade intraepithelial neoplasias
LiverThe image shows the transcriptomic changes along malignancy continuum.log2FC in expression of this searched gene in stem-like cells from each diseased tissue sample relative to stem-like cells in normal samples in each tissue plotted against the malignancy continuum. Samples are colored based on if they are from different disease stage.HCC: Hepatocellular carcinoma
NAFLD: Non-alcoholic fatty liver disease
LungThe image shows the transcriptomic changes along malignancy continuum.log2FC in expression of this searched gene in stem-like cells from each diseased tissue sample relative to stem-like cells in normal samples in each tissue plotted against the malignancy continuum. Samples are colored based on if they are from different disease stage.
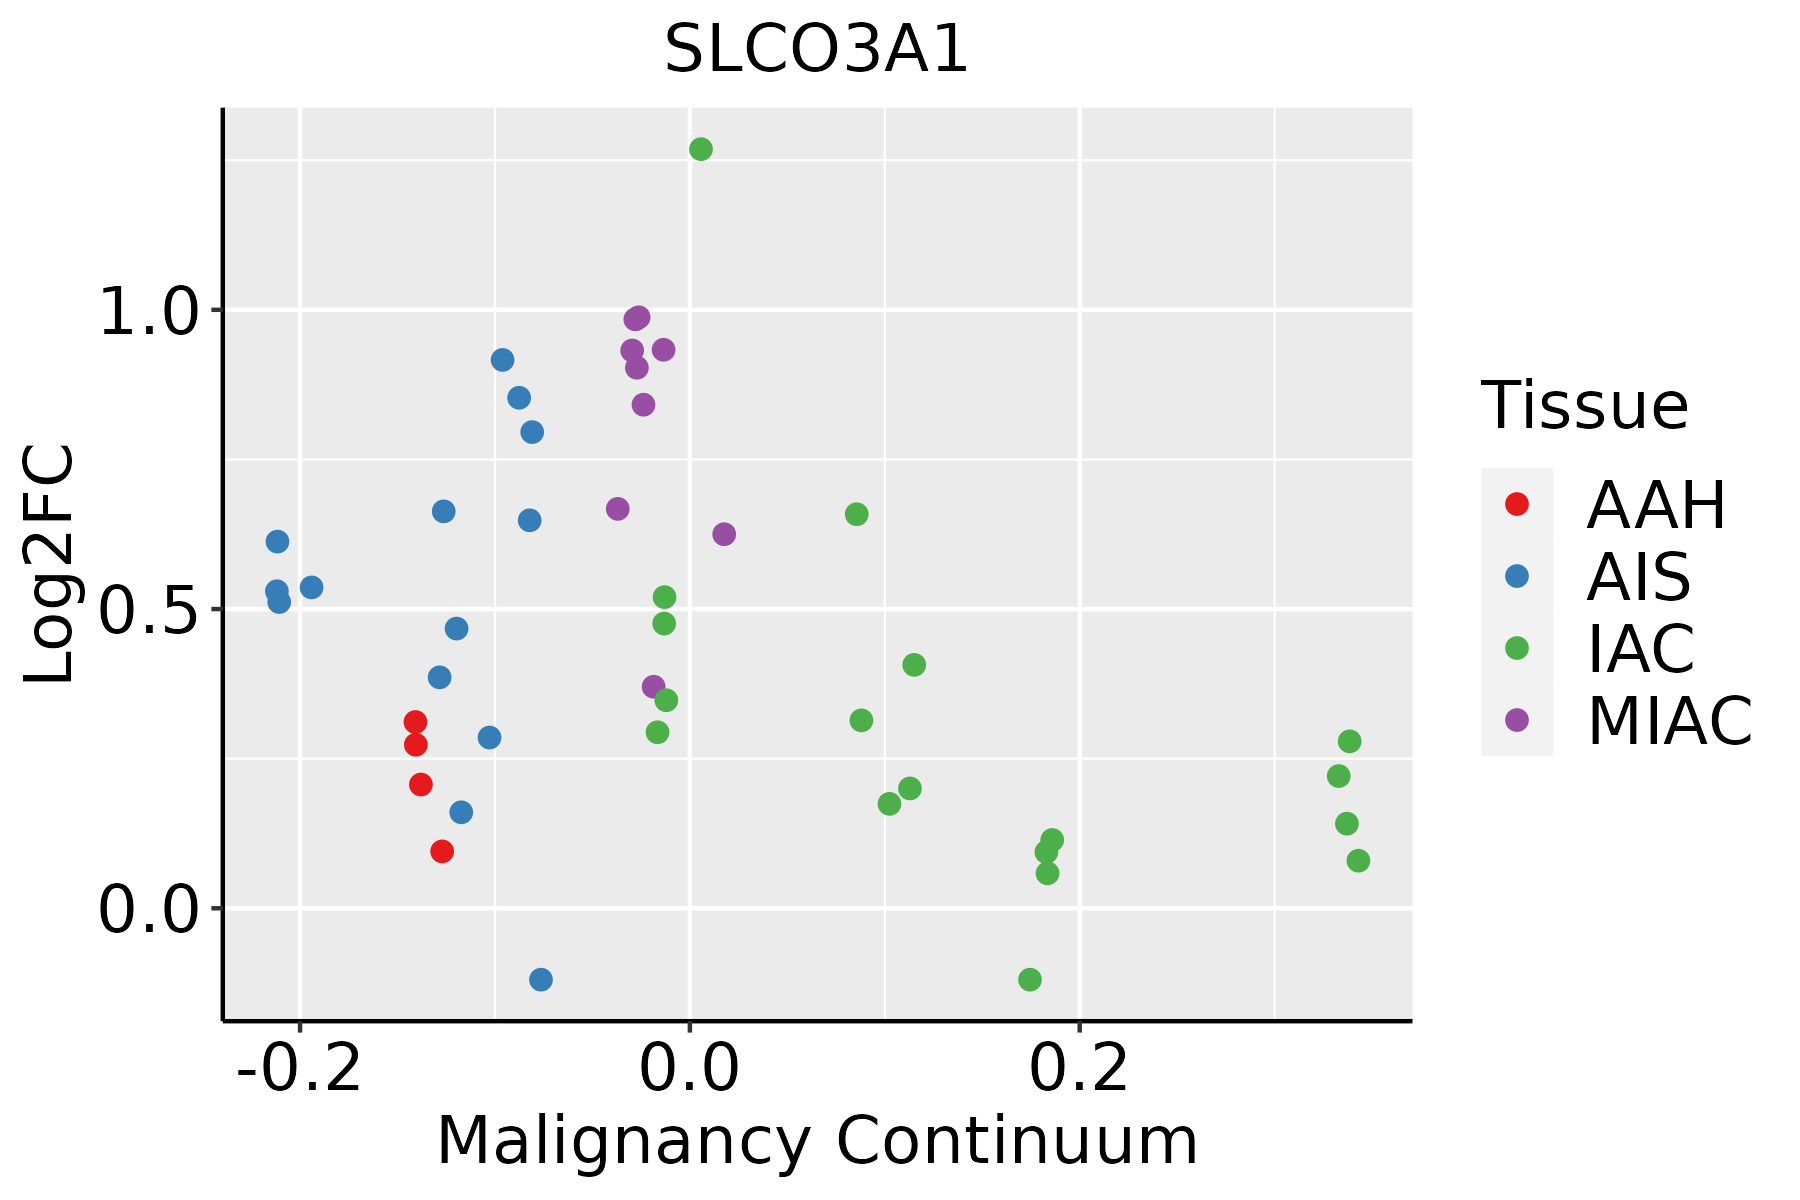
AAH: Atypical adenomatous hyperplasia
AIS: Adenocarcinoma in situ
IAC: Invasive lung adenocarcinoma
MIA: Minimally invasive adenocarcinoma
Oral CavityThe image shows the transcriptomic changes along malignancy continuum.log2FC in expression of this searched gene in stem-like cells from each diseased tissue sample relative to stem-like cells in normal samples in each tissue plotted against the malignancy continuum. Samples are colored based on if they are from different disease stage.EOLP: Erosive Oral lichen planus
LP: leukoplakia
NEOLP: Non-erosive oral lichen planus
OSCC: Oral squamous cell carcinoma
ThyroidThe image shows the transcriptomic changes along malignancy continuum.log2FC in expression of this searched gene in stem-like cells from each diseased tissue sample relative to stem-like cells in normal samples in each tissue plotted against the malignancy continuum. Samples are colored based on if they are from different disease stage.
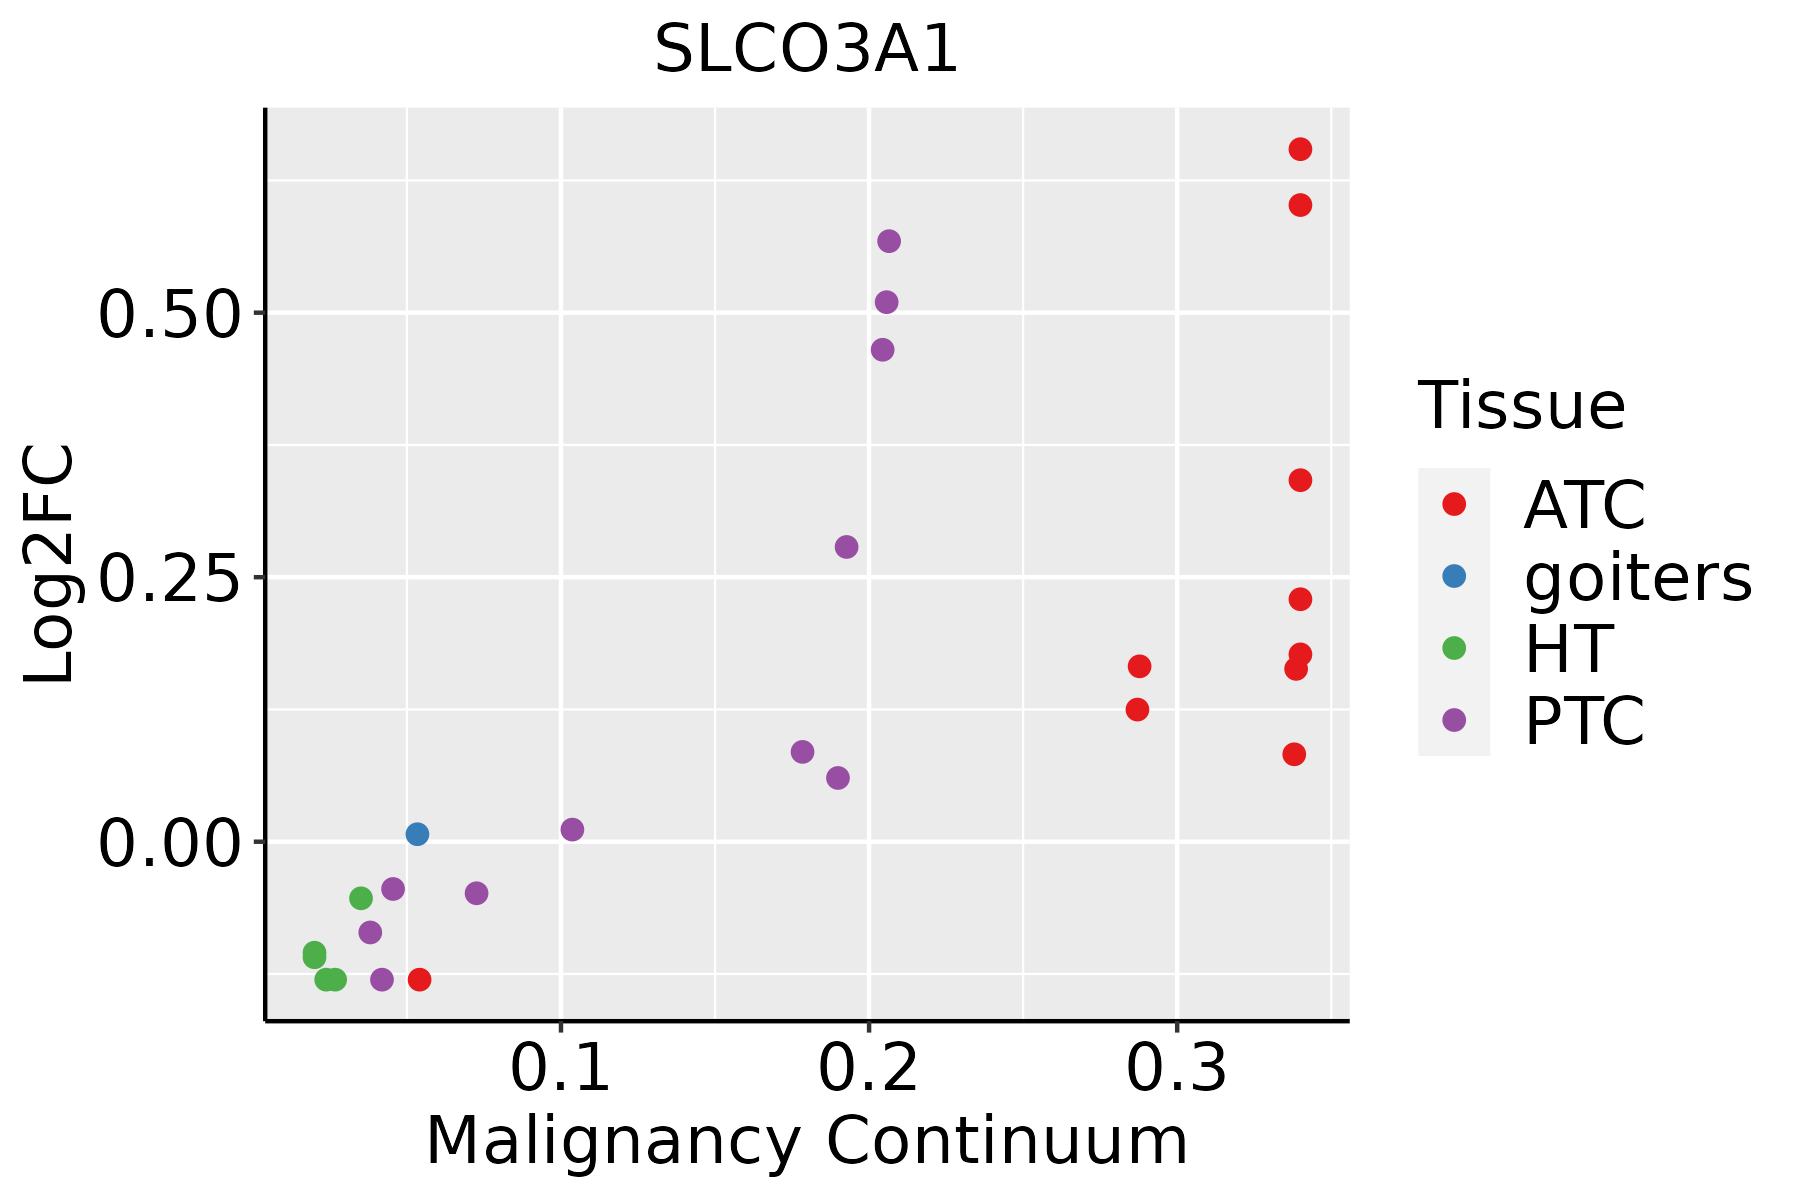
ATC: Anaplastic thyroid cancer
HT: Hashimoto's thyroiditis
PTC: Papillary thyroid cancer
∗log2FC in expression of this searched gene in stem-like cells from each diseased tissue sample relative to stem-like cells in normal samples in each tissue plotted against the malignancy continuum. Samples are colored based on if they are from different disease stage.

Top

Malignant transformation related pathway analysis

check buttonFind out the enriched GO biological processes and KEGG pathways involved in transition from healthy to precancer to cancer
check button Figure of enriched GO biological processes.
TissueDisease StageEnriched GO biological Processes
ColorectumADGO analysis - Figure of enriched GO biological processes: Top 15 enriched GO BP terms are showed in the bar plot of each disease state in each tissue. Each row represents a significant GO biological process which is colored according to the -log10(p.adjust).
ColorectumSERGO analysis - Figure of enriched GO biological processes: Top 15 enriched GO BP terms are showed in the bar plot of each disease state in each tissue. Each row represents a significant GO biological process which is colored according to the -log10(p.adjust).
ColorectumMSSGO analysis - Figure of enriched GO biological processes: Top 15 enriched GO BP terms are showed in the bar plot of each disease state in each tissue. Each row represents a significant GO biological process which is colored according to the -log10(p.adjust).
ColorectumMSI-HGO analysis - Figure of enriched GO biological processes: Top 15 enriched GO BP terms are showed in the bar plot of each disease state in each tissue. Each row represents a significant GO biological process which is colored according to the -log10(p.adjust).
ColorectumFAPGO analysis - Figure of enriched GO biological processes: Top 15 enriched GO BP terms are showed in the bar plot of each disease state in each tissue. Each row represents a significant GO biological process which is colored according to the -log10(p.adjust).
∗Top 15 enriched GO BP terms are showed in the bar plot of each disease state in each tissue. Each row represents a significant GO biological process which is colored according to the -log10(p.adjust).
Page: 1 2 3 4 5 6 7 8 9 

check button Enriched GO biological processes.
GO IDTissueDisease StageDescriptionGene RatioBg Ratiopvaluep.adjustCount
GO:00510904CervixCCregulation of DNA-binding transcription factor activity87/2311440/187234.85e-061.22e-0487
GO:00510915CervixCCpositive regulation of DNA-binding transcription factor activity51/2311260/187235.05e-044.92e-0351
GO:00510923CervixCCpositive regulation of NF-kappaB transcription factor activity32/2311152/187231.62e-031.25e-0232
GO:005109211CervixHSIL_HPVpositive regulation of NF-kappaB transcription factor activity20/737152/187232.25e-069.41e-0520
GO:005109012CervixHSIL_HPVregulation of DNA-binding transcription factor activity35/737440/187236.77e-051.58e-0335
GO:005109112CervixHSIL_HPVpositive regulation of DNA-binding transcription factor activity24/737260/187231.01e-042.16e-0324
GO:0015732ColorectumADprostaglandin transport10/391818/187231.31e-031.15e-0210
GO:0010876ColorectumADlipid localization120/3918448/187231.59e-031.33e-02120
GO:0006869ColorectumADlipid transport108/3918398/187231.67e-031.39e-02108
GO:0051091ColorectumADpositive regulation of DNA-binding transcription factor activity73/3918260/187233.52e-032.54e-0273
GO:00510911ColorectumSERpositive regulation of DNA-binding transcription factor activity56/2897260/187235.55e-034.09e-0256
GO:00510912ColorectumMSSpositive regulation of DNA-binding transcription factor activity69/3467260/187238.44e-048.71e-0369
GO:0150104ColorectumMSStransport across blood-brain barrier28/346787/187231.54e-031.41e-0228
GO:0010232ColorectumMSSvascular transport28/346788/187231.87e-031.64e-0228
GO:0051090ColorectumMSSregulation of DNA-binding transcription factor activity106/3467440/187231.88e-031.65e-02106
GO:00108761ColorectumMSSlipid localization104/3467448/187236.76e-034.38e-02104
GO:01501041ColorectumFAPtransport across blood-brain barrier25/262287/187232.63e-043.59e-0325
GO:00068691ColorectumFAPlipid transport81/2622398/187232.84e-043.76e-0381
GO:00157321ColorectumFAPprostaglandin transport9/262218/187233.00e-043.90e-039
GO:00102321ColorectumFAPvascular transport25/262288/187233.19e-044.12e-0325
Page: 1 2 3 

check button Enriched KEGG pathways.
Pathway IDTissueDisease StageDescriptionGene RatioBg Ratiopvaluep.adjustqvalueCount
Page: 1 

Top

Cell-cell communication analysis

check buttonIdentification of potential cell-cell interactions between two cell types and their ligand-receptor pairs for different disease states
LigandReceptorLRpairPathwayTissueDisease Stage
Page: 1 

Top

Single-cell gene regulatory network inference analysis

check buttonFind out the significant the regulons (TFs) and the target genes of each regulon across cell types for different disease states
TFCell TypeTissueDisease StageTarget GeneRSSRegulon Activity
∗The dot plots of a searched regulon are shown for all cell subpopulations in each disease state of each tissue based on the regulon specific score inferred using pySCENIC and by calculating the average expression.
Page: 1 

Top

Somatic mutation of malignant transformation related genes

check buttonAnnotation of somatic variants for genes involved in malignant transformation
Hugo SymbolVariant ClassVariant ClassificationdbSNP RSHGVScHGVSpHGVSp ShortSWISSPROTBIOTYPESIFTPolyPhenTumor Sample BarcodeTissueHistologySexAgeStageTherapy TypesDrugsOutcome
SLCO3A1SNVMissense_Mutationrs775241468c.1184C>Tp.Ala395Valp.A395VQ9UIG8protein_codingdeleterious(0)benign(0.33)TCGA-A8-A09Z-01Breastbreast invasive carcinomaFemale>=65I/IIUnknownUnknownSD
SLCO3A1SNVMissense_Mutationc.1408N>Tp.Pro470Serp.P470SQ9UIG8protein_codingtolerated(0.73)benign(0.006)TCGA-AN-A0FZ-01Breastbreast invasive carcinomaFemale<65III/IVUnknownUnknownSD
SLCO3A1SNVMissense_Mutationc.1073N>Tp.Ala358Valp.A358VQ9UIG8protein_codingdeleterious(0.02)possibly_damaging(0.81)TCGA-AO-A0J9-01Breastbreast invasive carcinomaFemale<65III/IVChemotherapycyclophosphamidePD
SLCO3A1SNVMissense_Mutationrs767466440c.1558N>Ap.Ala520Thrp.A520TQ9UIG8protein_codingtolerated(0.1)benign(0.106)TCGA-E2-A1LE-01Breastbreast invasive carcinomaFemale>=65III/IVChemotherapyherceptinPD
SLCO3A1SNVMissense_Mutationnovelc.949N>Cp.Gly317Argp.G317RQ9UIG8protein_codingtolerated(0.11)possibly_damaging(0.764)TCGA-S3-AA17-01Breastbreast invasive carcinomaFemale<65I/IIHormone TherapyanastrozoleSD
SLCO3A1SNVMissense_Mutationnovelc.950N>Ap.Gly317Glup.G317EQ9UIG8protein_codingtolerated(0.25)benign(0.098)TCGA-S3-AA17-01Breastbreast invasive carcinomaFemale<65I/IIHormone TherapyanastrozoleSD
SLCO3A1insertionNonsense_Mutationnovelc.282_283insGGCCTCATGCATACTTAGTCTGTCTTCTCAAAATTGTGTTp.Phe95GlyfsTer6p.F95Gfs*6Q9UIG8protein_codingTCGA-AN-A049-01Breastbreast invasive carcinomaFemale<65I/IIUnknownUnknownSD
SLCO3A1SNVMissense_Mutationnovelc.451N>Ap.Ala151Thrp.A151TQ9UIG8protein_codingtolerated(0.42)benign(0.046)TCGA-2W-A8YY-01Cervixcervical & endocervical cancerFemale<65I/IIChemotherapycisplatinCR
SLCO3A1SNVMissense_Mutationnovelc.1909G>Ap.Ala637Thrp.A637TQ9UIG8protein_codingtolerated(0.08)benign(0.339)TCGA-EA-A410-01Cervixcervical & endocervical cancerFemale<65I/IIUnknownUnknownSD
SLCO3A1SNVMissense_Mutationrs747216199c.939N>Tp.Lys313Asnp.K313NQ9UIG8protein_codingtolerated(0.19)benign(0.026)TCGA-A6-3809-01Colorectumcolon adenocarcinomaFemale>=65I/IIUnknownUnknownSD
Page: 1 2 3 4 5 6 7 8 9 10 11 

Top

Related drugs of malignant transformation related genes

check buttonIdentification of chemicals and drugs interact with genes involved in malignant transfromation
(DGIdb 4.0)
Entrez IDSymbolCategoryInteraction TypesDrug Claim NameDrug NamePMIDs
28232SLCO3A1TRANSPORTER, DRUGGABLE GENOME178101458
28232SLCO3A1TRANSPORTER, DRUGGABLE GENOME135651569
Page: 1