
|
|||||
|
 | |
| |
| |
| |
| |
| |
|
Gene: SLCO2A1 |
Gene summary for SLCO2A1 |
| Gene information | Species | Human | Gene symbol | SLCO2A1 | Gene ID | 6578 |
| Gene name | solute carrier organic anion transporter family member 2A1 | |
| Gene Alias | MATR1 | |
| Cytomap | 3q22.1-q22.2 | |
| Gene Type | protein-coding | GO ID | GO:0006810 | UniProtAcc | Q92959 |
Top |
Malignant transformation analysis |
| Identification of the aberrant gene expression in precancerous and cancerous lesions by comparing the gene expression of stem-like cells in diseased tissues with normal stem cells |
| Entrez ID | Symbol | Replicates | Species | Organ | Tissue | Adj P-value | Log2FC | Malignancy |
| 6578 | SLCO2A1 | HTA11_2487_2000001011 | Human | Colorectum | SER | 5.80e-04 | 2.34e-01 | -0.1808 |
| 6578 | SLCO2A1 | HTA11_411_2000001011 | Human | Colorectum | SER | 1.04e-02 | 8.46e-01 | -0.2602 |
| 6578 | SLCO2A1 | HTA11_696_2000001011 | Human | Colorectum | AD | 2.11e-03 | 2.26e-01 | -0.1464 |
| 6578 | SLCO2A1 | HTA11_5212_2000001011 | Human | Colorectum | AD | 3.06e-02 | 3.70e-01 | -0.2061 |
| 6578 | SLCO2A1 | HTA11_6818_2000001021 | Human | Colorectum | AD | 9.76e-09 | 2.78e-01 | 0.0588 |
| 6578 | SLCO2A1 | P2T-E | Human | Esophagus | ESCC | 1.55e-55 | 1.33e+00 | 0.1177 |
| 6578 | SLCO2A1 | P10T-E | Human | Esophagus | ESCC | 6.94e-32 | 8.81e-01 | 0.116 |
| 6578 | SLCO2A1 | P16T-E | Human | Esophagus | ESCC | 4.96e-06 | 6.16e-02 | 0.1153 |
| 6578 | SLCO2A1 | P17T-E | Human | Esophagus | ESCC | 2.45e-03 | 3.96e-01 | 0.1278 |
| 6578 | SLCO2A1 | P40T-E | Human | Esophagus | ESCC | 5.12e-03 | 1.97e-01 | 0.109 |
| 6578 | SLCO2A1 | P48T-E | Human | Esophagus | ESCC | 3.00e-02 | 9.97e-02 | 0.0959 |
| 6578 | SLCO2A1 | P61T-E | Human | Esophagus | ESCC | 2.93e-03 | 2.18e-01 | 0.099 |
| 6578 | SLCO2A1 | P62T-E | Human | Esophagus | ESCC | 2.98e-16 | 3.76e-01 | 0.1302 |
| 6578 | SLCO2A1 | P65T-E | Human | Esophagus | ESCC | 3.37e-02 | 9.67e-02 | 0.0978 |
| 6578 | SLCO2A1 | P79T-E | Human | Esophagus | ESCC | 1.12e-25 | 5.71e-01 | 0.1154 |
| 6578 | SLCO2A1 | C04 | Human | Oral cavity | OSCC | 2.62e-04 | 4.48e-01 | 0.2633 |
| 6578 | SLCO2A1 | C30 | Human | Oral cavity | OSCC | 4.22e-03 | 3.09e-01 | 0.3055 |
| 6578 | SLCO2A1 | C38 | Human | Oral cavity | OSCC | 2.16e-03 | 6.05e-01 | 0.172 |
| 6578 | SLCO2A1 | C46 | Human | Oral cavity | OSCC | 1.81e-10 | 3.37e-01 | 0.1673 |
| 6578 | SLCO2A1 | LN46 | Human | Oral cavity | OSCC | 3.17e-11 | 3.92e-01 | 0.1666 |
| Page: 1 2 |
| Tissue | Expression Dynamics | Abbreviation |
| Colorectum (GSE201348) |  | FAP: Familial adenomatous polyposis |
| CRC: Colorectal cancer | ||
| Colorectum (HTA11) |  | AD: Adenomas |
| SER: Sessile serrated lesions | ||
| MSI-H: Microsatellite-high colorectal cancer | ||
| MSS: Microsatellite stable colorectal cancer | ||
| Esophagus | 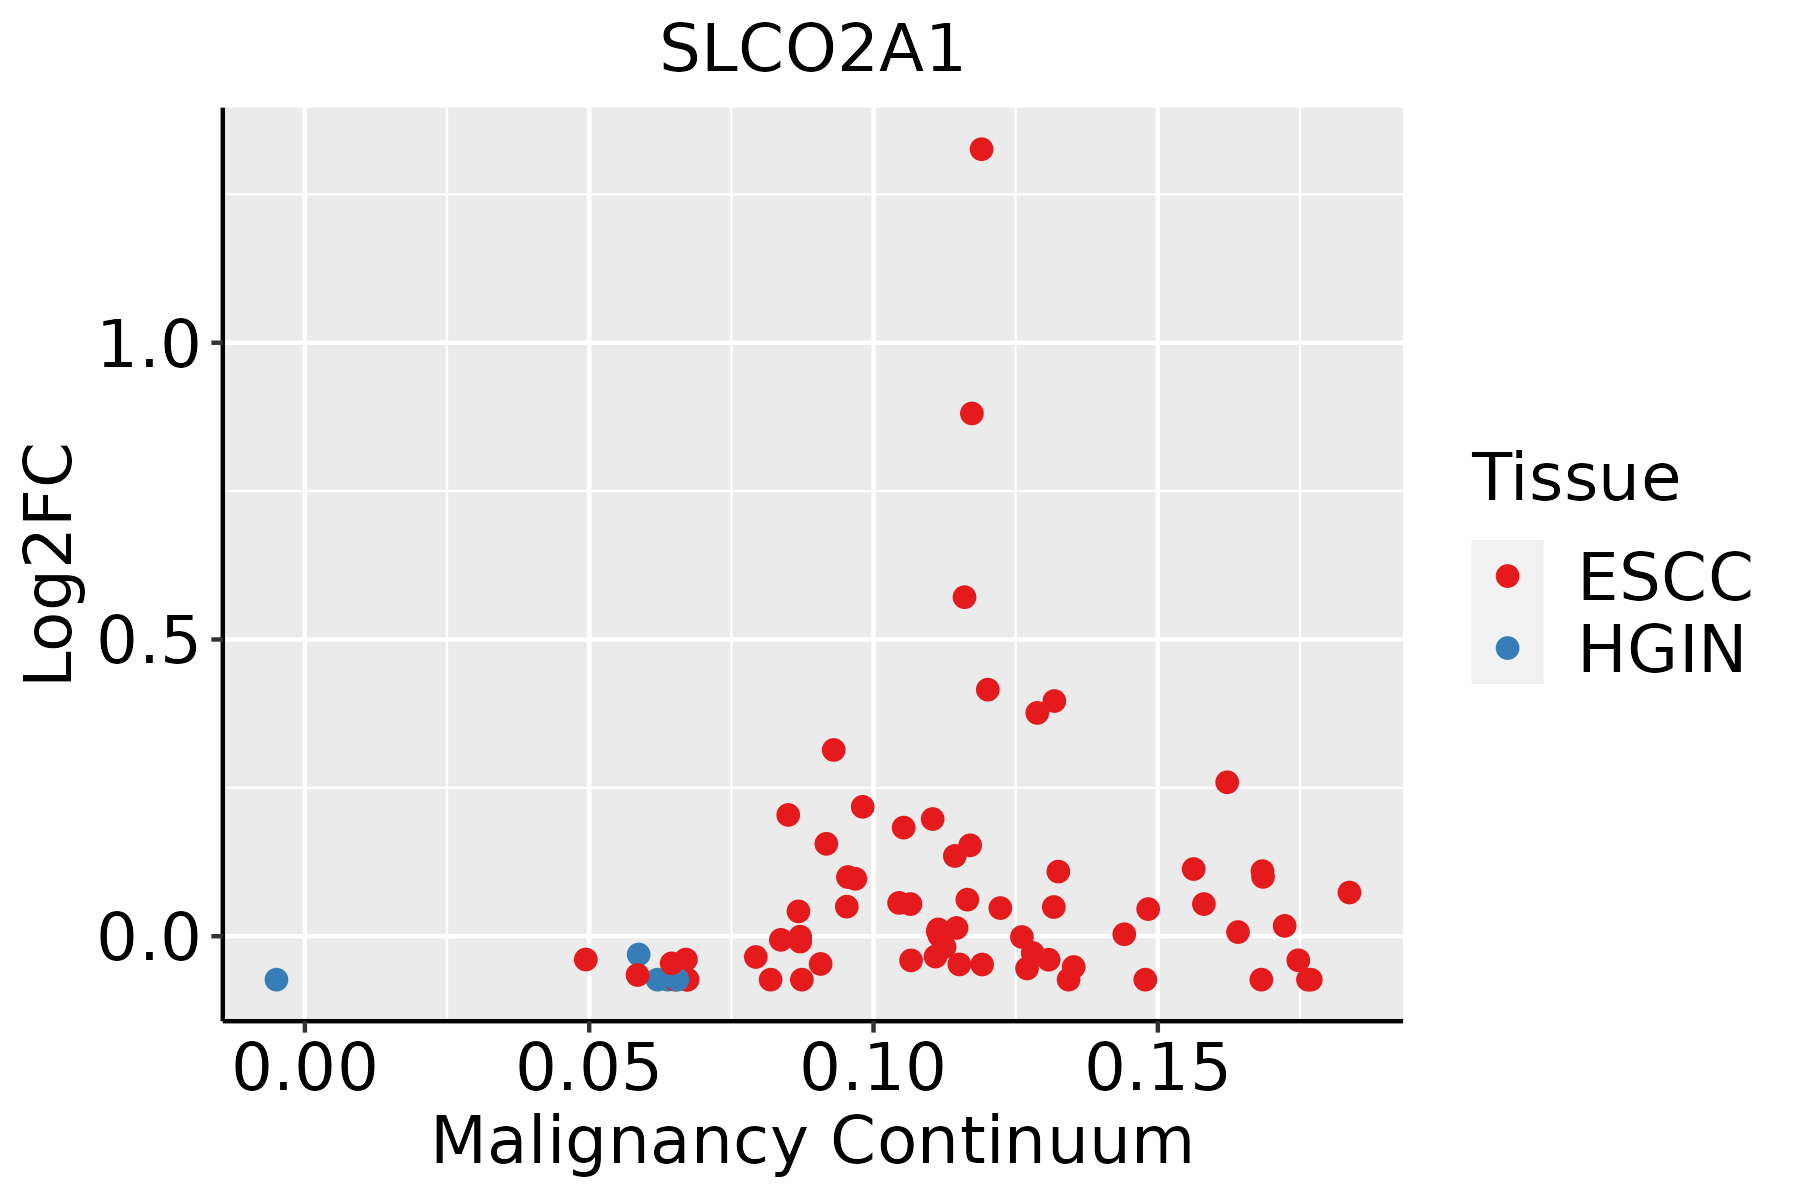 | ESCC: Esophageal squamous cell carcinoma |
| HGIN: High-grade intraepithelial neoplasias | ||
| LGIN: Low-grade intraepithelial neoplasias | ||
| Oral Cavity |  | EOLP: Erosive Oral lichen planus |
| LP: leukoplakia | ||
| NEOLP: Non-erosive oral lichen planus | ||
| OSCC: Oral squamous cell carcinoma |
| ∗log2FC in expression of this searched gene in stem-like cells from each diseased tissue sample relative to stem-like cells in normal samples in each tissue plotted against the malignancy continuum. Samples are colored based on if they are from different disease stage. |
Top |
Malignant transformation related pathway analysis |
| Find out the enriched GO biological processes and KEGG pathways involved in transition from healthy to precancer to cancer |
| Tissue | Disease Stage | Enriched GO biological Processes |
| Colorectum | AD |  |
| Colorectum | SER |  |
| Colorectum | MSS |  |
| Colorectum | MSI-H |  |
| Colorectum | FAP |  |
| ∗Top 15 enriched GO BP terms are showed in the bar plot of each disease state in each tissue. Each row represents a significant GO biological process which is colored according to the -log10(p.adjust). |
| Page: 1 2 3 4 5 6 7 8 9 |
| GO ID | Tissue | Disease Stage | Description | Gene Ratio | Bg Ratio | pvalue | p.adjust | Count |
| GO:0015732 | Colorectum | AD | prostaglandin transport | 10/3918 | 18/18723 | 1.31e-03 | 1.15e-02 | 10 |
| GO:0010876 | Colorectum | AD | lipid localization | 120/3918 | 448/18723 | 1.59e-03 | 1.33e-02 | 120 |
| GO:0006869 | Colorectum | AD | lipid transport | 108/3918 | 398/18723 | 1.67e-03 | 1.39e-02 | 108 |
| Page: 1 |
| Pathway ID | Tissue | Disease Stage | Description | Gene Ratio | Bg Ratio | pvalue | p.adjust | qvalue | Count |
| Page: 1 |
Top |
Cell-cell communication analysis |
| Identification of potential cell-cell interactions between two cell types and their ligand-receptor pairs for different disease states |
| Ligand | Receptor | LRpair | Pathway | Tissue | Disease Stage |
| Page: 1 |
Top |
Single-cell gene regulatory network inference analysis |
| Find out the significant the regulons (TFs) and the target genes of each regulon across cell types for different disease states |
| TF | Cell Type | Tissue | Disease Stage | Target Gene | RSS | Regulon Activity |
| ∗The dot plots of a searched regulon are shown for all cell subpopulations in each disease state of each tissue based on the regulon specific score inferred using pySCENIC and by calculating the average expression. |
| Page: 1 |
Top |
Somatic mutation of malignant transformation related genes |
| Annotation of somatic variants for genes involved in malignant transformation |
| Hugo Symbol | Variant Class | Variant Classification | dbSNP RS | HGVSc | HGVSp | HGVSp Short | SWISSPROT | BIOTYPE | SIFT | PolyPhen | Tumor Sample Barcode | Tissue | Histology | Sex | Age | Stage | Therapy Types | Drugs | Outcome |
| SLCO2A1 | SNV | Missense_Mutation | c.594N>A | p.Phe198Leu | p.F198L | Q92959 | protein_coding | deleterious(0) | probably_damaging(0.999) | TCGA-AN-A046-01 | Breast | breast invasive carcinoma | Female | >=65 | I/II | Unknown | Unknown | SD | |
| SLCO2A1 | SNV | Missense_Mutation | rs369396153 | c.1681N>T | p.Arg561Cys | p.R561C | Q92959 | protein_coding | deleterious(0) | probably_damaging(1) | TCGA-AN-A0AK-01 | Breast | breast invasive carcinoma | Female | >=65 | I/II | Unknown | Unknown | SD |
| SLCO2A1 | SNV | Missense_Mutation | novel | c.574N>G | p.Ile192Val | p.I192V | Q92959 | protein_coding | deleterious(0) | probably_damaging(0.914) | TCGA-AO-A128-01 | Breast | breast invasive carcinoma | Female | <65 | I/II | Chemotherapy | doxorubicin | SD |
| SLCO2A1 | SNV | Missense_Mutation | c.991N>C | p.Val331Leu | p.V331L | Q92959 | protein_coding | tolerated(0.48) | benign(0.014) | TCGA-B6-A0RE-01 | Breast | breast invasive carcinoma | Female | <65 | I/II | Unknown | Unknown | SD | |
| SLCO2A1 | SNV | Missense_Mutation | rs148547180 | c.421N>A | p.Glu141Lys | p.E141K | Q92959 | protein_coding | tolerated(0.08) | benign(0.011) | TCGA-B6-A0X0-01 | Breast | breast invasive carcinoma | Female | <65 | I/II | Unknown | Unknown | SD |
| SLCO2A1 | SNV | Missense_Mutation | c.1511N>T | p.Thr504Ile | p.T504I | Q92959 | protein_coding | deleterious(0.01) | benign(0.309) | TCGA-BH-A0HF-01 | Breast | breast invasive carcinoma | Female | >=65 | I/II | Hormone Therapy | arimidex | SD | |
| SLCO2A1 | SNV | Missense_Mutation | c.1334N>C | p.Arg445Pro | p.R445P | Q92959 | protein_coding | tolerated(0.24) | benign(0.012) | TCGA-C8-A12P-01 | Breast | breast invasive carcinoma | Female | <65 | I/II | Unknown | Unknown | SD | |
| SLCO2A1 | SNV | Missense_Mutation | novel | c.865G>C | p.Ala289Pro | p.A289P | Q92959 | protein_coding | tolerated(0.27) | benign(0.364) | TCGA-E2-A1L8-01 | Breast | breast invasive carcinoma | Female | <65 | I/II | Chemotherapy | cyclophosphamide | SD |
| SLCO2A1 | SNV | Missense_Mutation | rs759989525 | c.1195N>T | p.Arg399Cys | p.R399C | Q92959 | protein_coding | tolerated(0.08) | probably_damaging(1) | TCGA-E9-A228-01 | Breast | breast invasive carcinoma | Female | <65 | I/II | Chemotherapy | doxorubicin | SD |
| SLCO2A1 | SNV | Missense_Mutation | rs762008407 | c.1798N>A | p.Asp600Asn | p.D600N | Q92959 | protein_coding | tolerated(0.29) | benign(0.034) | TCGA-GM-A2DO-01 | Breast | breast invasive carcinoma | Female | <65 | I/II | Hormone Therapy | tamoxiphen | CR |
| Page: 1 2 3 4 5 6 7 8 9 10 11 |
Top |
Related drugs of malignant transformation related genes |
| Identification of chemicals and drugs interact with genes involved in malignant transfromation |
| (DGIdb 4.0) |
| Entrez ID | Symbol | Category | Interaction Types | Drug Claim Name | Drug Name | PMIDs |
| 6578 | SLCO2A1 | TRANSPORTER, DRUGGABLE GENOME | Thiazides, plain | 28783044 | ||
| 6578 | SLCO2A1 | TRANSPORTER, DRUGGABLE GENOME | PMID26099857-Compound-WO2011037610Formula(I) | |||
| 6578 | SLCO2A1 | TRANSPORTER, DRUGGABLE GENOME | 135651569 |
| Page: 1 |

Copyright 2023-Present -The University of Texas Health Science Center at Houston |