
|
|||||
|
 | |
| |
| |
| |
| |
| |
|
Gene: SLC9B2 |
Gene summary for SLC9B2 |
| Gene information | Species | Human | Gene symbol | SLC9B2 | Gene ID | 133308 |
| Gene name | solute carrier family 9 member B2 | |
| Gene Alias | NHA2 | |
| Cytomap | 4q24 | |
| Gene Type | protein-coding | GO ID | GO:0000003 | UniProtAcc | B7Z488 |
Top |
Malignant transformation analysis |
| Identification of the aberrant gene expression in precancerous and cancerous lesions by comparing the gene expression of stem-like cells in diseased tissues with normal stem cells |
| Entrez ID | Symbol | Replicates | Species | Organ | Tissue | Adj P-value | Log2FC | Malignancy |
| 133308 | SLC9B2 | P2T-E | Human | Esophagus | ESCC | 8.07e-09 | 1.55e-01 | 0.1177 |
| 133308 | SLC9B2 | P4T-E | Human | Esophagus | ESCC | 7.77e-10 | 2.58e-01 | 0.1323 |
| 133308 | SLC9B2 | P5T-E | Human | Esophagus | ESCC | 4.10e-05 | 4.76e-02 | 0.1327 |
| 133308 | SLC9B2 | P8T-E | Human | Esophagus | ESCC | 1.47e-02 | 3.94e-02 | 0.0889 |
| 133308 | SLC9B2 | P10T-E | Human | Esophagus | ESCC | 3.02e-02 | 3.68e-02 | 0.116 |
| 133308 | SLC9B2 | P11T-E | Human | Esophagus | ESCC | 2.84e-02 | 1.01e-01 | 0.1426 |
| 133308 | SLC9B2 | P12T-E | Human | Esophagus | ESCC | 6.63e-04 | 1.16e-01 | 0.1122 |
| 133308 | SLC9B2 | P16T-E | Human | Esophagus | ESCC | 3.74e-07 | 9.98e-02 | 0.1153 |
| 133308 | SLC9B2 | P20T-E | Human | Esophagus | ESCC | 9.30e-06 | 1.32e-01 | 0.1124 |
| 133308 | SLC9B2 | P22T-E | Human | Esophagus | ESCC | 1.05e-08 | 1.52e-01 | 0.1236 |
| 133308 | SLC9B2 | P26T-E | Human | Esophagus | ESCC | 3.53e-08 | 2.12e-01 | 0.1276 |
| 133308 | SLC9B2 | P27T-E | Human | Esophagus | ESCC | 2.33e-04 | 7.61e-02 | 0.1055 |
| 133308 | SLC9B2 | P28T-E | Human | Esophagus | ESCC | 2.79e-23 | 5.70e-01 | 0.1149 |
| 133308 | SLC9B2 | P30T-E | Human | Esophagus | ESCC | 4.84e-12 | 6.53e-01 | 0.137 |
| 133308 | SLC9B2 | P32T-E | Human | Esophagus | ESCC | 7.15e-04 | 1.27e-01 | 0.1666 |
| 133308 | SLC9B2 | P36T-E | Human | Esophagus | ESCC | 5.03e-05 | 1.33e-01 | 0.1187 |
| 133308 | SLC9B2 | P37T-E | Human | Esophagus | ESCC | 1.13e-02 | 8.79e-02 | 0.1371 |
| 133308 | SLC9B2 | P48T-E | Human | Esophagus | ESCC | 7.01e-03 | 8.63e-02 | 0.0959 |
| 133308 | SLC9B2 | P52T-E | Human | Esophagus | ESCC | 7.89e-11 | 2.85e-01 | 0.1555 |
| 133308 | SLC9B2 | P56T-E | Human | Esophagus | ESCC | 1.44e-03 | 2.87e-01 | 0.1613 |
| Page: 1 2 |
| Tissue | Expression Dynamics | Abbreviation |
| Esophagus | 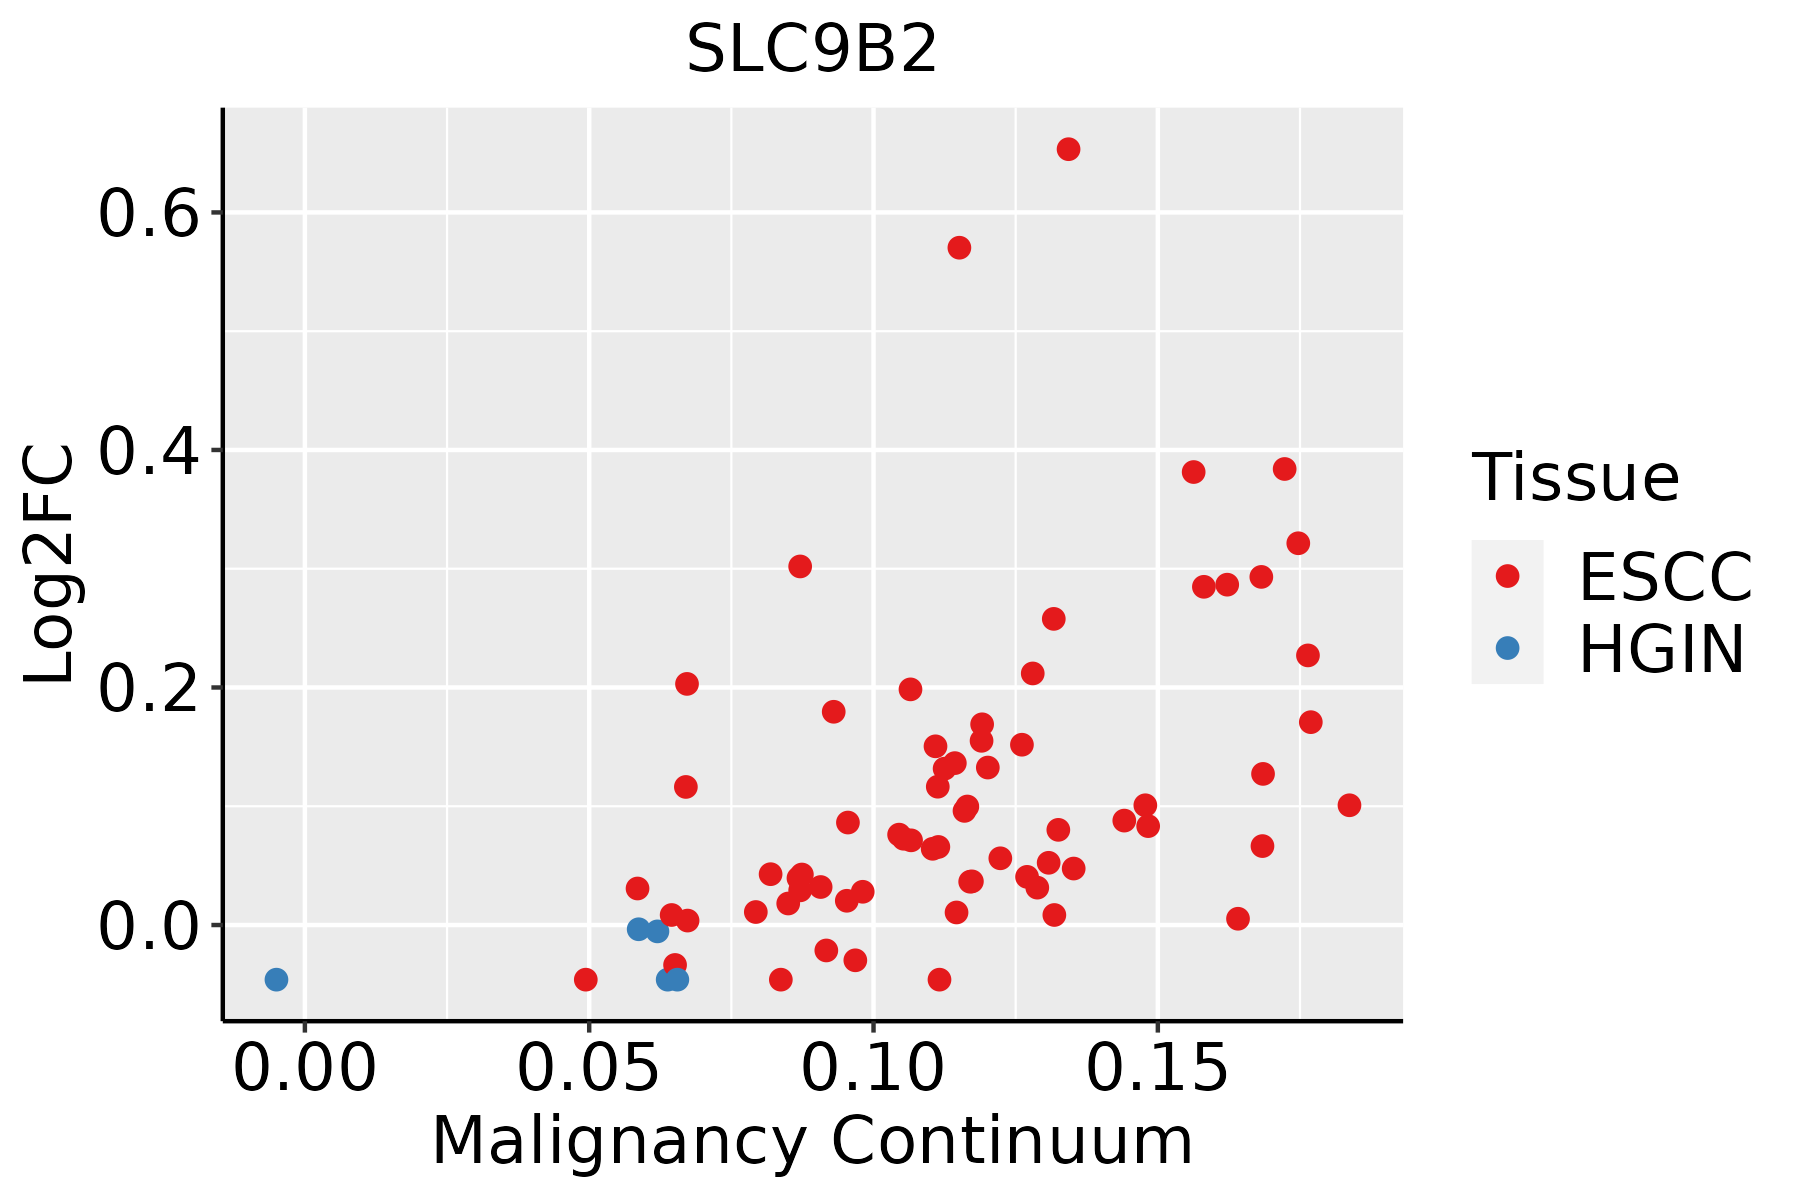 | ESCC: Esophageal squamous cell carcinoma |
| HGIN: High-grade intraepithelial neoplasias | ||
| LGIN: Low-grade intraepithelial neoplasias | ||
| Liver | 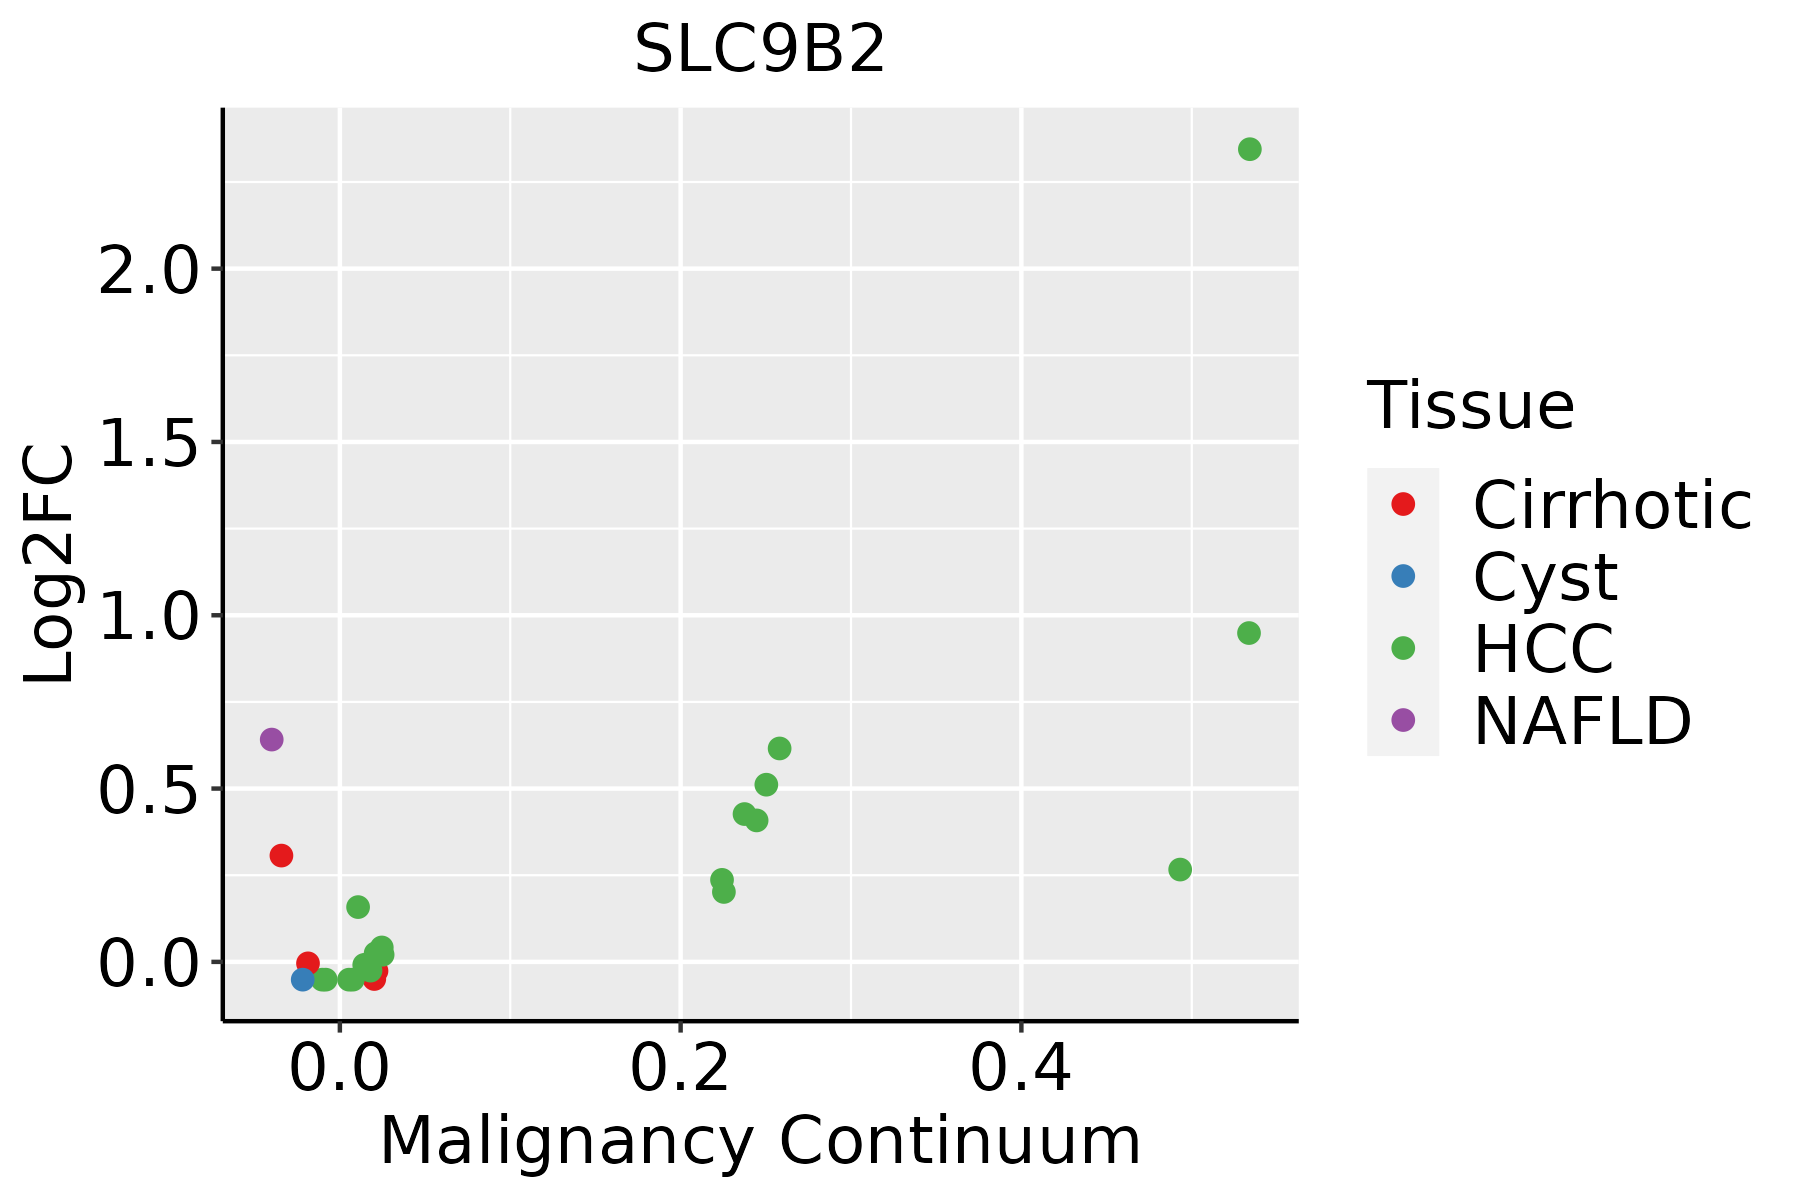 | HCC: Hepatocellular carcinoma |
| NAFLD: Non-alcoholic fatty liver disease |
| ∗log2FC in expression of this searched gene in stem-like cells from each diseased tissue sample relative to stem-like cells in normal samples in each tissue plotted against the malignancy continuum. Samples are colored based on if they are from different disease stage. |
Top |
Malignant transformation related pathway analysis |
| Find out the enriched GO biological processes and KEGG pathways involved in transition from healthy to precancer to cancer |
| Tissue | Disease Stage | Enriched GO biological Processes |
| Colorectum | AD |  |
| Colorectum | SER |  |
| Colorectum | MSS |  |
| Colorectum | MSI-H |  |
| Colorectum | FAP |  |
| ∗Top 15 enriched GO BP terms are showed in the bar plot of each disease state in each tissue. Each row represents a significant GO biological process which is colored according to the -log10(p.adjust). |
| Page: 1 2 3 4 5 6 7 8 9 |
| GO ID | Tissue | Disease Stage | Description | Gene Ratio | Bg Ratio | pvalue | p.adjust | Count |
| GO:0030099111 | Esophagus | ESCC | myeloid cell differentiation | 232/8552 | 381/18723 | 1.22e-09 | 2.90e-08 | 232 |
| GO:000257317 | Esophagus | ESCC | myeloid leukocyte differentiation | 128/8552 | 208/18723 | 2.75e-06 | 3.15e-05 | 128 |
| GO:001072010 | Esophagus | ESCC | positive regulation of cell development | 172/8552 | 298/18723 | 1.74e-05 | 1.55e-04 | 172 |
| GO:000689818 | Esophagus | ESCC | receptor-mediated endocytosis | 142/8552 | 244/18723 | 5.22e-05 | 4.05e-04 | 142 |
| GO:007258314 | Esophagus | ESCC | clathrin-dependent endocytosis | 34/8552 | 47/18723 | 1.91e-04 | 1.21e-03 | 34 |
| GO:1903706110 | Esophagus | ESCC | regulation of hemopoiesis | 201/8552 | 367/18723 | 2.60e-04 | 1.58e-03 | 201 |
| GO:19021076 | Esophagus | ESCC | positive regulation of leukocyte differentiation | 93/8552 | 157/18723 | 4.20e-04 | 2.39e-03 | 93 |
| GO:19037086 | Esophagus | ESCC | positive regulation of hemopoiesis | 93/8552 | 157/18723 | 4.20e-04 | 2.39e-03 | 93 |
| GO:004563918 | Esophagus | ESCC | positive regulation of myeloid cell differentiation | 64/8552 | 103/18723 | 5.54e-04 | 3.03e-03 | 64 |
| GO:0045637111 | Esophagus | ESCC | regulation of myeloid cell differentiation | 118/8552 | 210/18723 | 1.35e-03 | 6.43e-03 | 118 |
| GO:00603485 | Esophagus | ESCC | bone development | 115/8552 | 205/18723 | 1.67e-03 | 7.72e-03 | 115 |
| GO:190210510 | Esophagus | ESCC | regulation of leukocyte differentiation | 152/8552 | 279/18723 | 1.82e-03 | 8.35e-03 | 152 |
| GO:000930617 | Esophagus | ESCC | protein secretion | 190/8552 | 359/18723 | 3.22e-03 | 1.34e-02 | 190 |
| GO:003559217 | Esophagus | ESCC | establishment of protein localization to extracellular region | 190/8552 | 360/18723 | 3.77e-03 | 1.53e-02 | 190 |
| GO:000276311 | Esophagus | ESCC | positive regulation of myeloid leukocyte differentiation | 37/8552 | 58/18723 | 4.12e-03 | 1.64e-02 | 37 |
| GO:007169210 | Esophagus | ESCC | protein localization to extracellular region | 193/8552 | 368/18723 | 5.01e-03 | 1.92e-02 | 193 |
| GO:190260018 | Esophagus | ESCC | proton transmembrane transport | 88/8552 | 157/18723 | 5.62e-03 | 2.10e-02 | 88 |
| GO:000276115 | Esophagus | ESCC | regulation of myeloid leukocyte differentiation | 69/8552 | 120/18723 | 6.00e-03 | 2.21e-02 | 69 |
| GO:0009743111 | Esophagus | ESCC | response to carbohydrate | 135/8552 | 253/18723 | 8.16e-03 | 2.89e-02 | 135 |
| GO:005070810 | Esophagus | ESCC | regulation of protein secretion | 142/8552 | 268/18723 | 9.31e-03 | 3.24e-02 | 142 |
| Page: 1 2 3 |
| Pathway ID | Tissue | Disease Stage | Description | Gene Ratio | Bg Ratio | pvalue | p.adjust | qvalue | Count |
| Page: 1 |
Top |
Cell-cell communication analysis |
| Identification of potential cell-cell interactions between two cell types and their ligand-receptor pairs for different disease states |
| Ligand | Receptor | LRpair | Pathway | Tissue | Disease Stage |
| Page: 1 |
Top |
Single-cell gene regulatory network inference analysis |
| Find out the significant the regulons (TFs) and the target genes of each regulon across cell types for different disease states |
| TF | Cell Type | Tissue | Disease Stage | Target Gene | RSS | Regulon Activity |
| ∗The dot plots of a searched regulon are shown for all cell subpopulations in each disease state of each tissue based on the regulon specific score inferred using pySCENIC and by calculating the average expression. |
| Page: 1 |
Top |
Somatic mutation of malignant transformation related genes |
| Annotation of somatic variants for genes involved in malignant transformation |
| Hugo Symbol | Variant Class | Variant Classification | dbSNP RS | HGVSc | HGVSp | HGVSp Short | SWISSPROT | BIOTYPE | SIFT | PolyPhen | Tumor Sample Barcode | Tissue | Histology | Sex | Age | Stage | Therapy Types | Drugs | Outcome |
| SLC9B2 | insertion | Frame_Shift_Ins | novel | c.488_489insGGCCTCCCAAGTAGGTGGGATTACAGACATGC | p.Asn163LysfsTer25 | p.N163Kfs*25 | Q86UD5 | protein_coding | TCGA-A2-A04T-01 | Breast | breast invasive carcinoma | Female | <65 | I/II | Chemotherapy | cyclophosphamide | SD | ||
| SLC9B2 | insertion | Nonsense_Mutation | novel | c.630_631insGACATATTTGCTTGATAATTGATTAAGGCAAATTAAA | p.Pro211AspfsTer5 | p.P211Dfs*5 | Q86UD5 | protein_coding | TCGA-A8-A07U-01 | Breast | breast invasive carcinoma | Female | >=65 | III/IV | Chemotherapy | 5-fluorouracil | SD | ||
| SLC9B2 | insertion | Frame_Shift_Ins | novel | c.1321_1322insCCCAGTACTTTGGGAGGCTAAGGTGGGTGGATCACCTGAG | p.Cys441SerfsTer19 | p.C441Sfs*19 | Q86UD5 | protein_coding | TCGA-AO-A0J9-01 | Breast | breast invasive carcinoma | Female | <65 | III/IV | Chemotherapy | cyclophosphamide | PD | ||
| SLC9B2 | SNV | Missense_Mutation | rs753736568 | c.623C>T | p.Ser208Phe | p.S208F | Q86UD5 | protein_coding | deleterious(0.01) | possibly_damaging(0.828) | TCGA-2W-A8YY-01 | Cervix | cervical & endocervical cancer | Female | <65 | I/II | Chemotherapy | cisplatin | CR |
| SLC9B2 | SNV | Missense_Mutation | c.338G>A | p.Gly113Glu | p.G113E | Q86UD5 | protein_coding | deleterious(0.01) | probably_damaging(0.999) | TCGA-DS-A0VM-01 | Cervix | cervical & endocervical cancer | Female | <65 | I/II | Chemotherapy | cisplatin | PD | |
| SLC9B2 | SNV | Missense_Mutation | c.121N>C | p.Asp41His | p.D41H | Q86UD5 | protein_coding | deleterious(0) | possibly_damaging(0.579) | TCGA-IR-A3LA-01 | Cervix | cervical & endocervical cancer | Female | <65 | I/II | Chemotherapy | cisplatin | CR | |
| SLC9B2 | SNV | Missense_Mutation | novel | c.79N>A | p.Gln27Lys | p.Q27K | Q86UD5 | protein_coding | tolerated(0.27) | benign(0.003) | TCGA-VS-A8Q8-01 | Cervix | cervical & endocervical cancer | Female | <65 | I/II | Unknown | Unknown | PD |
| SLC9B2 | SNV | Missense_Mutation | c.98N>T | p.Thr33Ile | p.T33I | Q86UD5 | protein_coding | tolerated(0.2) | benign(0.011) | TCGA-AA-A022-01 | Colorectum | colon adenocarcinoma | Female | >=65 | I/II | Unknown | Unknown | SD | |
| SLC9B2 | SNV | Missense_Mutation | c.151C>A | p.Leu51Ile | p.L51I | Q86UD5 | protein_coding | tolerated(0.09) | benign(0.041) | TCGA-CA-6718-01 | Colorectum | colon adenocarcinoma | Male | <65 | I/II | Unknown | Unknown | PD | |
| SLC9B2 | SNV | Missense_Mutation | c.1019N>T | p.Thr340Ile | p.T340I | Q86UD5 | protein_coding | tolerated(0.09) | benign(0.162) | TCGA-D5-6927-01 | Colorectum | colon adenocarcinoma | Male | <65 | I/II | Unknown | Unknown | SD |
| Page: 1 2 3 4 5 6 |
Top |
Related drugs of malignant transformation related genes |
| Identification of chemicals and drugs interact with genes involved in malignant transfromation |
| (DGIdb 4.0) |
| Entrez ID | Symbol | Category | Interaction Types | Drug Claim Name | Drug Name | PMIDs |
| Page: 1 |

Copyright 2023-Present -The University of Texas Health Science Center at Houston |