
|
|||||
|
 | |
| |
| |
| |
| |
| |
|
Gene: SLC9A9 |
Gene summary for SLC9A9 |
| Gene information | Species | Human | Gene symbol | SLC9A9 | Gene ID | 285195 |
| Gene name | solute carrier family 9 member A9 | |
| Gene Alias | AUTS16 | |
| Cytomap | 3q24 | |
| Gene Type | protein-coding | GO ID | GO:0006810 | UniProtAcc | Q8IVB4 |
Top |
Malignant transformation analysis |
| Identification of the aberrant gene expression in precancerous and cancerous lesions by comparing the gene expression of stem-like cells in diseased tissues with normal stem cells |
| Entrez ID | Symbol | Replicates | Species | Organ | Tissue | Adj P-value | Log2FC | Malignancy |
| 285195 | SLC9A9 | LZE4T | Human | Esophagus | ESCC | 7.59e-15 | 4.95e-01 | 0.0811 |
| 285195 | SLC9A9 | P2T-E | Human | Esophagus | ESCC | 3.22e-06 | 2.55e-02 | 0.1177 |
| 285195 | SLC9A9 | P4T-E | Human | Esophagus | ESCC | 1.07e-07 | 2.71e-01 | 0.1323 |
| 285195 | SLC9A9 | P8T-E | Human | Esophagus | ESCC | 4.23e-13 | 7.72e-02 | 0.0889 |
| 285195 | SLC9A9 | P9T-E | Human | Esophagus | ESCC | 1.86e-13 | 3.33e-01 | 0.1131 |
| 285195 | SLC9A9 | P10T-E | Human | Esophagus | ESCC | 1.31e-23 | 3.68e-01 | 0.116 |
| 285195 | SLC9A9 | P11T-E | Human | Esophagus | ESCC | 2.13e-02 | 9.54e-02 | 0.1426 |
| 285195 | SLC9A9 | P12T-E | Human | Esophagus | ESCC | 1.23e-15 | 4.47e-01 | 0.1122 |
| 285195 | SLC9A9 | P15T-E | Human | Esophagus | ESCC | 6.37e-12 | 3.30e-01 | 0.1149 |
| 285195 | SLC9A9 | P22T-E | Human | Esophagus | ESCC | 6.05e-16 | 3.31e-01 | 0.1236 |
| 285195 | SLC9A9 | P23T-E | Human | Esophagus | ESCC | 6.56e-04 | 1.34e-01 | 0.108 |
| 285195 | SLC9A9 | P26T-E | Human | Esophagus | ESCC | 6.37e-25 | 4.40e-01 | 0.1276 |
| 285195 | SLC9A9 | P27T-E | Human | Esophagus | ESCC | 1.95e-16 | 3.77e-01 | 0.1055 |
| 285195 | SLC9A9 | P28T-E | Human | Esophagus | ESCC | 2.21e-19 | 5.02e-01 | 0.1149 |
| 285195 | SLC9A9 | P30T-E | Human | Esophagus | ESCC | 8.82e-27 | 1.19e+00 | 0.137 |
| 285195 | SLC9A9 | P32T-E | Human | Esophagus | ESCC | 8.71e-08 | 5.58e-02 | 0.1666 |
| 285195 | SLC9A9 | P42T-E | Human | Esophagus | ESCC | 2.55e-08 | 2.76e-01 | 0.1175 |
| 285195 | SLC9A9 | P47T-E | Human | Esophagus | ESCC | 7.60e-08 | 6.87e-02 | 0.1067 |
| 285195 | SLC9A9 | P48T-E | Human | Esophagus | ESCC | 7.40e-05 | 1.19e-01 | 0.0959 |
| 285195 | SLC9A9 | P52T-E | Human | Esophagus | ESCC | 2.83e-20 | 2.99e-01 | 0.1555 |
| Page: 1 2 3 |
| Tissue | Expression Dynamics | Abbreviation |
| Esophagus |  | ESCC: Esophageal squamous cell carcinoma |
| HGIN: High-grade intraepithelial neoplasias | ||
| LGIN: Low-grade intraepithelial neoplasias | ||
| Oral Cavity | 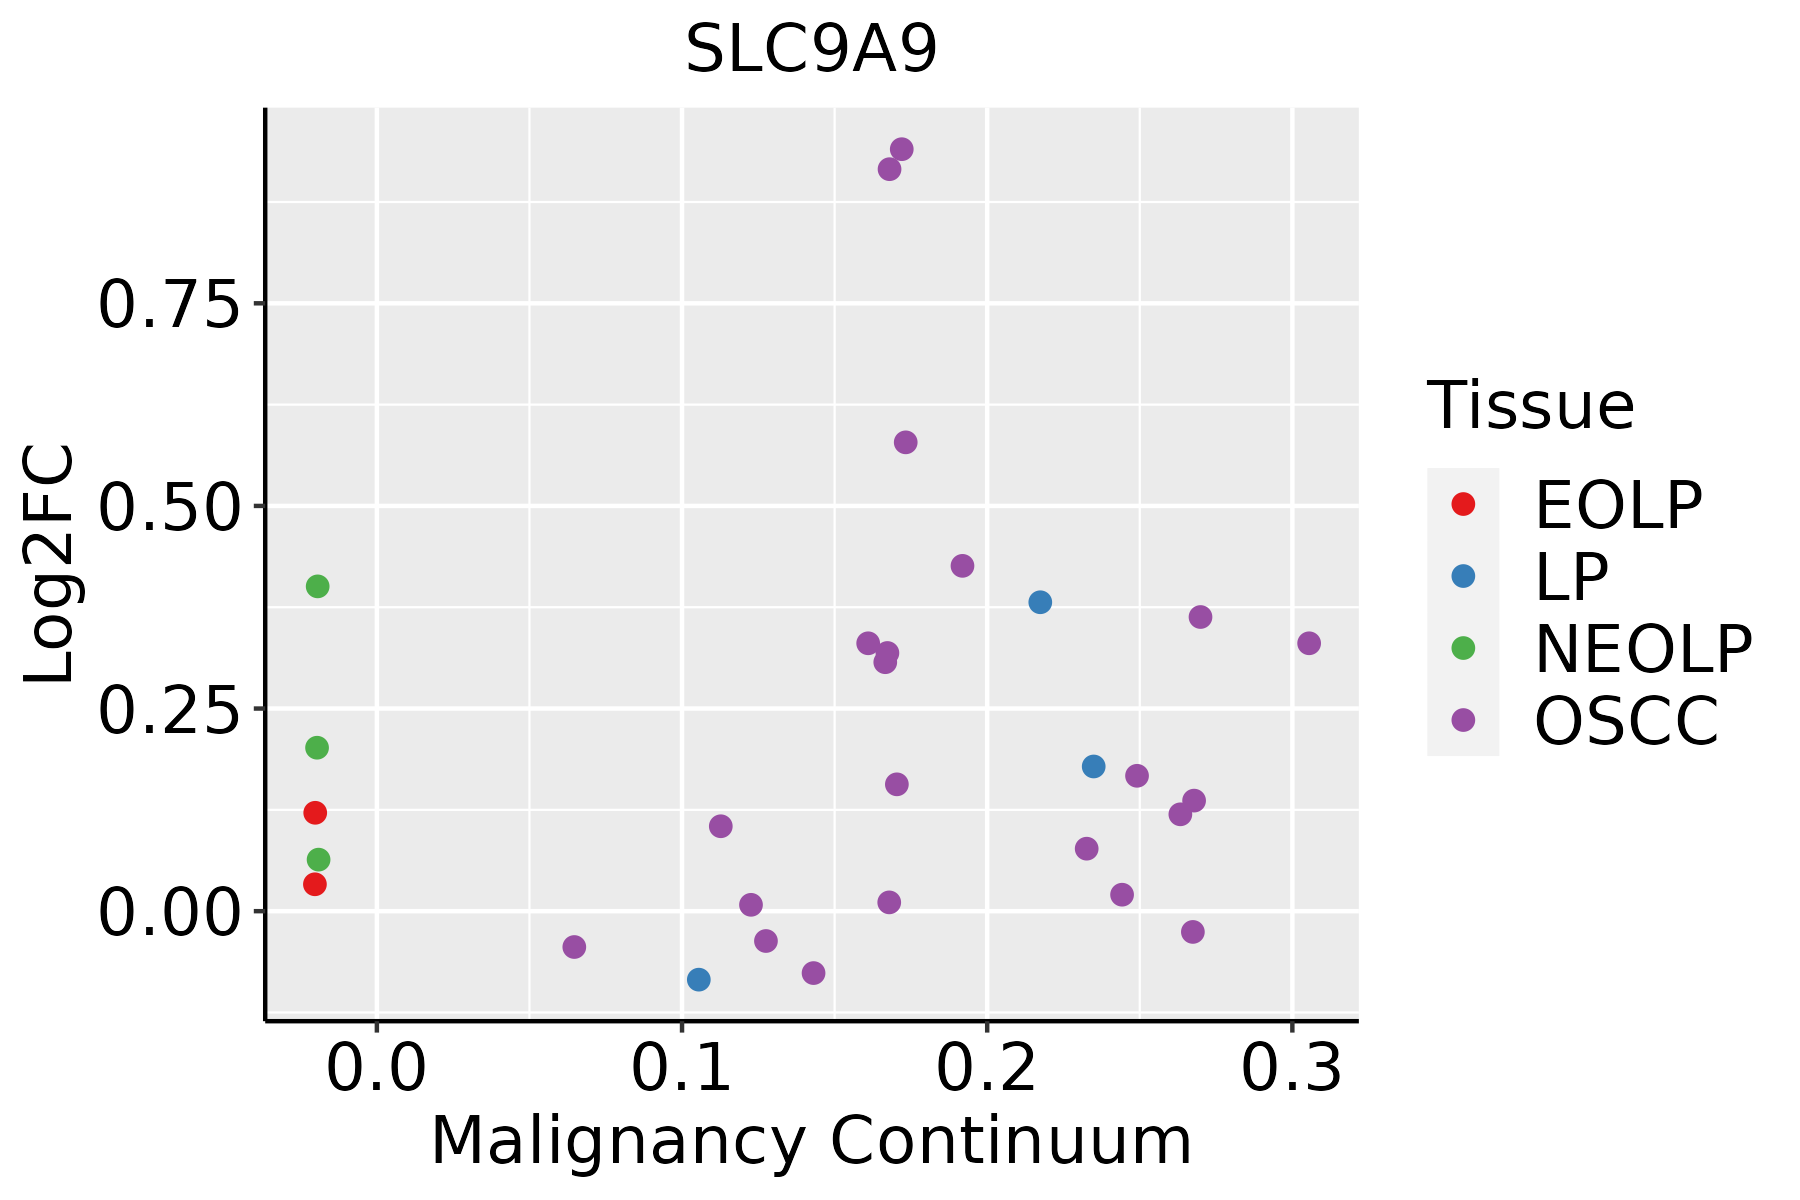 | EOLP: Erosive Oral lichen planus |
| LP: leukoplakia | ||
| NEOLP: Non-erosive oral lichen planus | ||
| OSCC: Oral squamous cell carcinoma |
| ∗log2FC in expression of this searched gene in stem-like cells from each diseased tissue sample relative to stem-like cells in normal samples in each tissue plotted against the malignancy continuum. Samples are colored based on if they are from different disease stage. |
Top |
Malignant transformation related pathway analysis |
| Find out the enriched GO biological processes and KEGG pathways involved in transition from healthy to precancer to cancer |
| Tissue | Disease Stage | Enriched GO biological Processes |
| Colorectum | AD |  |
| Colorectum | SER |  |
| Colorectum | MSS |  |
| Colorectum | MSI-H |  |
| Colorectum | FAP |  |
| ∗Top 15 enriched GO BP terms are showed in the bar plot of each disease state in each tissue. Each row represents a significant GO biological process which is colored according to the -log10(p.adjust). |
| Page: 1 2 3 4 5 6 7 8 9 |
| GO ID | Tissue | Disease Stage | Description | Gene Ratio | Bg Ratio | pvalue | p.adjust | Count |
| GO:190260018 | Esophagus | ESCC | proton transmembrane transport | 88/8552 | 157/18723 | 5.62e-03 | 2.10e-02 | 88 |
| Page: 1 |
| Pathway ID | Tissue | Disease Stage | Description | Gene Ratio | Bg Ratio | pvalue | p.adjust | qvalue | Count |
| Page: 1 |
Top |
Cell-cell communication analysis |
| Identification of potential cell-cell interactions between two cell types and their ligand-receptor pairs for different disease states |
| Ligand | Receptor | LRpair | Pathway | Tissue | Disease Stage |
| Page: 1 |
Top |
Single-cell gene regulatory network inference analysis |
| Find out the significant the regulons (TFs) and the target genes of each regulon across cell types for different disease states |
| TF | Cell Type | Tissue | Disease Stage | Target Gene | RSS | Regulon Activity |
| ∗The dot plots of a searched regulon are shown for all cell subpopulations in each disease state of each tissue based on the regulon specific score inferred using pySCENIC and by calculating the average expression. |
| Page: 1 |
Top |
Somatic mutation of malignant transformation related genes |
| Annotation of somatic variants for genes involved in malignant transformation |
| Hugo Symbol | Variant Class | Variant Classification | dbSNP RS | HGVSc | HGVSp | HGVSp Short | SWISSPROT | BIOTYPE | SIFT | PolyPhen | Tumor Sample Barcode | Tissue | Histology | Sex | Age | Stage | Therapy Types | Drugs | Outcome |
| SLC9A9 | SNV | Missense_Mutation | rs61734409 | c.1378A>G | p.Met460Val | p.M460V | Q8IVB4 | protein_coding | tolerated(0.09) | probably_damaging(0.949) | TCGA-A8-A09Z-01 | Breast | breast invasive carcinoma | Female | >=65 | I/II | Unknown | Unknown | SD |
| SLC9A9 | SNV | Missense_Mutation | rs775325802 | c.926N>T | p.Pro309Leu | p.P309L | Q8IVB4 | protein_coding | deleterious(0) | probably_damaging(0.999) | TCGA-AN-A046-01 | Breast | breast invasive carcinoma | Female | >=65 | I/II | Unknown | Unknown | SD |
| SLC9A9 | SNV | Missense_Mutation | c.717G>C | p.Glu239Asp | p.E239D | Q8IVB4 | protein_coding | deleterious(0) | probably_damaging(0.992) | TCGA-AQ-A0Y5-01 | Breast | breast invasive carcinoma | Female | >=65 | III/IV | Chemotherapy | cytoxan | SD | |
| SLC9A9 | SNV | Missense_Mutation | c.133C>G | p.Arg45Gly | p.R45G | Q8IVB4 | protein_coding | deleterious(0) | probably_damaging(0.995) | TCGA-BH-A0H5-01 | Breast | breast invasive carcinoma | Female | <65 | I/II | Chemotherapy | cytoxan | CR | |
| SLC9A9 | deletion | Frame_Shift_Del | novel | c.985delN | p.Ala329LeufsTer4 | p.A329Lfs*4 | Q8IVB4 | protein_coding | TCGA-EW-A2FV-01 | Breast | breast invasive carcinoma | Female | <65 | III/IV | Chemotherapy | docetaxel | SD | ||
| SLC9A9 | SNV | Missense_Mutation | rs761080781 | c.1115C>T | p.Ala372Val | p.A372V | Q8IVB4 | protein_coding | deleterious(0) | probably_damaging(0.996) | TCGA-2W-A8YY-01 | Cervix | cervical & endocervical cancer | Female | <65 | I/II | Chemotherapy | cisplatin | CR |
| SLC9A9 | SNV | Missense_Mutation | novel | c.97C>T | p.Leu33Phe | p.L33F | Q8IVB4 | protein_coding | deleterious(0.04) | probably_damaging(0.998) | TCGA-2W-A8YY-01 | Cervix | cervical & endocervical cancer | Female | <65 | I/II | Chemotherapy | cisplatin | CR |
| SLC9A9 | SNV | Missense_Mutation | c.1079N>C | p.Arg360Thr | p.R360T | Q8IVB4 | protein_coding | deleterious(0) | probably_damaging(0.991) | TCGA-EK-A3GK-01 | Cervix | cervical & endocervical cancer | Female | <65 | I/II | Unknown | Unknown | SD | |
| SLC9A9 | SNV | Missense_Mutation | c.433N>G | p.His145Asp | p.H145D | Q8IVB4 | protein_coding | deleterious(0.01) | probably_damaging(0.991) | TCGA-JW-A5VL-01 | Cervix | cervical & endocervical cancer | Female | <65 | I/II | Unknown | Unknown | SD | |
| SLC9A9 | SNV | Missense_Mutation | c.1561N>C | p.Glu521Gln | p.E521Q | Q8IVB4 | protein_coding | deleterious(0.02) | benign(0.214) | TCGA-Q1-A5R2-01 | Cervix | cervical & endocervical cancer | Female | <65 | I/II | Chemotherapy | cisplatin | PR |
| Page: 1 2 3 4 5 6 7 8 9 10 11 |
Top |
Related drugs of malignant transformation related genes |
| Identification of chemicals and drugs interact with genes involved in malignant transfromation |
| (DGIdb 4.0) |
| Entrez ID | Symbol | Category | Interaction Types | Drug Claim Name | Drug Name | PMIDs |
| Page: 1 |

Copyright 2023-Present -The University of Texas Health Science Center at Houston |