
|
|||||
|
 | |
| |
| |
| |
| |
| |
|
Gene: SLC9A7 |
Gene summary for SLC9A7 |
| Gene information | Species | Human | Gene symbol | SLC9A7 | Gene ID | 84679 |
| Gene name | solute carrier family 9 member A7 | |
| Gene Alias | MRX108 | |
| Cytomap | Xp11.3 | |
| Gene Type | protein-coding | GO ID | GO:0006810 | UniProtAcc | A0A087WXD1 |
Top |
Malignant transformation analysis |
| Identification of the aberrant gene expression in precancerous and cancerous lesions by comparing the gene expression of stem-like cells in diseased tissues with normal stem cells |
| Entrez ID | Symbol | Replicates | Species | Organ | Tissue | Adj P-value | Log2FC | Malignancy |
| 84679 | SLC9A7 | HCC1_Meng | Human | Liver | HCC | 3.82e-34 | 3.88e-02 | 0.0246 |
| 84679 | SLC9A7 | HCC2_Meng | Human | Liver | HCC | 1.20e-02 | 2.54e-02 | 0.0107 |
| 84679 | SLC9A7 | HCC1 | Human | Liver | HCC | 1.15e-18 | 4.59e+00 | 0.5336 |
| 84679 | SLC9A7 | HCC2 | Human | Liver | HCC | 1.65e-09 | 2.50e+00 | 0.5341 |
| 84679 | SLC9A7 | S027 | Human | Liver | HCC | 1.21e-11 | 7.46e-01 | 0.2446 |
| 84679 | SLC9A7 | S028 | Human | Liver | HCC | 2.35e-23 | 6.84e-01 | 0.2503 |
| 84679 | SLC9A7 | S029 | Human | Liver | HCC | 4.47e-18 | 6.47e-01 | 0.2581 |
| Page: 1 |
| Tissue | Expression Dynamics | Abbreviation |
| Liver | 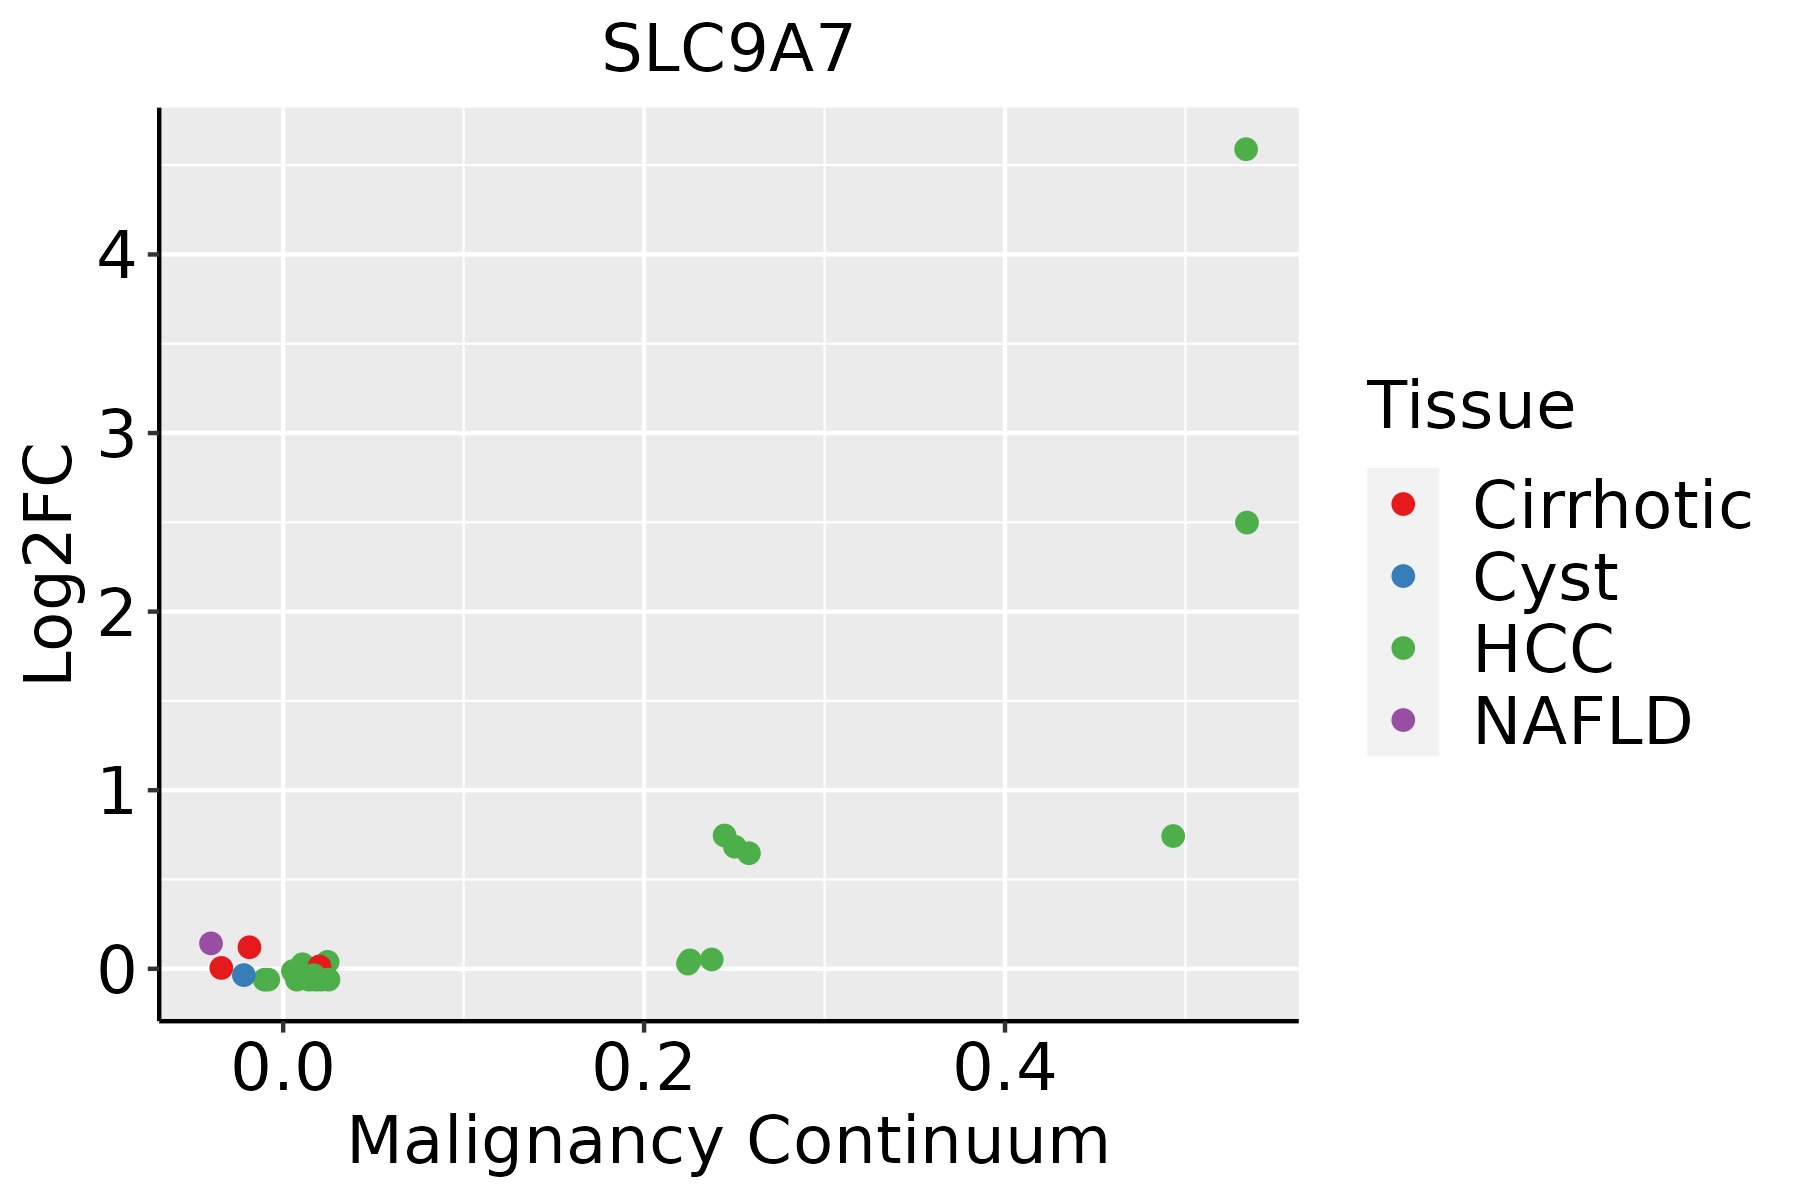 | HCC: Hepatocellular carcinoma |
| NAFLD: Non-alcoholic fatty liver disease |
| ∗log2FC in expression of this searched gene in stem-like cells from each diseased tissue sample relative to stem-like cells in normal samples in each tissue plotted against the malignancy continuum. Samples are colored based on if they are from different disease stage. |
Top |
Malignant transformation related pathway analysis |
| Find out the enriched GO biological processes and KEGG pathways involved in transition from healthy to precancer to cancer |
| Tissue | Disease Stage | Enriched GO biological Processes |
| Colorectum | AD |  |
| Colorectum | SER |  |
| Colorectum | MSS |  |
| Colorectum | MSI-H |  |
| Colorectum | FAP |  |
| ∗Top 15 enriched GO BP terms are showed in the bar plot of each disease state in each tissue. Each row represents a significant GO biological process which is colored according to the -log10(p.adjust). |
| Page: 1 2 3 4 5 6 7 8 9 |
| GO ID | Tissue | Disease Stage | Description | Gene Ratio | Bg Ratio | pvalue | p.adjust | Count |
| GO:19026007 | Liver | HCC | proton transmembrane transport | 87/7958 | 157/18723 | 7.27e-04 | 4.42e-03 | 87 |
| Page: 1 |
| Pathway ID | Tissue | Disease Stage | Description | Gene Ratio | Bg Ratio | pvalue | p.adjust | qvalue | Count |
| Page: 1 |
Top |
Cell-cell communication analysis |
| Identification of potential cell-cell interactions between two cell types and their ligand-receptor pairs for different disease states |
| Ligand | Receptor | LRpair | Pathway | Tissue | Disease Stage |
| Page: 1 |
Top |
Single-cell gene regulatory network inference analysis |
| Find out the significant the regulons (TFs) and the target genes of each regulon across cell types for different disease states |
| TF | Cell Type | Tissue | Disease Stage | Target Gene | RSS | Regulon Activity |
| ∗The dot plots of a searched regulon are shown for all cell subpopulations in each disease state of each tissue based on the regulon specific score inferred using pySCENIC and by calculating the average expression. |
| Page: 1 |
Top |
Somatic mutation of malignant transformation related genes |
| Annotation of somatic variants for genes involved in malignant transformation |
| Hugo Symbol | Variant Class | Variant Classification | dbSNP RS | HGVSc | HGVSp | HGVSp Short | SWISSPROT | BIOTYPE | SIFT | PolyPhen | Tumor Sample Barcode | Tissue | Histology | Sex | Age | Stage | Therapy Types | Drugs | Outcome |
| SLC9A7 | SNV | Missense_Mutation | c.1975G>A | p.Glu659Lys | p.E659K | protein_coding | deleterious(0.02) | benign(0.079) | TCGA-AN-A046-01 | Breast | breast invasive carcinoma | Female | >=65 | I/II | Unknown | Unknown | SD | ||
| SLC9A7 | SNV | Missense_Mutation | rs201653332 | c.1639G>A | p.Glu547Lys | p.E547K | protein_coding | tolerated(0.18) | benign(0.106) | TCGA-AN-A046-01 | Breast | breast invasive carcinoma | Female | >=65 | I/II | Unknown | Unknown | SD | |
| SLC9A7 | SNV | Missense_Mutation | novel | c.1435N>G | p.Asn479Asp | p.N479D | protein_coding | deleterious(0) | benign(0.275) | TCGA-AQ-A04H-01 | Breast | breast invasive carcinoma | Female | <65 | III/IV | Chemotherapy | taxotere | SD | |
| SLC9A7 | SNV | Missense_Mutation | c.1717N>A | p.Asp573Asn | p.D573N | protein_coding | tolerated(0.25) | benign(0.001) | TCGA-BH-A0HY-01 | Breast | breast invasive carcinoma | Female | <65 | I/II | Hormone Therapy | taxotere | CR | ||
| SLC9A7 | SNV | Missense_Mutation | c.565N>T | p.Pro189Ser | p.P189S | protein_coding | deleterious(0.02) | probably_damaging(0.998) | TCGA-BH-A0WA-01 | Breast | breast invasive carcinoma | Female | >=65 | I/II | Unknown | Unknown | SD | ||
| SLC9A7 | SNV | Missense_Mutation | novel | c.968N>T | p.Ser323Leu | p.S323L | protein_coding | deleterious(0) | probably_damaging(0.985) | TCGA-GM-A2D9-01 | Breast | breast invasive carcinoma | Female | >=65 | I/II | Hormone Therapy | arimidex | SD | |
| SLC9A7 | SNV | Missense_Mutation | rs771899348 | c.376N>T | p.Arg126Cys | p.R126C | protein_coding | tolerated(0.08) | benign(0.409) | TCGA-C5-A1MK-01 | Cervix | cervical & endocervical cancer | Female | >=65 | III/IV | Chemotherapy | carboplatin | PD | |
| SLC9A7 | SNV | Missense_Mutation | novel | c.295N>G | p.Leu99Val | p.L99V | protein_coding | tolerated(0.1) | probably_damaging(0.978) | TCGA-C5-A2LY-01 | Cervix | cervical & endocervical cancer | Female | <65 | I/II | Chemotherapy | cisplatin | SD | |
| SLC9A7 | SNV | Missense_Mutation | c.806N>T | p.Ala269Val | p.A269V | protein_coding | deleterious(0) | probably_damaging(0.991) | TCGA-DR-A0ZM-01 | Cervix | cervical & endocervical cancer | Female | <65 | III/IV | Unspecific | Cisplatin | SD | ||
| SLC9A7 | SNV | Missense_Mutation | novel | c.1141N>G | p.Phe381Val | p.F381V | protein_coding | deleterious(0.01) | probably_damaging(0.979) | TCGA-EA-A3HU-01 | Cervix | cervical & endocervical cancer | Female | <65 | I/II | Unknown | Unknown | SD |
| Page: 1 2 3 4 5 6 7 8 |
Top |
Related drugs of malignant transformation related genes |
| Identification of chemicals and drugs interact with genes involved in malignant transfromation |
| (DGIdb 4.0) |
| Entrez ID | Symbol | Category | Interaction Types | Drug Claim Name | Drug Name | PMIDs |
| Page: 1 |

Copyright 2023-Present -The University of Texas Health Science Center at Houston |