
|
|||||
|
 | |
| |
| |
| |
| |
| |
|
Gene: SLC9A2 |
Gene summary for SLC9A2 |
| Gene information | Species | Human | Gene symbol | SLC9A2 | Gene ID | 6549 |
| Gene name | solute carrier family 9 member A2 | |
| Gene Alias | NHE2 | |
| Cytomap | 2q12.1 | |
| Gene Type | protein-coding | GO ID | GO:0006810 | UniProtAcc | Q9UBY0 |
Top |
Malignant transformation analysis |
| Identification of the aberrant gene expression in precancerous and cancerous lesions by comparing the gene expression of stem-like cells in diseased tissues with normal stem cells |
| Entrez ID | Symbol | Replicates | Species | Organ | Tissue | Adj P-value | Log2FC | Malignancy |
| 6549 | SLC9A2 | HTA11_3410_2000001011 | Human | Colorectum | AD | 1.55e-33 | -7.96e-01 | 0.0155 |
| 6549 | SLC9A2 | HTA11_2487_2000001011 | Human | Colorectum | SER | 1.17e-10 | -6.22e-01 | -0.1808 |
| 6549 | SLC9A2 | HTA11_2951_2000001011 | Human | Colorectum | AD | 2.85e-04 | -6.59e-01 | 0.0216 |
| 6549 | SLC9A2 | HTA11_1938_2000001011 | Human | Colorectum | AD | 3.16e-02 | -4.95e-01 | -0.0811 |
| 6549 | SLC9A2 | HTA11_347_2000001011 | Human | Colorectum | AD | 1.48e-11 | 6.68e-01 | -0.1954 |
| 6549 | SLC9A2 | HTA11_3361_2000001011 | Human | Colorectum | AD | 1.18e-03 | -5.54e-01 | -0.1207 |
| 6549 | SLC9A2 | HTA11_696_2000001011 | Human | Colorectum | AD | 4.09e-05 | -4.20e-01 | -0.1464 |
| 6549 | SLC9A2 | HTA11_1391_2000001011 | Human | Colorectum | AD | 5.01e-10 | -5.87e-01 | -0.059 |
| 6549 | SLC9A2 | HTA11_5216_2000001011 | Human | Colorectum | SER | 3.67e-06 | -7.27e-01 | -0.1462 |
| 6549 | SLC9A2 | HTA11_866_3004761011 | Human | Colorectum | AD | 3.41e-29 | -8.45e-01 | 0.096 |
| 6549 | SLC9A2 | HTA11_4255_2000001011 | Human | Colorectum | SER | 2.78e-02 | -6.15e-01 | 0.0446 |
| 6549 | SLC9A2 | HTA11_9408_2000001011 | Human | Colorectum | AD | 6.75e-08 | -1.09e+00 | 0.0451 |
| 6549 | SLC9A2 | HTA11_8622_2000001021 | Human | Colorectum | SER | 8.16e-11 | -8.49e-01 | 0.0528 |
| 6549 | SLC9A2 | HTA11_10711_2000001011 | Human | Colorectum | AD | 6.49e-05 | -4.61e-01 | 0.0338 |
| 6549 | SLC9A2 | HTA11_6818_2000001011 | Human | Colorectum | AD | 1.56e-04 | -5.73e-01 | 0.0112 |
| 6549 | SLC9A2 | HTA11_11156_2000001011 | Human | Colorectum | AD | 1.73e-06 | -1.02e+00 | 0.0397 |
| 6549 | SLC9A2 | HTA11_6818_2000001021 | Human | Colorectum | AD | 3.33e-13 | -6.76e-01 | 0.0588 |
| 6549 | SLC9A2 | HTA11_99999965104_69814 | Human | Colorectum | MSS | 1.34e-28 | -1.12e+00 | 0.281 |
| 6549 | SLC9A2 | HTA11_99999971662_82457 | Human | Colorectum | MSS | 1.40e-65 | -1.16e+00 | 0.3859 |
| 6549 | SLC9A2 | HTA11_99999973899_84307 | Human | Colorectum | MSS | 2.86e-22 | -1.12e+00 | 0.2585 |
| Page: 1 2 3 4 |
| Tissue | Expression Dynamics | Abbreviation |
| Colorectum (GSE201348) |  | FAP: Familial adenomatous polyposis |
| CRC: Colorectal cancer | ||
| Colorectum (HTA11) |  | AD: Adenomas |
| SER: Sessile serrated lesions | ||
| MSI-H: Microsatellite-high colorectal cancer | ||
| MSS: Microsatellite stable colorectal cancer | ||
| Esophagus | 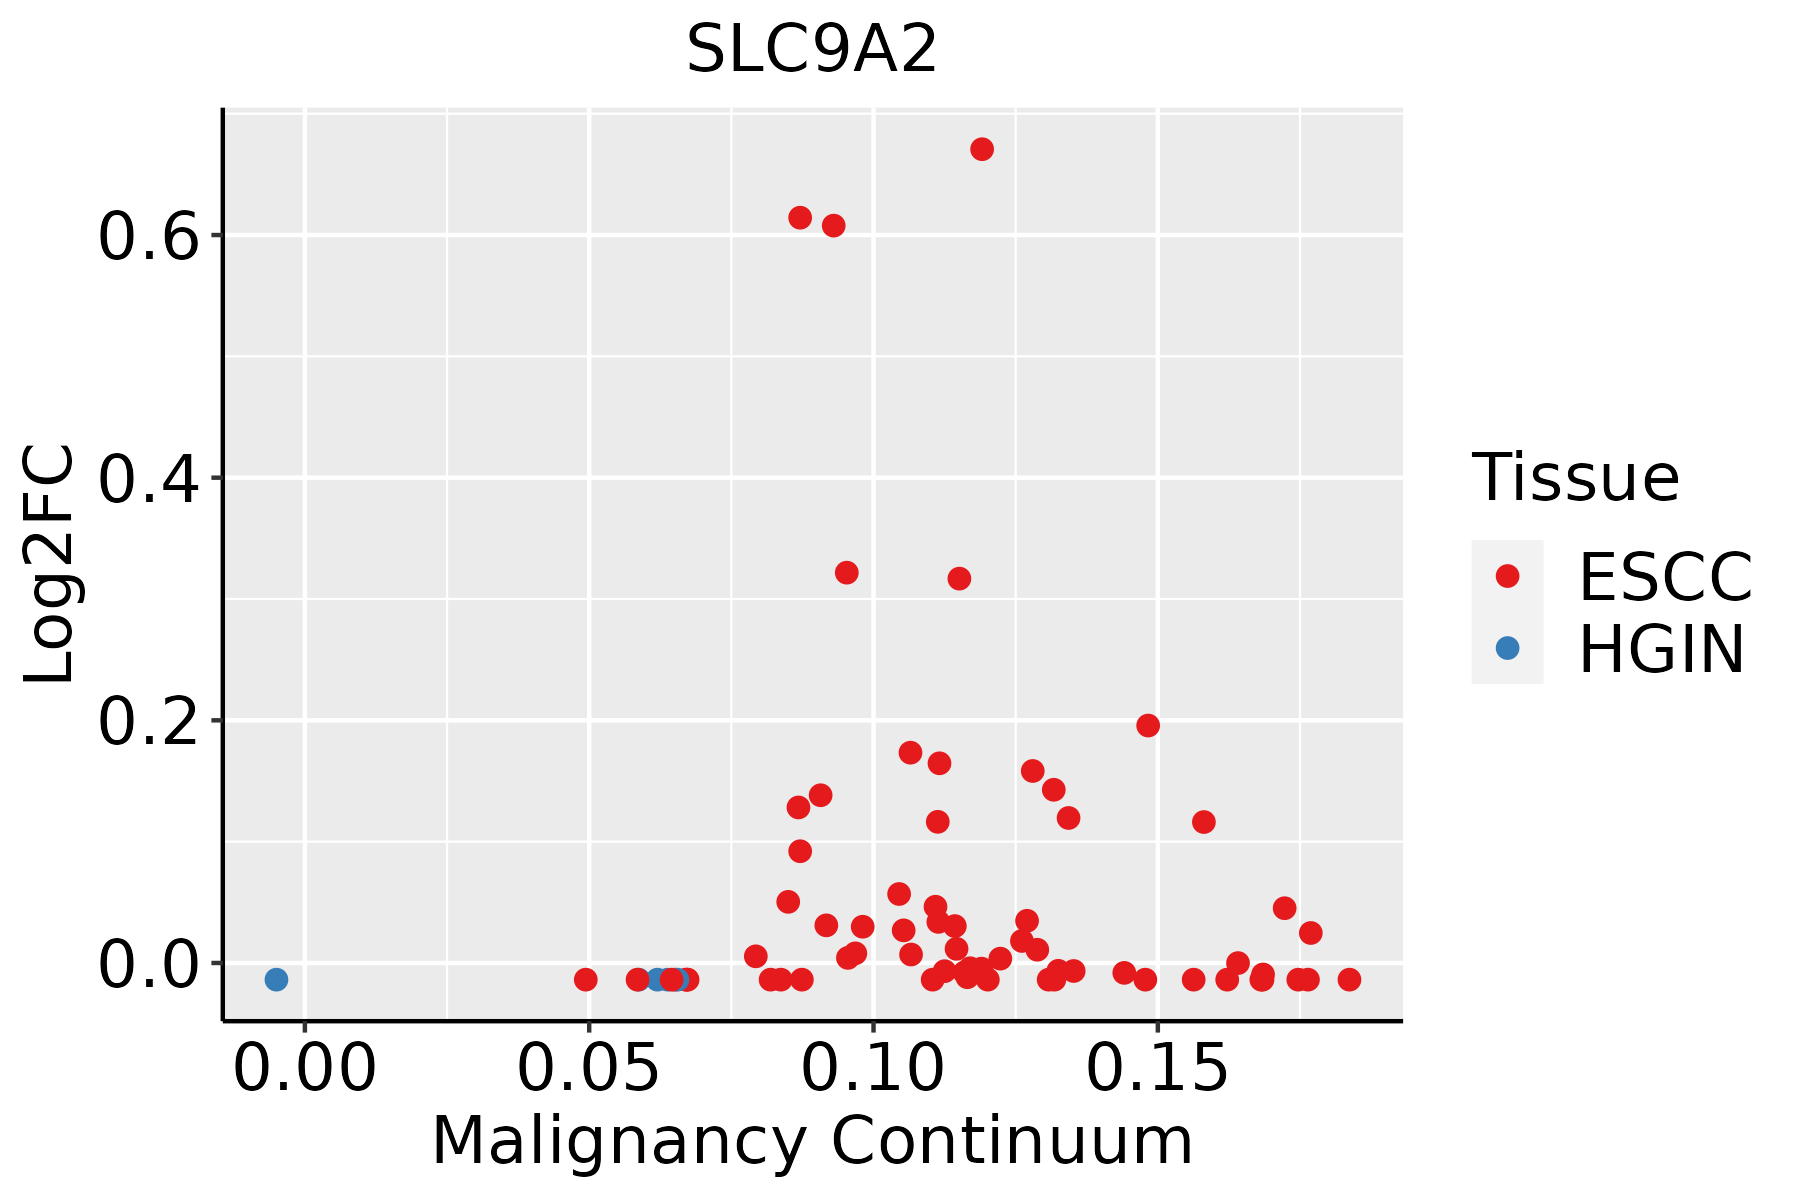 | ESCC: Esophageal squamous cell carcinoma |
| HGIN: High-grade intraepithelial neoplasias | ||
| LGIN: Low-grade intraepithelial neoplasias |
| ∗log2FC in expression of this searched gene in stem-like cells from each diseased tissue sample relative to stem-like cells in normal samples in each tissue plotted against the malignancy continuum. Samples are colored based on if they are from different disease stage. |
Top |
Malignant transformation related pathway analysis |
| Find out the enriched GO biological processes and KEGG pathways involved in transition from healthy to precancer to cancer |
| Tissue | Disease Stage | Enriched GO biological Processes |
| Colorectum | AD |  |
| Colorectum | SER |  |
| Colorectum | MSS |  |
| Colorectum | MSI-H |  |
| Colorectum | FAP |  |
| ∗Top 15 enriched GO BP terms are showed in the bar plot of each disease state in each tissue. Each row represents a significant GO biological process which is colored according to the -log10(p.adjust). |
| Page: 1 2 3 4 5 6 7 8 9 |
| GO ID | Tissue | Disease Stage | Description | Gene Ratio | Bg Ratio | pvalue | p.adjust | Count |
| GO:1902600 | Colorectum | AD | proton transmembrane transport | 66/3918 | 157/18723 | 1.59e-09 | 1.17e-07 | 66 |
| GO:0030004 | Colorectum | AD | cellular monovalent inorganic cation homeostasis | 36/3918 | 103/18723 | 6.80e-04 | 6.95e-03 | 36 |
| GO:0030641 | Colorectum | AD | regulation of cellular pH | 29/3918 | 81/18723 | 1.42e-03 | 1.22e-02 | 29 |
| GO:0051453 | Colorectum | AD | regulation of intracellular pH | 26/3918 | 75/18723 | 4.04e-03 | 2.82e-02 | 26 |
| GO:0006885 | Colorectum | AD | regulation of pH | 30/3918 | 91/18723 | 4.95e-03 | 3.32e-02 | 30 |
| GO:0055067 | Colorectum | AD | monovalent inorganic cation homeostasis | 45/3918 | 151/18723 | 6.19e-03 | 3.88e-02 | 45 |
| GO:19026001 | Colorectum | SER | proton transmembrane transport | 60/2897 | 157/18723 | 3.12e-12 | 7.08e-10 | 60 |
| GO:00300041 | Colorectum | SER | cellular monovalent inorganic cation homeostasis | 31/2897 | 103/18723 | 1.31e-04 | 2.66e-03 | 31 |
| GO:00306411 | Colorectum | SER | regulation of cellular pH | 24/2897 | 81/18723 | 9.20e-04 | 1.11e-02 | 24 |
| GO:00550671 | Colorectum | SER | monovalent inorganic cation homeostasis | 37/2897 | 151/18723 | 2.48e-03 | 2.33e-02 | 37 |
| GO:00514531 | Colorectum | SER | regulation of intracellular pH | 21/2897 | 75/18723 | 3.97e-03 | 3.26e-02 | 21 |
| GO:00068851 | Colorectum | SER | regulation of pH | 24/2897 | 91/18723 | 5.03e-03 | 3.88e-02 | 24 |
| GO:19026002 | Colorectum | MSS | proton transmembrane transport | 57/3467 | 157/18723 | 1.00e-07 | 4.81e-06 | 57 |
| GO:00300042 | Colorectum | MSS | cellular monovalent inorganic cation homeostasis | 31/3467 | 103/18723 | 2.94e-03 | 2.27e-02 | 31 |
| GO:00306412 | Colorectum | MSS | regulation of cellular pH | 25/3467 | 81/18723 | 4.97e-03 | 3.46e-02 | 25 |
| GO:0035725 | Colorectum | FAP | sodium ion transmembrane transport | 44/2622 | 178/18723 | 9.31e-05 | 1.60e-03 | 44 |
| GO:19026004 | Colorectum | FAP | proton transmembrane transport | 39/2622 | 157/18723 | 2.03e-04 | 2.92e-03 | 39 |
| GO:00300043 | Colorectum | FAP | cellular monovalent inorganic cation homeostasis | 28/2622 | 103/18723 | 3.23e-04 | 4.15e-03 | 28 |
| GO:0006814 | Colorectum | FAP | sodium ion transport | 54/2622 | 245/18723 | 3.98e-04 | 4.85e-03 | 54 |
| GO:00514532 | Colorectum | FAP | regulation of intracellular pH | 22/2622 | 75/18723 | 4.38e-04 | 5.21e-03 | 22 |
| Page: 1 2 |
| Pathway ID | Tissue | Disease Stage | Description | Gene Ratio | Bg Ratio | pvalue | p.adjust | qvalue | Count |
| Page: 1 |
Top |
Cell-cell communication analysis |
| Identification of potential cell-cell interactions between two cell types and their ligand-receptor pairs for different disease states |
| Ligand | Receptor | LRpair | Pathway | Tissue | Disease Stage |
| Page: 1 |
Top |
Single-cell gene regulatory network inference analysis |
| Find out the significant the regulons (TFs) and the target genes of each regulon across cell types for different disease states |
| TF | Cell Type | Tissue | Disease Stage | Target Gene | RSS | Regulon Activity |
| ∗The dot plots of a searched regulon are shown for all cell subpopulations in each disease state of each tissue based on the regulon specific score inferred using pySCENIC and by calculating the average expression. |
| Page: 1 |
Top |
Somatic mutation of malignant transformation related genes |
| Annotation of somatic variants for genes involved in malignant transformation |
| Hugo Symbol | Variant Class | Variant Classification | dbSNP RS | HGVSc | HGVSp | HGVSp Short | SWISSPROT | BIOTYPE | SIFT | PolyPhen | Tumor Sample Barcode | Tissue | Histology | Sex | Age | Stage | Therapy Types | Drugs | Outcome |
| SLC9A2 | SNV | Missense_Mutation | novel | c.1390N>T | p.Ala464Ser | p.A464S | Q9UBY0 | protein_coding | tolerated(0.07) | benign(0.248) | TCGA-A7-A0DB-01 | Breast | breast invasive carcinoma | Female | <65 | I/II | Hormone Therapy | arimidex | SD |
| SLC9A2 | SNV | Missense_Mutation | c.1883N>G | p.Thr628Arg | p.T628R | Q9UBY0 | protein_coding | tolerated(0.1) | benign(0.244) | TCGA-AO-A124-01 | Breast | breast invasive carcinoma | Female | <65 | I/II | Chemotherapy | doxorubicin | SD | |
| SLC9A2 | SNV | Missense_Mutation | c.2306N>G | p.Ser769Cys | p.S769C | Q9UBY0 | protein_coding | deleterious(0.03) | possibly_damaging(0.62) | TCGA-D8-A1JA-01 | Breast | breast invasive carcinoma | Female | <65 | III/IV | Chemotherapy | adriamycin | PD | |
| SLC9A2 | SNV | Missense_Mutation | novel | c.538N>G | p.Asn180Asp | p.N180D | Q9UBY0 | protein_coding | deleterious(0.04) | probably_damaging(0.999) | TCGA-D8-A1JK-01 | Breast | breast invasive carcinoma | Female | >=65 | I/II | Unknown | Unknown | SD |
| SLC9A2 | SNV | Missense_Mutation | c.1583N>G | p.Asp528Gly | p.D528G | Q9UBY0 | protein_coding | deleterious(0) | possibly_damaging(0.752) | TCGA-D8-A1X7-01 | Breast | breast invasive carcinoma | Female | <65 | I/II | ChemotherapyHormone Therapy | doxorubicine+cyclophosphamide+tamoxifen | SD | |
| SLC9A2 | SNV | Missense_Mutation | c.1880N>G | p.Asp627Gly | p.D627G | Q9UBY0 | protein_coding | deleterious(0.04) | benign(0.001) | TCGA-EW-A1IZ-01 | Breast | breast invasive carcinoma | Female | <65 | III/IV | Chemotherapy | taxotere | SD | |
| SLC9A2 | SNV | Missense_Mutation | rs201412062 | c.486N>G | p.Phe162Leu | p.F162L | Q9UBY0 | protein_coding | deleterious(0) | probably_damaging(0.998) | TCGA-OL-A5RW-01 | Breast | breast invasive carcinoma | Female | <65 | I/II | Chemotherapy | adriamycin | CR |
| SLC9A2 | insertion | Frame_Shift_Ins | rs748701652 | c.2236_2237insC | p.Thr749AsnfsTer22 | p.T749Nfs*22 | Q9UBY0 | protein_coding | TCGA-A8-A07R-01 | Breast | breast invasive carcinoma | Female | >=65 | III/IV | Ancillary | zoledronic | SD | ||
| SLC9A2 | insertion | Frame_Shift_Ins | rs748701652 | c.2236_2237insC | p.Thr749AsnfsTer22 | p.T749Nfs*22 | Q9UBY0 | protein_coding | TCGA-AN-A04C-01 | Breast | breast invasive carcinoma | Female | <65 | I/II | Unknown | Unknown | SD | ||
| SLC9A2 | insertion | Frame_Shift_Ins | rs748701652 | c.2236_2237insC | p.Thr749AsnfsTer22 | p.T749Nfs*22 | Q9UBY0 | protein_coding | TCGA-BH-A0BR-01 | Breast | breast invasive carcinoma | Female | <65 | I/II | Unknown | Unknown | SD |
| Page: 1 2 3 4 5 6 7 8 9 10 11 12 |
Top |
Related drugs of malignant transformation related genes |
| Identification of chemicals and drugs interact with genes involved in malignant transfromation |
| (DGIdb 4.0) |
| Entrez ID | Symbol | Category | Interaction Types | Drug Claim Name | Drug Name | PMIDs |
| Page: 1 |

Copyright 2023-Present -The University of Texas Health Science Center at Houston |