
|
|||||
|
 | |
| |
| |
| |
| |
| |
|
Gene: SLC8B1 |
Gene summary for SLC8B1 |
| Gene information | Species | Human | Gene symbol | SLC8B1 | Gene ID | 80024 |
| Gene name | solute carrier family 8 member B1 | |
| Gene Alias | NCKX6 | |
| Cytomap | 12q24.13 | |
| Gene Type | protein-coding | GO ID | GO:0002115 | UniProtAcc | Q6J4K2 |
Top |
Malignant transformation analysis |
| Identification of the aberrant gene expression in precancerous and cancerous lesions by comparing the gene expression of stem-like cells in diseased tissues with normal stem cells |
| Entrez ID | Symbol | Replicates | Species | Organ | Tissue | Adj P-value | Log2FC | Malignancy |
| 80024 | SLC8B1 | LZE4T | Human | Esophagus | ESCC | 2.79e-02 | 2.22e-01 | 0.0811 |
| 80024 | SLC8B1 | LZE8T | Human | Esophagus | ESCC | 3.22e-09 | 1.85e-01 | 0.067 |
| 80024 | SLC8B1 | LZE20T | Human | Esophagus | ESCC | 2.62e-02 | 1.16e-01 | 0.0662 |
| 80024 | SLC8B1 | LZE22T | Human | Esophagus | ESCC | 3.86e-02 | 2.87e-01 | 0.068 |
| 80024 | SLC8B1 | LZE24T | Human | Esophagus | ESCC | 3.70e-08 | 1.43e-01 | 0.0596 |
| 80024 | SLC8B1 | P1T-E | Human | Esophagus | ESCC | 1.45e-16 | 1.04e+00 | 0.0875 |
| 80024 | SLC8B1 | P2T-E | Human | Esophagus | ESCC | 3.67e-30 | 6.56e-01 | 0.1177 |
| 80024 | SLC8B1 | P4T-E | Human | Esophagus | ESCC | 6.69e-17 | 4.33e-01 | 0.1323 |
| 80024 | SLC8B1 | P5T-E | Human | Esophagus | ESCC | 7.73e-31 | 7.99e-01 | 0.1327 |
| 80024 | SLC8B1 | P8T-E | Human | Esophagus | ESCC | 3.09e-18 | 3.38e-01 | 0.0889 |
| 80024 | SLC8B1 | P9T-E | Human | Esophagus | ESCC | 2.31e-02 | 1.07e-01 | 0.1131 |
| 80024 | SLC8B1 | P10T-E | Human | Esophagus | ESCC | 4.41e-12 | 6.43e-02 | 0.116 |
| 80024 | SLC8B1 | P11T-E | Human | Esophagus | ESCC | 1.19e-05 | 2.87e-01 | 0.1426 |
| 80024 | SLC8B1 | P12T-E | Human | Esophagus | ESCC | 1.22e-04 | 1.97e-01 | 0.1122 |
| 80024 | SLC8B1 | P15T-E | Human | Esophagus | ESCC | 6.46e-11 | 1.60e-01 | 0.1149 |
| 80024 | SLC8B1 | P16T-E | Human | Esophagus | ESCC | 4.71e-08 | 1.82e-01 | 0.1153 |
| 80024 | SLC8B1 | P20T-E | Human | Esophagus | ESCC | 1.66e-16 | 2.76e-01 | 0.1124 |
| 80024 | SLC8B1 | P21T-E | Human | Esophagus | ESCC | 6.03e-20 | 5.08e-01 | 0.1617 |
| 80024 | SLC8B1 | P22T-E | Human | Esophagus | ESCC | 9.77e-05 | 1.58e-01 | 0.1236 |
| 80024 | SLC8B1 | P23T-E | Human | Esophagus | ESCC | 6.33e-16 | 3.89e-01 | 0.108 |
| Page: 1 2 3 4 |
| Tissue | Expression Dynamics | Abbreviation |
| Esophagus |  | ESCC: Esophageal squamous cell carcinoma |
| HGIN: High-grade intraepithelial neoplasias | ||
| LGIN: Low-grade intraepithelial neoplasias | ||
| Oral Cavity | 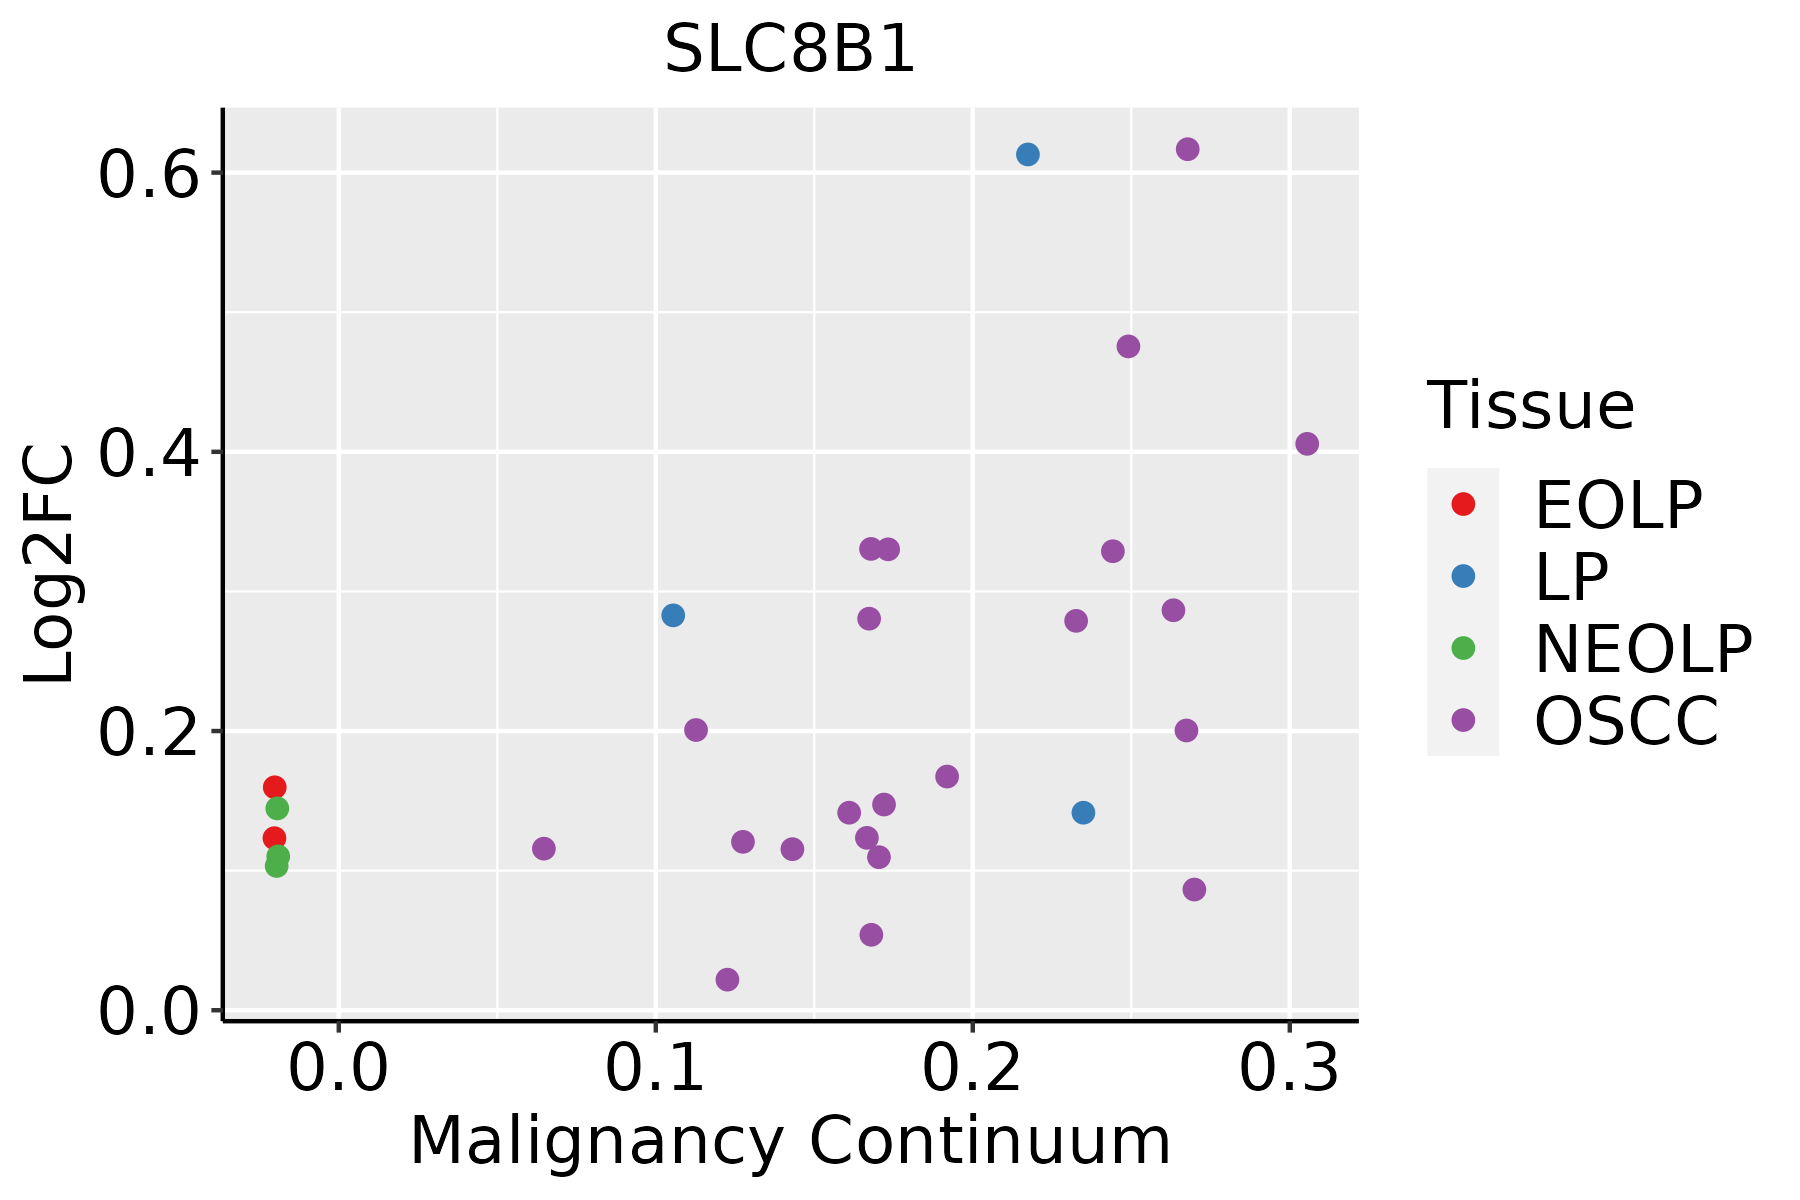 | EOLP: Erosive Oral lichen planus |
| LP: leukoplakia | ||
| NEOLP: Non-erosive oral lichen planus | ||
| OSCC: Oral squamous cell carcinoma | ||
| Thyroid |  | ATC: Anaplastic thyroid cancer |
| HT: Hashimoto's thyroiditis | ||
| PTC: Papillary thyroid cancer |
| ∗log2FC in expression of this searched gene in stem-like cells from each diseased tissue sample relative to stem-like cells in normal samples in each tissue plotted against the malignancy continuum. Samples are colored based on if they are from different disease stage. |
Top |
Malignant transformation related pathway analysis |
| Find out the enriched GO biological processes and KEGG pathways involved in transition from healthy to precancer to cancer |
| Tissue | Disease Stage | Enriched GO biological Processes |
| Colorectum | AD |  |
| Colorectum | SER |  |
| Colorectum | MSS |  |
| Colorectum | MSI-H |  |
| Colorectum | FAP |  |
| ∗Top 15 enriched GO BP terms are showed in the bar plot of each disease state in each tissue. Each row represents a significant GO biological process which is colored according to the -log10(p.adjust). |
| Page: 1 2 3 4 5 6 7 8 9 |
| GO ID | Tissue | Disease Stage | Description | Gene Ratio | Bg Ratio | pvalue | p.adjust | Count |
| GO:0006839110 | Esophagus | ESCC | mitochondrial transport | 187/8552 | 254/18723 | 8.35e-20 | 9.81e-18 | 187 |
| GO:0051235110 | Esophagus | ESCC | maintenance of location | 200/8552 | 327/18723 | 1.01e-08 | 2.02e-07 | 200 |
| GO:1990542110 | Esophagus | ESCC | mitochondrial transmembrane transport | 72/8552 | 102/18723 | 2.94e-07 | 4.23e-06 | 72 |
| GO:0051651111 | Esophagus | ESCC | maintenance of location in cell | 126/8552 | 214/18723 | 6.57e-05 | 5.00e-04 | 126 |
| GO:000930617 | Esophagus | ESCC | protein secretion | 190/8552 | 359/18723 | 3.22e-03 | 1.34e-02 | 190 |
| GO:003559217 | Esophagus | ESCC | establishment of protein localization to extracellular region | 190/8552 | 360/18723 | 3.77e-03 | 1.53e-02 | 190 |
| GO:007169210 | Esophagus | ESCC | protein localization to extracellular region | 193/8552 | 368/18723 | 5.01e-03 | 1.92e-02 | 193 |
| GO:000268515 | Esophagus | ESCC | regulation of leukocyte migration | 114/8552 | 210/18723 | 7.26e-03 | 2.63e-02 | 114 |
| GO:005070810 | Esophagus | ESCC | regulation of protein secretion | 142/8552 | 268/18723 | 9.31e-03 | 3.24e-02 | 142 |
| GO:000683918 | Oral cavity | OSCC | mitochondrial transport | 162/7305 | 254/18723 | 8.96e-16 | 6.52e-14 | 162 |
| GO:005123518 | Oral cavity | OSCC | maintenance of location | 182/7305 | 327/18723 | 6.16e-10 | 1.58e-08 | 182 |
| GO:005165120 | Oral cavity | OSCC | maintenance of location in cell | 121/7305 | 214/18723 | 1.39e-07 | 2.32e-06 | 121 |
| GO:000268510 | Oral cavity | OSCC | regulation of leukocyte migration | 108/7305 | 210/18723 | 1.63e-04 | 1.13e-03 | 108 |
| GO:005090010 | Oral cavity | OSCC | leukocyte migration | 176/7305 | 369/18723 | 3.80e-04 | 2.31e-03 | 176 |
| GO:199054218 | Oral cavity | OSCC | mitochondrial transmembrane transport | 56/7305 | 102/18723 | 8.06e-04 | 4.32e-03 | 56 |
| GO:000930610 | Oral cavity | OSCC | protein secretion | 169/7305 | 359/18723 | 1.04e-03 | 5.34e-03 | 169 |
| GO:004259316 | Oral cavity | OSCC | glucose homeostasis | 125/7305 | 258/18723 | 1.21e-03 | 6.08e-03 | 125 |
| GO:003559210 | Oral cavity | OSCC | establishment of protein localization to extracellular region | 169/7305 | 360/18723 | 1.21e-03 | 6.08e-03 | 169 |
| GO:00716929 | Oral cavity | OSCC | protein localization to extracellular region | 172/7305 | 368/18723 | 1.40e-03 | 6.79e-03 | 172 |
| GO:003350016 | Oral cavity | OSCC | carbohydrate homeostasis | 125/7305 | 259/18723 | 1.44e-03 | 6.97e-03 | 125 |
| Page: 1 2 3 |
| Pathway ID | Tissue | Disease Stage | Description | Gene Ratio | Bg Ratio | pvalue | p.adjust | qvalue | Count |
| Page: 1 |
Top |
Cell-cell communication analysis |
| Identification of potential cell-cell interactions between two cell types and their ligand-receptor pairs for different disease states |
| Ligand | Receptor | LRpair | Pathway | Tissue | Disease Stage |
| Page: 1 |
Top |
Single-cell gene regulatory network inference analysis |
| Find out the significant the regulons (TFs) and the target genes of each regulon across cell types for different disease states |
| TF | Cell Type | Tissue | Disease Stage | Target Gene | RSS | Regulon Activity |
| ∗The dot plots of a searched regulon are shown for all cell subpopulations in each disease state of each tissue based on the regulon specific score inferred using pySCENIC and by calculating the average expression. |
| Page: 1 |
Top |
Somatic mutation of malignant transformation related genes |
| Annotation of somatic variants for genes involved in malignant transformation |
| Hugo Symbol | Variant Class | Variant Classification | dbSNP RS | HGVSc | HGVSp | HGVSp Short | SWISSPROT | BIOTYPE | SIFT | PolyPhen | Tumor Sample Barcode | Tissue | Histology | Sex | Age | Stage | Therapy Types | Drugs | Outcome |
| SLC8B1 | SNV | Missense_Mutation | c.1610N>A | p.Ser537Asn | p.S537N | Q6J4K2 | protein_coding | deleterious(0) | probably_damaging(0.998) | TCGA-BH-A0DQ-01 | Breast | breast invasive carcinoma | Female | <65 | I/II | Chemotherapy | doxorubicin | SD | |
| SLC8B1 | SNV | Missense_Mutation | novel | c.1061N>C | p.Trp354Ser | p.W354S | Q6J4K2 | protein_coding | deleterious(0.01) | possibly_damaging(0.824) | TCGA-OL-A66P-01 | Breast | breast invasive carcinoma | Female | >=65 | I/II | Chemotherapy | cytoxan | CR |
| SLC8B1 | deletion | Frame_Shift_Del | c.1111delN | p.Val371SerfsTer2 | p.V371Sfs*2 | Q6J4K2 | protein_coding | TCGA-E2-A14W-01 | Breast | breast invasive carcinoma | Male | >=65 | I/II | Chemotherapy | cytoxan | SD | |||
| SLC8B1 | SNV | Missense_Mutation | novel | c.1033G>A | p.Val345Met | p.V345M | Q6J4K2 | protein_coding | deleterious(0.04) | benign(0.3) | TCGA-EA-A3HU-01 | Cervix | cervical & endocervical cancer | Female | <65 | I/II | Unknown | Unknown | SD |
| SLC8B1 | SNV | Missense_Mutation | novel | c.773N>T | p.Ser258Phe | p.S258F | Q6J4K2 | protein_coding | deleterious(0.05) | benign(0.364) | TCGA-ZJ-AB0H-01 | Cervix | cervical & endocervical cancer | Female | <65 | III/IV | Unknown | Unknown | SD |
| SLC8B1 | SNV | Missense_Mutation | c.1165C>T | p.Pro389Ser | p.P389S | Q6J4K2 | protein_coding | deleterious(0) | benign(0.02) | TCGA-A6-5667-01 | Colorectum | colon adenocarcinoma | Female | <65 | III/IV | Chemotherapy | oxaliplatin | SD | |
| SLC8B1 | SNV | Missense_Mutation | novel | c.1132N>G | p.Thr378Ala | p.T378A | Q6J4K2 | protein_coding | tolerated(1) | benign(0) | TCGA-AA-A010-01 | Colorectum | colon adenocarcinoma | Female | <65 | I/II | Chemotherapy | folinic | CR |
| SLC8B1 | SNV | Missense_Mutation | c.199N>G | p.Phe67Val | p.F67V | Q6J4K2 | protein_coding | deleterious(0) | possibly_damaging(0.754) | TCGA-AA-A010-01 | Colorectum | colon adenocarcinoma | Female | <65 | I/II | Chemotherapy | folinic | CR | |
| SLC8B1 | SNV | Missense_Mutation | rs144868306 | c.1501N>A | p.Val501Met | p.V501M | Q6J4K2 | protein_coding | tolerated(0.06) | probably_damaging(0.93) | TCGA-AZ-4315-01 | Colorectum | colon adenocarcinoma | Male | <65 | I/II | Unknown | Unknown | SD |
| SLC8B1 | SNV | Missense_Mutation | rs781050351 | c.757N>T | p.Arg253Trp | p.R253W | Q6J4K2 | protein_coding | tolerated(0.11) | benign(0) | TCGA-AZ-6601-01 | Colorectum | colon adenocarcinoma | Male | >=65 | I/II | Unknown | Unknown | PD |
| Page: 1 2 3 4 5 |
Top |
Related drugs of malignant transformation related genes |
| Identification of chemicals and drugs interact with genes involved in malignant transfromation |
| (DGIdb 4.0) |
| Entrez ID | Symbol | Category | Interaction Types | Drug Claim Name | Drug Name | PMIDs |
| Page: 1 |

Copyright 2023-Present -The University of Texas Health Science Center at Houston |