
|
|||||
|
 | |
| |
| |
| |
| |
| |
|
Gene: SLC8A1 |
Gene summary for SLC8A1 |
| Gene information | Species | Human | Gene symbol | SLC8A1 | Gene ID | 6546 |
| Gene name | solute carrier family 8 member A1 | |
| Gene Alias | NCX1 | |
| Cytomap | 2p22.1 | |
| Gene Type | protein-coding | GO ID | GO:0000302 | UniProtAcc | P32418 |
Top |
Malignant transformation analysis |
| Identification of the aberrant gene expression in precancerous and cancerous lesions by comparing the gene expression of stem-like cells in diseased tissues with normal stem cells |
| Entrez ID | Symbol | Replicates | Species | Organ | Tissue | Adj P-value | Log2FC | Malignancy |
| 6546 | SLC8A1 | HTA12-15-2 | Human | Pancreas | PDAC | 2.08e-13 | 8.43e-01 | 0.2315 |
| 6546 | SLC8A1 | HTA12-23-1 | Human | Pancreas | PDAC | 1.74e-14 | 1.13e+00 | 0.3405 |
| 6546 | SLC8A1 | HTA12-25-1 | Human | Pancreas | PDAC | 3.64e-05 | 5.43e-01 | 0.313 |
| 6546 | SLC8A1 | HTA12-26-1 | Human | Pancreas | PDAC | 2.45e-25 | 1.19e+00 | 0.3728 |
| 6546 | SLC8A1 | HTA12-29-1 | Human | Pancreas | PDAC | 1.30e-63 | 1.36e+00 | 0.3722 |
| 6546 | SLC8A1 | HTA12-30-1 | Human | Pancreas | PDAC | 3.91e-06 | 1.25e+00 | 0.3671 |
| 6546 | SLC8A1 | HTA12-32-1 | Human | Pancreas | PDAC | 1.46e-03 | 7.79e-01 | 0.3624 |
| 6546 | SLC8A1 | HTA12-9-2 | Human | Pancreas | PDAC | 2.67e-04 | 3.31e-01 | 0.0835 |
| 6546 | SLC8A1 | ATC11 | Human | Thyroid | ATC | 5.35e-04 | 4.03e-01 | 0.3386 |
| 6546 | SLC8A1 | ATC12 | Human | Thyroid | ATC | 2.74e-06 | 1.66e-01 | 0.34 |
| 6546 | SLC8A1 | ATC13 | Human | Thyroid | ATC | 2.71e-09 | 2.08e-01 | 0.34 |
| 6546 | SLC8A1 | ATC2 | Human | Thyroid | ATC | 2.49e-06 | 5.69e-01 | 0.34 |
| 6546 | SLC8A1 | ATC3 | Human | Thyroid | ATC | 4.97e-10 | 5.41e-01 | 0.338 |
| 6546 | SLC8A1 | ATC4 | Human | Thyroid | ATC | 1.33e-07 | 2.03e-01 | 0.34 |
| 6546 | SLC8A1 | ATC5 | Human | Thyroid | ATC | 5.88e-09 | 2.25e-01 | 0.34 |
| Page: 1 |
| Tissue | Expression Dynamics | Abbreviation |
| Thyroid | 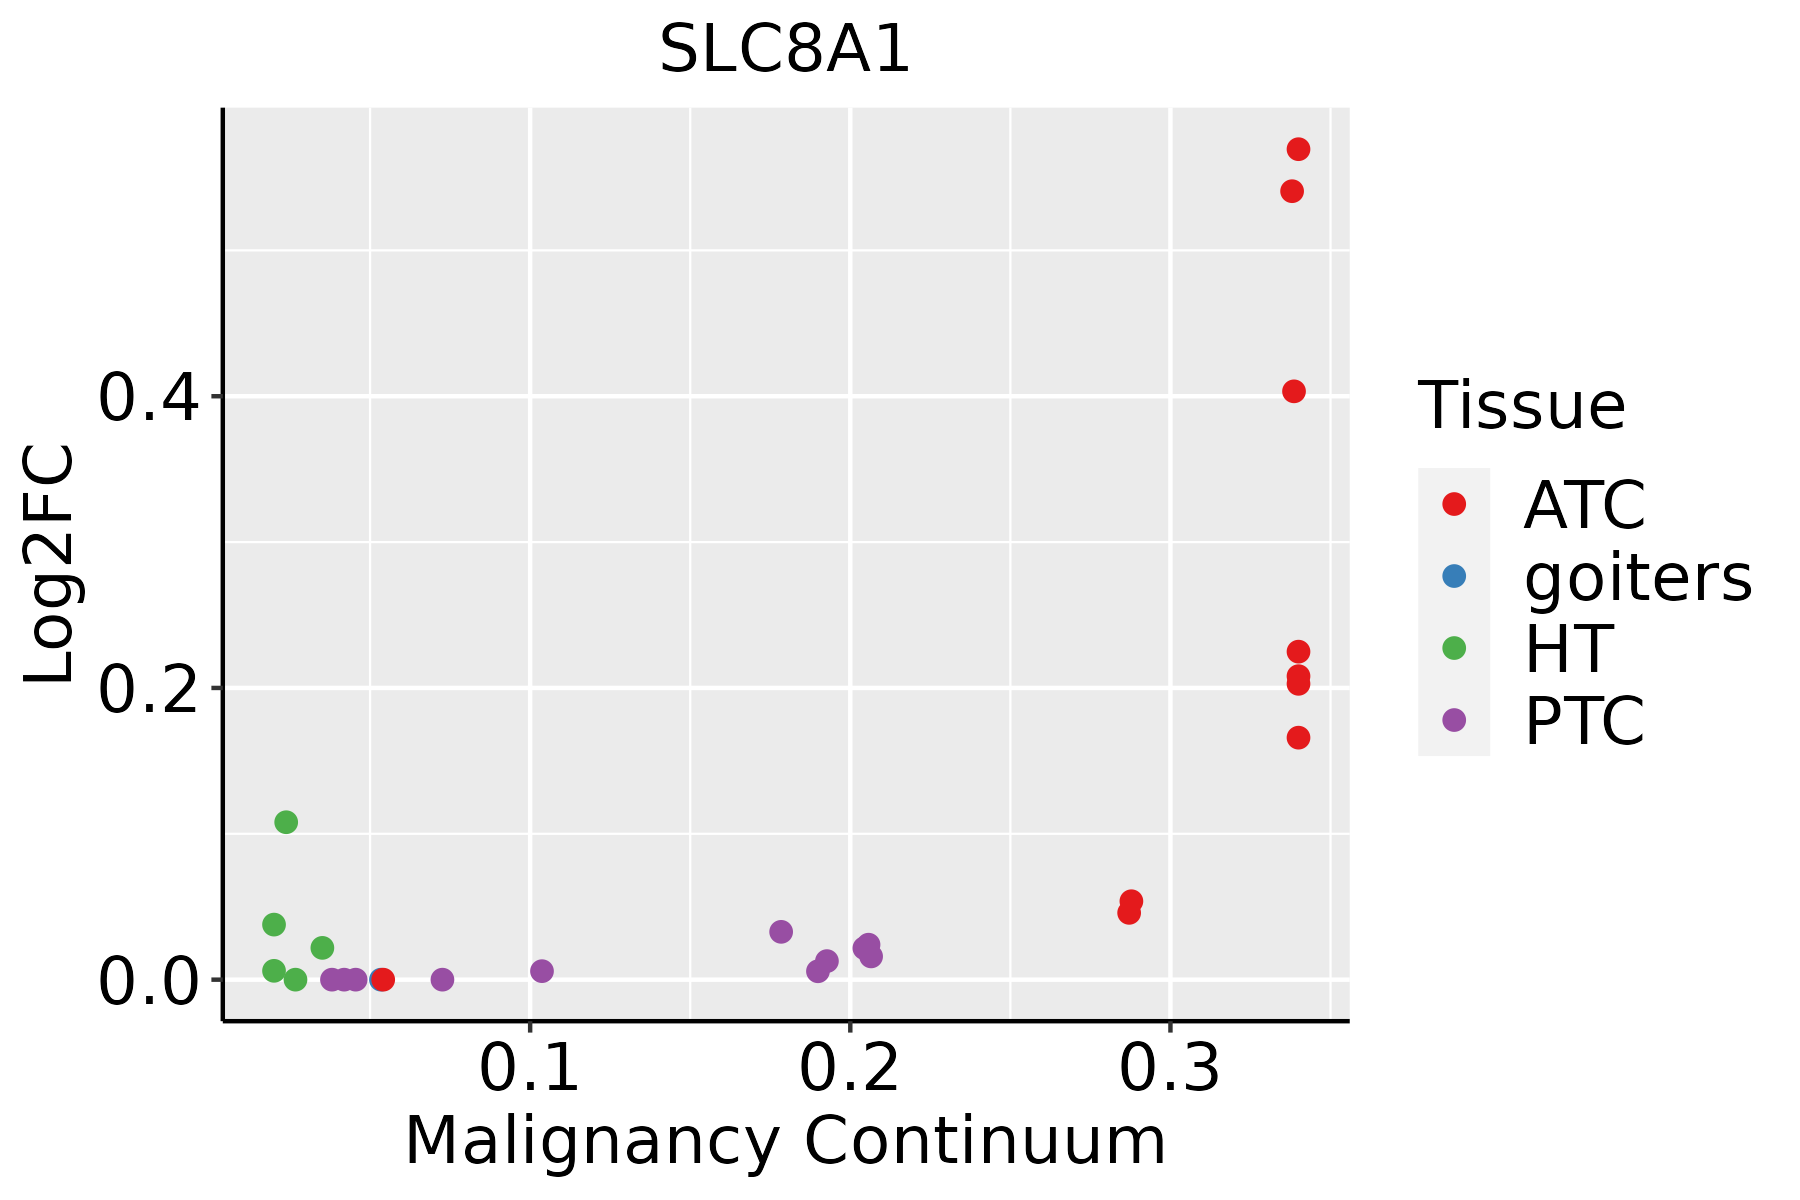 | ATC: Anaplastic thyroid cancer |
| HT: Hashimoto's thyroiditis | ||
| PTC: Papillary thyroid cancer |
| ∗log2FC in expression of this searched gene in stem-like cells from each diseased tissue sample relative to stem-like cells in normal samples in each tissue plotted against the malignancy continuum. Samples are colored based on if they are from different disease stage. |
Top |
Malignant transformation related pathway analysis |
| Find out the enriched GO biological processes and KEGG pathways involved in transition from healthy to precancer to cancer |
| Tissue | Disease Stage | Enriched GO biological Processes |
| Colorectum | AD |  |
| Colorectum | SER |  |
| Colorectum | MSS |  |
| Colorectum | MSI-H |  |
| Colorectum | FAP |  |
| ∗Top 15 enriched GO BP terms are showed in the bar plot of each disease state in each tissue. Each row represents a significant GO biological process which is colored according to the -log10(p.adjust). |
| Page: 1 2 3 4 5 6 7 8 9 |
| GO ID | Tissue | Disease Stage | Description | Gene Ratio | Bg Ratio | pvalue | p.adjust | Count |
| GO:000697934 | Thyroid | ATC | response to oxidative stress | 246/6293 | 446/18723 | 2.98e-21 | 6.09e-19 | 246 |
| GO:007048228 | Thyroid | ATC | response to oxygen levels | 193/6293 | 347/18723 | 1.83e-17 | 1.93e-15 | 193 |
| GO:001056334 | Thyroid | ATC | negative regulation of phosphorus metabolic process | 234/6293 | 442/18723 | 2.30e-17 | 2.31e-15 | 234 |
| GO:004593634 | Thyroid | ATC | negative regulation of phosphate metabolic process | 233/6293 | 441/18723 | 3.68e-17 | 3.47e-15 | 233 |
| GO:000193333 | Thyroid | ATC | negative regulation of protein phosphorylation | 186/6293 | 342/18723 | 1.43e-15 | 1.08e-13 | 186 |
| GO:003629328 | Thyroid | ATC | response to decreased oxygen levels | 177/6293 | 322/18723 | 1.81e-15 | 1.32e-13 | 177 |
| GO:004232634 | Thyroid | ATC | negative regulation of phosphorylation | 203/6293 | 385/18723 | 5.30e-15 | 3.53e-13 | 203 |
| GO:000166628 | Thyroid | ATC | response to hypoxia | 169/6293 | 307/18723 | 6.58e-15 | 4.12e-13 | 169 |
| GO:000030234 | Thyroid | ATC | response to reactive oxygen species | 128/6293 | 222/18723 | 1.38e-13 | 7.00e-12 | 128 |
| GO:004254233 | Thyroid | ATC | response to hydrogen peroxide | 92/6293 | 146/18723 | 3.12e-13 | 1.46e-11 | 92 |
| GO:000150332 | Thyroid | ATC | ossification | 206/6293 | 408/18723 | 9.23e-13 | 3.95e-11 | 206 |
| GO:005134834 | Thyroid | ATC | negative regulation of transferase activity | 144/6293 | 268/18723 | 7.63e-12 | 2.91e-10 | 144 |
| GO:000166731 | Thyroid | ATC | ameboidal-type cell migration | 228/6293 | 475/18723 | 3.72e-11 | 1.22e-09 | 228 |
| GO:007190025 | Thyroid | ATC | regulation of protein serine/threonine kinase activity | 176/6293 | 359/18723 | 8.35e-10 | 2.17e-08 | 176 |
| GO:000646925 | Thyroid | ATC | negative regulation of protein kinase activity | 114/6293 | 212/18723 | 1.06e-09 | 2.69e-08 | 114 |
| GO:003367325 | Thyroid | ATC | negative regulation of kinase activity | 122/6293 | 237/18723 | 9.19e-09 | 1.94e-07 | 122 |
| GO:007145325 | Thyroid | ATC | cellular response to oxygen levels | 94/6293 | 177/18723 | 6.62e-08 | 1.17e-06 | 94 |
| GO:0031667210 | Thyroid | ATC | response to nutrient levels | 212/6293 | 474/18723 | 2.37e-07 | 3.70e-06 | 212 |
| GO:003629425 | Thyroid | ATC | cellular response to decreased oxygen levels | 85/6293 | 161/18723 | 3.86e-07 | 5.65e-06 | 85 |
| GO:005123532 | Thyroid | ATC | maintenance of location | 152/6293 | 327/18723 | 7.84e-07 | 1.04e-05 | 152 |
| Page: 1 2 3 |
| Pathway ID | Tissue | Disease Stage | Description | Gene Ratio | Bg Ratio | pvalue | p.adjust | qvalue | Count |
| Page: 1 |
Top |
Cell-cell communication analysis |
| Identification of potential cell-cell interactions between two cell types and their ligand-receptor pairs for different disease states |
| Ligand | Receptor | LRpair | Pathway | Tissue | Disease Stage |
| Page: 1 |
Top |
Single-cell gene regulatory network inference analysis |
| Find out the significant the regulons (TFs) and the target genes of each regulon across cell types for different disease states |
| TF | Cell Type | Tissue | Disease Stage | Target Gene | RSS | Regulon Activity |
| ∗The dot plots of a searched regulon are shown for all cell subpopulations in each disease state of each tissue based on the regulon specific score inferred using pySCENIC and by calculating the average expression. |
| Page: 1 |
Top |
Somatic mutation of malignant transformation related genes |
| Annotation of somatic variants for genes involved in malignant transformation |
| Hugo Symbol | Variant Class | Variant Classification | dbSNP RS | HGVSc | HGVSp | HGVSp Short | SWISSPROT | BIOTYPE | SIFT | PolyPhen | Tumor Sample Barcode | Tissue | Histology | Sex | Age | Stage | Therapy Types | Drugs | Outcome |
| SLC8A1 | SNV | Missense_Mutation | rs760569632 | c.2287G>A | p.Asp763Asn | p.D763N | P32418 | protein_coding | tolerated(0.1) | benign(0.177) | TCGA-5L-AAT1-01 | Breast | breast invasive carcinoma | Female | <65 | III/IV | Hormone Therapy | letrozol | SD |
| SLC8A1 | SNV | Missense_Mutation | c.1936N>A | p.Gly646Ser | p.G646S | P32418 | protein_coding | tolerated(0.53) | benign(0.031) | TCGA-A8-A0A7-01 | Breast | breast invasive carcinoma | Female | <65 | I/II | Unknown | Unknown | SD | |
| SLC8A1 | SNV | Missense_Mutation | c.1936N>C | p.Gly646Arg | p.G646R | P32418 | protein_coding | tolerated(0.34) | benign(0.062) | TCGA-AC-A23H-01 | Breast | breast invasive carcinoma | Female | >=65 | I/II | Unknown | Unknown | PD | |
| SLC8A1 | SNV | Missense_Mutation | novel | c.292N>T | p.Arg98Trp | p.R98W | P32418 | protein_coding | deleterious(0) | probably_damaging(1) | TCGA-AN-A046-01 | Breast | breast invasive carcinoma | Female | >=65 | I/II | Unknown | Unknown | SD |
| SLC8A1 | SNV | Missense_Mutation | c.1437C>G | p.Ile479Met | p.I479M | P32418 | protein_coding | deleterious(0) | probably_damaging(0.997) | TCGA-AR-A0TX-01 | Breast | breast invasive carcinoma | Female | <65 | I/II | Unknown | Unknown | SD | |
| SLC8A1 | SNV | Missense_Mutation | c.1671N>T | p.Glu557Asp | p.E557D | P32418 | protein_coding | tolerated(0.2) | benign(0.039) | TCGA-AR-A251-01 | Breast | breast invasive carcinoma | Female | <65 | III/IV | Chemotherapy | doxorubicin | SD | |
| SLC8A1 | SNV | Missense_Mutation | c.128N>A | p.Gly43Glu | p.G43E | P32418 | protein_coding | tolerated(0.26) | benign(0.346) | TCGA-B6-A40C-01 | Breast | breast invasive carcinoma | Female | <65 | I/II | Hormone Therapy | cyclophosphamide | SD | |
| SLC8A1 | SNV | Missense_Mutation | c.1818A>G | p.Ile606Met | p.I606M | P32418 | protein_coding | deleterious(0) | probably_damaging(0.917) | TCGA-BH-A18G-01 | Breast | breast invasive carcinoma | Female | >=65 | I/II | Unknown | Unknown | SD | |
| SLC8A1 | SNV | Missense_Mutation | novel | c.1111N>T | p.Leu371Phe | p.L371F | P32418 | protein_coding | deleterious(0.04) | possibly_damaging(0.628) | TCGA-C8-A8HQ-01 | Breast | breast invasive carcinoma | Female | <65 | I/II | Unknown | Unknown | SD |
| SLC8A1 | SNV | Missense_Mutation | c.1352N>A | p.Ala451Glu | p.A451E | P32418 | protein_coding | deleterious(0) | probably_damaging(1) | TCGA-D8-A1X5-01 | Breast | breast invasive carcinoma | Female | >=65 | III/IV | Hormone Therapy | tamoxiphen | SD |
| Page: 1 2 3 4 5 6 7 8 9 10 11 12 13 14 15 16 17 18 19 20 21 22 23 |
Top |
Related drugs of malignant transformation related genes |
| Identification of chemicals and drugs interact with genes involved in malignant transfromation |
| (DGIdb 4.0) |
| Entrez ID | Symbol | Category | Interaction Types | Drug Claim Name | Drug Name | PMIDs |
| Page: 1 |

Copyright 2023-Present -The University of Texas Health Science Center at Houston |