
|
|||||
|
 | |
| |
| |
| |
| |
| |
|
Gene: SLC7A8 |
Gene summary for SLC7A8 |
| Gene information | Species | Human | Gene symbol | SLC7A8 | Gene ID | 23428 |
| Gene name | solute carrier family 7 member 8 | |
| Gene Alias | LAT2 | |
| Cytomap | 14q11.2 | |
| Gene Type | protein-coding | GO ID | GO:0003008 | UniProtAcc | Q9UHI5 |
Top |
Malignant transformation analysis |
| Identification of the aberrant gene expression in precancerous and cancerous lesions by comparing the gene expression of stem-like cells in diseased tissues with normal stem cells |
| Entrez ID | Symbol | Replicates | Species | Organ | Tissue | Adj P-value | Log2FC | Malignancy |
| 23428 | SLC7A8 | HTA11_347_2000001011 | Human | Colorectum | AD | 1.43e-02 | 1.72e-01 | -0.1954 |
| 23428 | SLC7A8 | HTA11_696_2000001011 | Human | Colorectum | AD | 4.75e-13 | 4.50e-01 | -0.1464 |
| 23428 | SLC7A8 | HTA11_1391_2000001011 | Human | Colorectum | AD | 1.52e-04 | 3.44e-01 | -0.059 |
| 23428 | SLC7A8 | HTA11_866_3004761011 | Human | Colorectum | AD | 5.54e-20 | 7.44e-01 | 0.096 |
| 23428 | SLC7A8 | HTA11_7696_3000711011 | Human | Colorectum | AD | 1.82e-10 | 3.38e-01 | 0.0674 |
| 23428 | SLC7A8 | HTA11_6818_2000001011 | Human | Colorectum | AD | 1.14e-02 | 4.28e-01 | 0.0112 |
| 23428 | SLC7A8 | HTA11_99999970781_79442 | Human | Colorectum | MSS | 1.13e-07 | 3.04e-01 | 0.294 |
| 23428 | SLC7A8 | HTA11_99999965104_69814 | Human | Colorectum | MSS | 2.53e-04 | 3.61e-01 | 0.281 |
| 23428 | SLC7A8 | HTA11_99999971662_82457 | Human | Colorectum | MSS | 1.22e-20 | 6.12e-01 | 0.3859 |
| 23428 | SLC7A8 | HTA11_99999974143_84620 | Human | Colorectum | MSS | 5.03e-13 | 3.90e-01 | 0.3005 |
| 23428 | SLC7A8 | A002-C-021 | Human | Colorectum | FAP | 6.70e-05 | 2.83e-01 | 0.1171 |
| 23428 | SLC7A8 | CRC-1-8810 | Human | Colorectum | CRC | 5.65e-04 | 3.20e-01 | 0.6257 |
| 23428 | SLC7A8 | LZE2T | Human | Esophagus | ESCC | 1.79e-02 | 6.65e-01 | 0.082 |
| 23428 | SLC7A8 | LZE4T | Human | Esophagus | ESCC | 5.73e-30 | 1.25e+00 | 0.0811 |
| 23428 | SLC7A8 | LZE7T | Human | Esophagus | ESCC | 1.24e-02 | 6.12e-02 | 0.0667 |
| 23428 | SLC7A8 | LZE21T | Human | Esophagus | ESCC | 1.52e-08 | 6.55e-01 | 0.0655 |
| 23428 | SLC7A8 | P2T-E | Human | Esophagus | ESCC | 1.28e-10 | 1.73e-01 | 0.1177 |
| 23428 | SLC7A8 | P4T-E | Human | Esophagus | ESCC | 1.34e-23 | 5.25e-01 | 0.1323 |
| 23428 | SLC7A8 | P5T-E | Human | Esophagus | ESCC | 8.76e-12 | 2.35e-01 | 0.1327 |
| 23428 | SLC7A8 | P8T-E | Human | Esophagus | ESCC | 2.08e-15 | 5.05e-02 | 0.0889 |
| Page: 1 2 3 4 5 |
| Tissue | Expression Dynamics | Abbreviation |
| Colorectum (GSE201348) |  | FAP: Familial adenomatous polyposis |
| CRC: Colorectal cancer | ||
| Colorectum (HTA11) |  | AD: Adenomas |
| SER: Sessile serrated lesions | ||
| MSI-H: Microsatellite-high colorectal cancer | ||
| MSS: Microsatellite stable colorectal cancer | ||
| Esophagus |  | ESCC: Esophageal squamous cell carcinoma |
| HGIN: High-grade intraepithelial neoplasias | ||
| LGIN: Low-grade intraepithelial neoplasias | ||
| Oral Cavity |  | EOLP: Erosive Oral lichen planus |
| LP: leukoplakia | ||
| NEOLP: Non-erosive oral lichen planus | ||
| OSCC: Oral squamous cell carcinoma | ||
| Prostate |  | BPH: Benign Prostatic Hyperplasia |
| Skin |  | AK: Actinic keratosis |
| cSCC: Cutaneous squamous cell carcinoma | ||
| SCCIS:squamous cell carcinoma in situ | ||
| Thyroid | 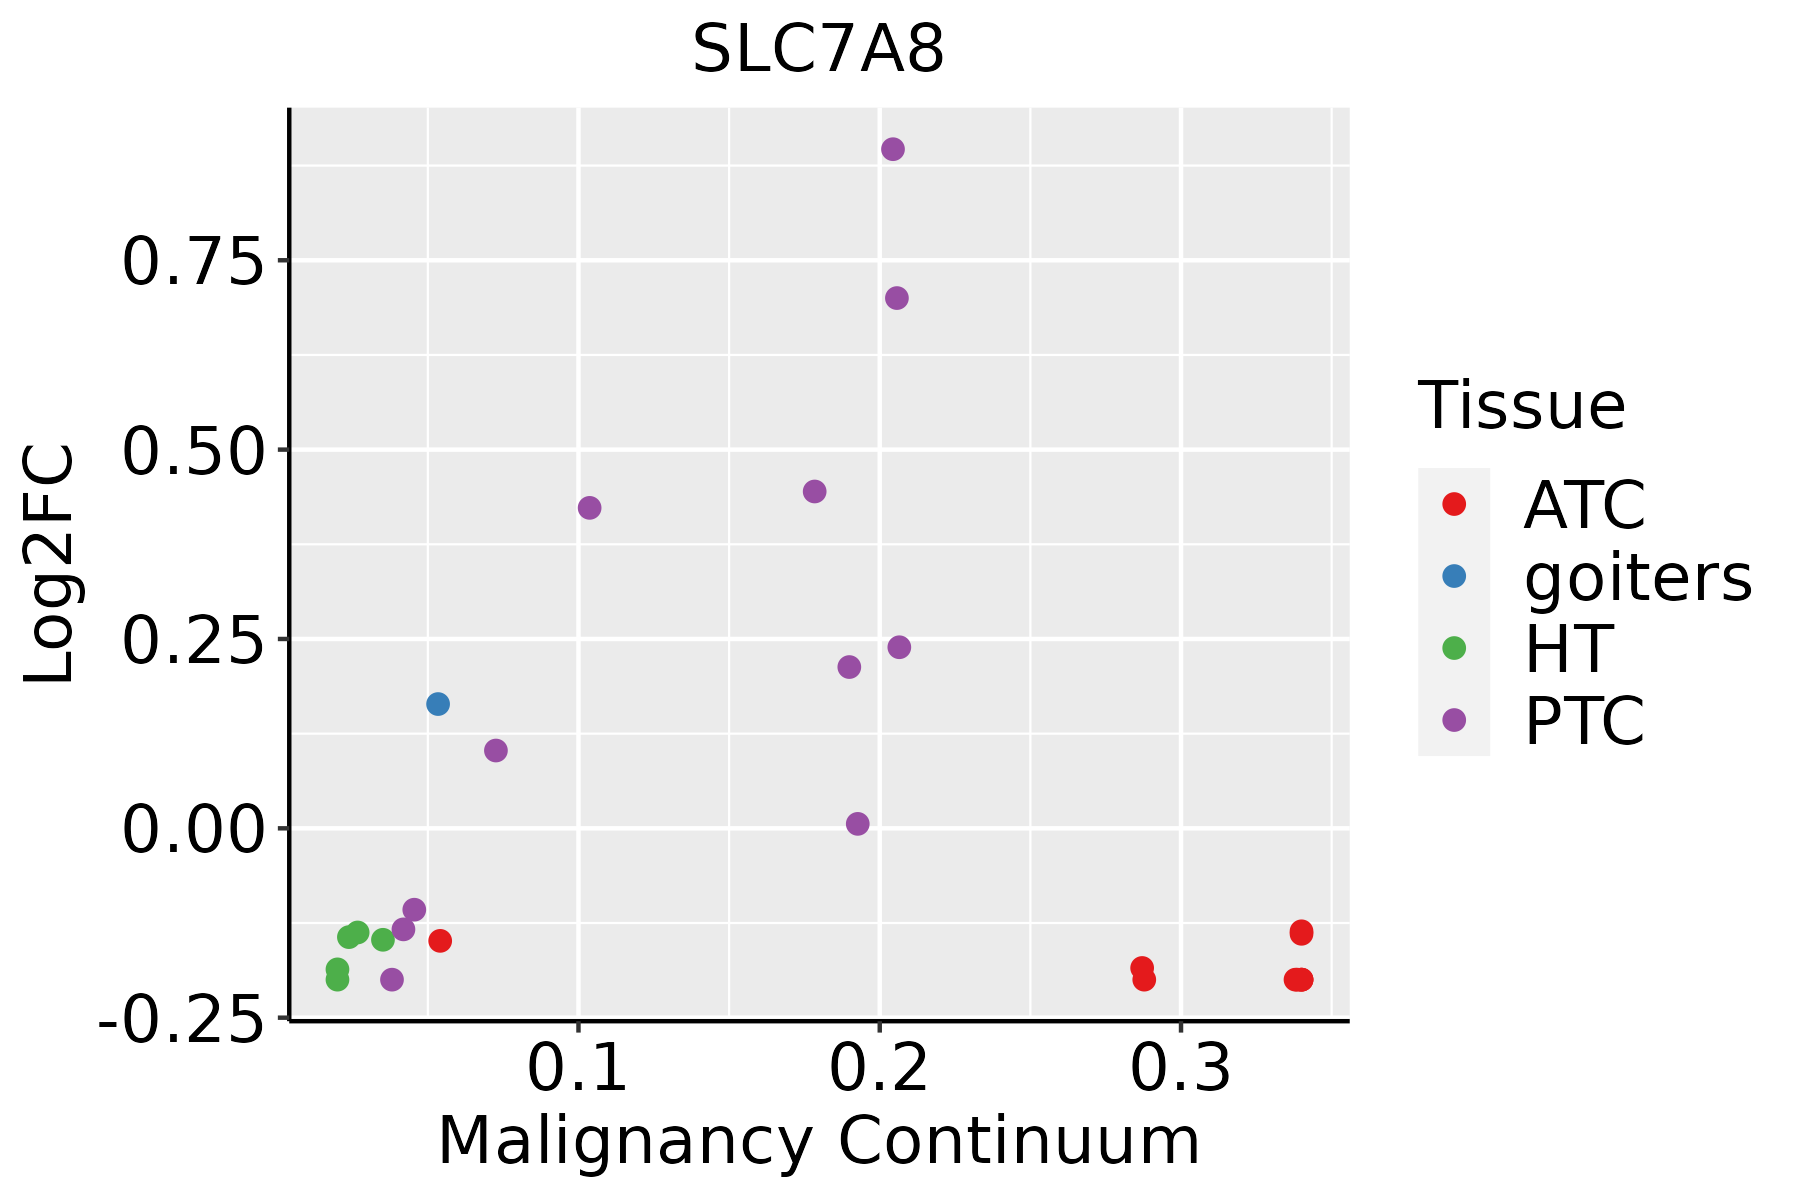 | ATC: Anaplastic thyroid cancer |
| HT: Hashimoto's thyroiditis | ||
| PTC: Papillary thyroid cancer |
| ∗log2FC in expression of this searched gene in stem-like cells from each diseased tissue sample relative to stem-like cells in normal samples in each tissue plotted against the malignancy continuum. Samples are colored based on if they are from different disease stage. |
Top |
Malignant transformation related pathway analysis |
| Find out the enriched GO biological processes and KEGG pathways involved in transition from healthy to precancer to cancer |
| Tissue | Disease Stage | Enriched GO biological Processes |
| Colorectum | AD |  |
| Colorectum | SER |  |
| Colorectum | MSS |  |
| Colorectum | MSI-H |  |
| Colorectum | FAP |  |
| ∗Top 15 enriched GO BP terms are showed in the bar plot of each disease state in each tissue. Each row represents a significant GO biological process which is colored according to the -log10(p.adjust). |
| Page: 1 2 3 4 5 6 7 8 9 |
| GO ID | Tissue | Disease Stage | Description | Gene Ratio | Bg Ratio | pvalue | p.adjust | Count |
| GO:0009636 | Colorectum | AD | response to toxic substance | 88/3918 | 262/18723 | 1.12e-06 | 3.72e-05 | 88 |
| GO:00096362 | Colorectum | MSS | response to toxic substance | 73/3467 | 262/18723 | 1.26e-04 | 1.94e-03 | 73 |
| GO:0150104 | Colorectum | MSS | transport across blood-brain barrier | 28/3467 | 87/18723 | 1.54e-03 | 1.41e-02 | 28 |
| GO:0010232 | Colorectum | MSS | vascular transport | 28/3467 | 88/18723 | 1.87e-03 | 1.64e-02 | 28 |
| GO:01501041 | Colorectum | FAP | transport across blood-brain barrier | 25/2622 | 87/18723 | 2.63e-04 | 3.59e-03 | 25 |
| GO:00102321 | Colorectum | FAP | vascular transport | 25/2622 | 88/18723 | 3.19e-04 | 4.12e-03 | 25 |
| GO:0003018 | Colorectum | FAP | vascular process in circulatory system | 56/2622 | 263/18723 | 7.67e-04 | 8.12e-03 | 56 |
| GO:00096363 | Colorectum | FAP | response to toxic substance | 53/2622 | 262/18723 | 3.35e-03 | 2.46e-02 | 53 |
| GO:00030181 | Colorectum | CRC | vascular process in circulatory system | 45/2078 | 263/18723 | 2.10e-03 | 2.08e-02 | 45 |
| GO:01501042 | Colorectum | CRC | transport across blood-brain barrier | 18/2078 | 87/18723 | 6.50e-03 | 4.69e-02 | 18 |
| GO:000963620 | Esophagus | ESCC | response to toxic substance | 150/8552 | 262/18723 | 1.00e-04 | 7.12e-04 | 150 |
| GO:19019987 | Esophagus | ESCC | toxin transport | 28/8552 | 40/18723 | 1.61e-03 | 7.50e-03 | 28 |
| GO:000963618 | Oral cavity | OSCC | response to toxic substance | 137/7305 | 262/18723 | 7.94e-06 | 8.52e-05 | 137 |
| GO:19019986 | Oral cavity | OSCC | toxin transport | 25/7305 | 40/18723 | 2.22e-03 | 1.00e-02 | 25 |
| GO:190199812 | Oral cavity | LP | toxin transport | 19/4623 | 40/18723 | 1.44e-03 | 1.14e-02 | 19 |
| GO:000963619 | Oral cavity | LP | response to toxic substance | 86/4623 | 262/18723 | 1.74e-03 | 1.32e-02 | 86 |
| GO:000963617 | Prostate | Tumor | response to toxic substance | 70/3246 | 262/18723 | 8.76e-05 | 8.66e-04 | 70 |
| GO:190199811 | Prostate | Tumor | toxin transport | 16/3246 | 40/18723 | 5.99e-04 | 4.29e-03 | 16 |
| GO:00030183 | Prostate | Tumor | vascular process in circulatory system | 61/3246 | 263/18723 | 8.88e-03 | 3.84e-02 | 61 |
| GO:000963626 | Skin | AK | response to toxic substance | 42/1910 | 262/18723 | 2.11e-03 | 1.40e-02 | 42 |
| Page: 1 2 |
| Pathway ID | Tissue | Disease Stage | Description | Gene Ratio | Bg Ratio | pvalue | p.adjust | qvalue | Count |
| Page: 1 |
Top |
Cell-cell communication analysis |
| Identification of potential cell-cell interactions between two cell types and their ligand-receptor pairs for different disease states |
| Ligand | Receptor | LRpair | Pathway | Tissue | Disease Stage |
| Page: 1 |
Top |
Single-cell gene regulatory network inference analysis |
| Find out the significant the regulons (TFs) and the target genes of each regulon across cell types for different disease states |
| TF | Cell Type | Tissue | Disease Stage | Target Gene | RSS | Regulon Activity |
| ∗The dot plots of a searched regulon are shown for all cell subpopulations in each disease state of each tissue based on the regulon specific score inferred using pySCENIC and by calculating the average expression. |
| Page: 1 |
Top |
Somatic mutation of malignant transformation related genes |
| Annotation of somatic variants for genes involved in malignant transformation |
| Hugo Symbol | Variant Class | Variant Classification | dbSNP RS | HGVSc | HGVSp | HGVSp Short | SWISSPROT | BIOTYPE | SIFT | PolyPhen | Tumor Sample Barcode | Tissue | Histology | Sex | Age | Stage | Therapy Types | Drugs | Outcome |
| SLC7A8 | SNV | Missense_Mutation | novel | c.1082N>C | p.Arg361Pro | p.R361P | Q9UHI5 | protein_coding | deleterious(0.01) | possibly_damaging(0.826) | TCGA-A8-A07U-01 | Breast | breast invasive carcinoma | Female | >=65 | III/IV | Chemotherapy | 5-fluorouracil | SD |
| SLC7A8 | insertion | Frame_Shift_Ins | novel | c.1031_1032insGCACAGGGAAGGTGGGAAGGCTGGGGCCTTCATA | p.Ala345HisfsTer82 | p.A345Hfs*82 | Q9UHI5 | protein_coding | TCGA-A2-A0CQ-01 | Breast | breast invasive carcinoma | Female | <65 | I/II | Chemotherapy | adriamycin | SD | ||
| SLC7A8 | insertion | Frame_Shift_Ins | novel | c.1080_1081insACCCTATCTGTTCACCAGGGACCCAAAATCCAAGGGGATGCTT | p.Arg361ThrfsTer69 | p.R361Tfs*69 | Q9UHI5 | protein_coding | TCGA-A8-A07U-01 | Breast | breast invasive carcinoma | Female | >=65 | III/IV | Chemotherapy | 5-fluorouracil | SD | ||
| SLC7A8 | SNV | Missense_Mutation | novel | c.1489G>C | p.Glu497Gln | p.E497Q | Q9UHI5 | protein_coding | tolerated(0.61) | benign(0) | TCGA-XS-A8TJ-01 | Cervix | cervical & endocervical cancer | Female | <65 | I/II | Chemotherapy | cisplatin | SD |
| SLC7A8 | insertion | Frame_Shift_Ins | novel | c.1490dupA | p.Val498GlyfsTer11 | p.V498Gfs*11 | Q9UHI5 | protein_coding | TCGA-XS-A8TJ-01 | Cervix | cervical & endocervical cancer | Female | <65 | I/II | Chemotherapy | cisplatin | SD | ||
| SLC7A8 | SNV | Missense_Mutation | rs540015976 | c.541N>T | p.Arg181Trp | p.R181W | Q9UHI5 | protein_coding | deleterious(0) | probably_damaging(1) | TCGA-A6-2672-01 | Colorectum | colon adenocarcinoma | Female | >=65 | III/IV | Unknown | Unknown | SD |
| SLC7A8 | SNV | Missense_Mutation | rs763323196 | c.1253G>A | p.Arg418His | p.R418H | Q9UHI5 | protein_coding | deleterious(0) | probably_damaging(0.998) | TCGA-AA-3814-01 | Colorectum | colon adenocarcinoma | Female | >=65 | I/II | Unknown | Unknown | SD |
| SLC7A8 | SNV | Missense_Mutation | c.316N>A | p.Asp106Asn | p.D106N | Q9UHI5 | protein_coding | tolerated(0.06) | probably_damaging(0.914) | TCGA-CK-4951-01 | Colorectum | colon adenocarcinoma | Female | >=65 | I/II | Unknown | Unknown | PD | |
| SLC7A8 | SNV | Missense_Mutation | c.1540N>G | p.Gln514Glu | p.Q514E | Q9UHI5 | protein_coding | tolerated(0.66) | benign(0) | TCGA-G4-6628-01 | Colorectum | colon adenocarcinoma | Male | >=65 | I/II | Unknown | Unknown | SD | |
| SLC7A8 | SNV | Missense_Mutation | novel | c.1361C>T | p.Ala454Val | p.A454V | Q9UHI5 | protein_coding | tolerated(1) | benign(0.1) | TCGA-A5-A0G2-01 | Endometrium | uterine corpus endometrioid carcinoma | Female | <65 | III/IV | Unknown | Unknown | SD |
| Page: 1 2 3 4 5 |
Top |
Related drugs of malignant transformation related genes |
| Identification of chemicals and drugs interact with genes involved in malignant transfromation |
| (DGIdb 4.0) |
| Entrez ID | Symbol | Category | Interaction Types | Drug Claim Name | Drug Name | PMIDs |
| Page: 1 |

Copyright 2023-Present -The University of Texas Health Science Center at Houston |