
|
|||||
|
 | |
| |
| |
| |
| |
| |
|
Gene: SLC7A6OS |
Gene summary for SLC7A6OS |
| Gene information | Species | Human | Gene symbol | SLC7A6OS | Gene ID | 84138 |
| Gene name | solute carrier family 7 member 6 opposite strand | |
| Gene Alias | EPM12 | |
| Cytomap | 16q22.1 | |
| Gene Type | protein-coding | GO ID | GO:0002244 | UniProtAcc | Q96CW6 |
Top |
Malignant transformation analysis |
| Identification of the aberrant gene expression in precancerous and cancerous lesions by comparing the gene expression of stem-like cells in diseased tissues with normal stem cells |
| Entrez ID | Symbol | Replicates | Species | Organ | Tissue | Adj P-value | Log2FC | Malignancy |
| 84138 | SLC7A6OS | LZE4T | Human | Esophagus | ESCC | 3.48e-14 | 3.84e-01 | 0.0811 |
| 84138 | SLC7A6OS | LZE7T | Human | Esophagus | ESCC | 9.65e-09 | 2.35e-01 | 0.0667 |
| 84138 | SLC7A6OS | LZE8T | Human | Esophagus | ESCC | 5.97e-03 | 9.02e-02 | 0.067 |
| 84138 | SLC7A6OS | LZE20T | Human | Esophagus | ESCC | 1.29e-04 | 1.11e-01 | 0.0662 |
| 84138 | SLC7A6OS | LZE24T | Human | Esophagus | ESCC | 1.41e-13 | 2.86e-01 | 0.0596 |
| 84138 | SLC7A6OS | LZE6T | Human | Esophagus | ESCC | 3.23e-03 | 1.25e-01 | 0.0845 |
| 84138 | SLC7A6OS | P1T-E | Human | Esophagus | ESCC | 6.96e-08 | 3.67e-01 | 0.0875 |
| 84138 | SLC7A6OS | P2T-E | Human | Esophagus | ESCC | 1.33e-15 | 3.01e-01 | 0.1177 |
| 84138 | SLC7A6OS | P4T-E | Human | Esophagus | ESCC | 7.10e-20 | 4.34e-01 | 0.1323 |
| 84138 | SLC7A6OS | P5T-E | Human | Esophagus | ESCC | 5.82e-12 | 2.63e-01 | 0.1327 |
| 84138 | SLC7A6OS | P8T-E | Human | Esophagus | ESCC | 1.24e-21 | 3.13e-01 | 0.0889 |
| 84138 | SLC7A6OS | P9T-E | Human | Esophagus | ESCC | 7.01e-04 | 7.69e-02 | 0.1131 |
| 84138 | SLC7A6OS | P10T-E | Human | Esophagus | ESCC | 2.18e-14 | 2.75e-01 | 0.116 |
| 84138 | SLC7A6OS | P11T-E | Human | Esophagus | ESCC | 3.88e-09 | 3.58e-01 | 0.1426 |
| 84138 | SLC7A6OS | P12T-E | Human | Esophagus | ESCC | 1.80e-09 | 1.57e-01 | 0.1122 |
| 84138 | SLC7A6OS | P15T-E | Human | Esophagus | ESCC | 2.27e-16 | 3.00e-01 | 0.1149 |
| 84138 | SLC7A6OS | P16T-E | Human | Esophagus | ESCC | 4.05e-19 | 2.16e-01 | 0.1153 |
| 84138 | SLC7A6OS | P19T-E | Human | Esophagus | ESCC | 1.25e-02 | 2.83e-01 | 0.1662 |
| 84138 | SLC7A6OS | P20T-E | Human | Esophagus | ESCC | 1.51e-20 | 3.05e-01 | 0.1124 |
| 84138 | SLC7A6OS | P21T-E | Human | Esophagus | ESCC | 3.76e-22 | 4.52e-01 | 0.1617 |
| Page: 1 2 3 4 5 |
| Tissue | Expression Dynamics | Abbreviation |
| Esophagus | 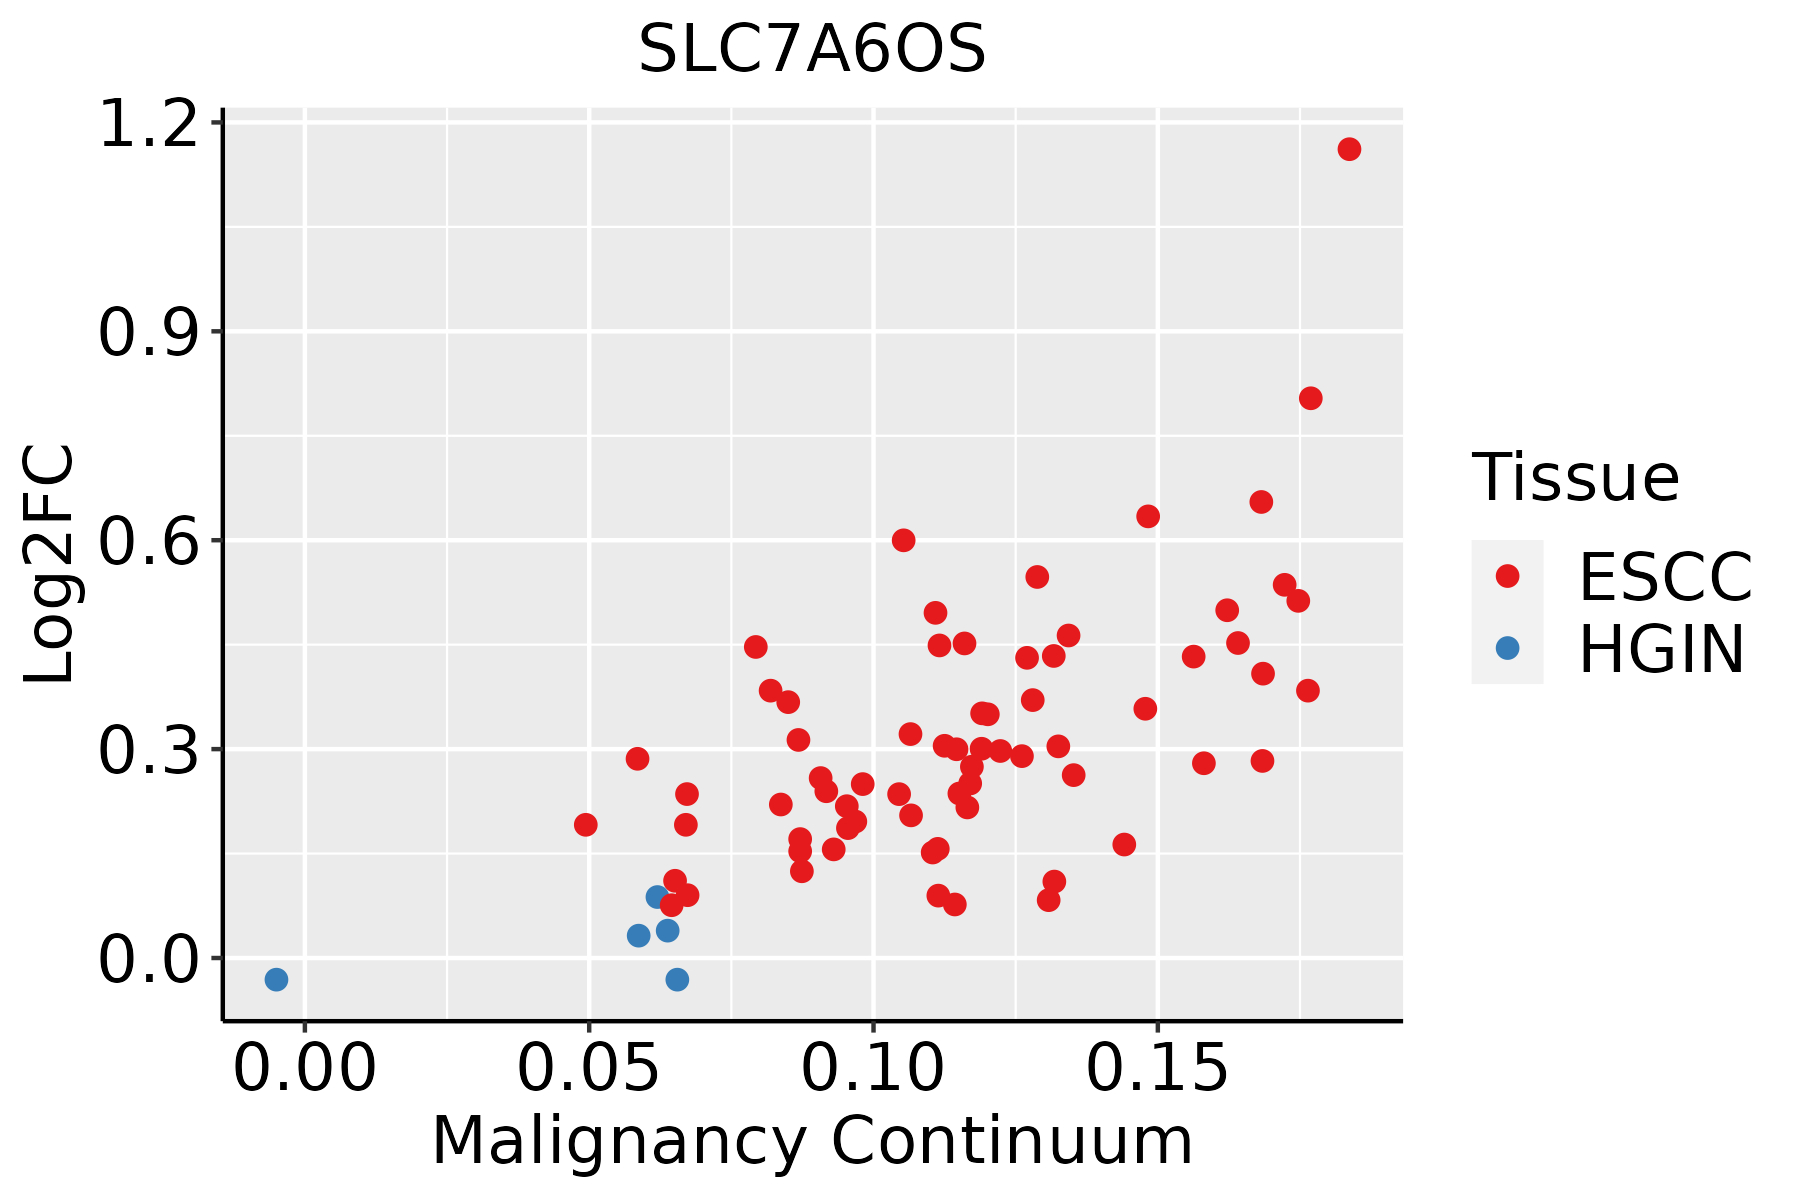 | ESCC: Esophageal squamous cell carcinoma |
| HGIN: High-grade intraepithelial neoplasias | ||
| LGIN: Low-grade intraepithelial neoplasias | ||
| Liver |  | HCC: Hepatocellular carcinoma |
| NAFLD: Non-alcoholic fatty liver disease | ||
| Oral Cavity |  | EOLP: Erosive Oral lichen planus |
| LP: leukoplakia | ||
| NEOLP: Non-erosive oral lichen planus | ||
| OSCC: Oral squamous cell carcinoma |
| ∗log2FC in expression of this searched gene in stem-like cells from each diseased tissue sample relative to stem-like cells in normal samples in each tissue plotted against the malignancy continuum. Samples are colored based on if they are from different disease stage. |
Top |
Malignant transformation related pathway analysis |
| Find out the enriched GO biological processes and KEGG pathways involved in transition from healthy to precancer to cancer |
| Tissue | Disease Stage | Enriched GO biological Processes |
| Colorectum | AD |  |
| Colorectum | SER |  |
| Colorectum | MSS |  |
| Colorectum | MSI-H |  |
| Colorectum | FAP |  |
| ∗Top 15 enriched GO BP terms are showed in the bar plot of each disease state in each tissue. Each row represents a significant GO biological process which is colored according to the -log10(p.adjust). |
| Page: 1 2 3 4 5 6 7 8 9 |
| GO ID | Tissue | Disease Stage | Description | Gene Ratio | Bg Ratio | pvalue | p.adjust | Count |
| GO:00022446 | Esophagus | ESCC | hematopoietic progenitor cell differentiation | 66/8552 | 114/18723 | 5.74e-03 | 2.13e-02 | 66 |
| GO:00022445 | Oral cavity | OSCC | hematopoietic progenitor cell differentiation | 57/7305 | 114/18723 | 1.09e-02 | 3.71e-02 | 57 |
| Page: 1 |
| Pathway ID | Tissue | Disease Stage | Description | Gene Ratio | Bg Ratio | pvalue | p.adjust | qvalue | Count |
| Page: 1 |
Top |
Cell-cell communication analysis |
| Identification of potential cell-cell interactions between two cell types and their ligand-receptor pairs for different disease states |
| Ligand | Receptor | LRpair | Pathway | Tissue | Disease Stage |
| Page: 1 |
Top |
Single-cell gene regulatory network inference analysis |
| Find out the significant the regulons (TFs) and the target genes of each regulon across cell types for different disease states |
| TF | Cell Type | Tissue | Disease Stage | Target Gene | RSS | Regulon Activity |
| ∗The dot plots of a searched regulon are shown for all cell subpopulations in each disease state of each tissue based on the regulon specific score inferred using pySCENIC and by calculating the average expression. |
| Page: 1 |
Top |
Somatic mutation of malignant transformation related genes |
| Annotation of somatic variants for genes involved in malignant transformation |
| Hugo Symbol | Variant Class | Variant Classification | dbSNP RS | HGVSc | HGVSp | HGVSp Short | SWISSPROT | BIOTYPE | SIFT | PolyPhen | Tumor Sample Barcode | Tissue | Histology | Sex | Age | Stage | Therapy Types | Drugs | Outcome |
| SLC7A6OS | SNV | Missense_Mutation | novel | c.377N>A | p.Gly126Glu | p.G126E | Q96CW6 | protein_coding | tolerated(0.86) | benign(0.003) | TCGA-A7-A6VV-01 | Breast | breast invasive carcinoma | Female | <65 | I/II | Chemotherapy | cyclophosphamide | CR |
| SLC7A6OS | SNV | Missense_Mutation | novel | c.662G>T | p.Ser221Ile | p.S221I | Q96CW6 | protein_coding | tolerated(0.07) | possibly_damaging(0.503) | TCGA-A8-A06Z-01 | Breast | breast invasive carcinoma | Female | >=65 | I/II | Unknown | Unknown | SD |
| SLC7A6OS | SNV | Missense_Mutation | c.853C>G | p.Arg285Gly | p.R285G | Q96CW6 | protein_coding | deleterious(0.05) | benign(0.099) | TCGA-A8-A09I-01 | Breast | breast invasive carcinoma | Female | >=65 | I/II | Hormone Therapy | anastrozole | SD | |
| SLC7A6OS | SNV | Missense_Mutation | novel | c.925N>A | p.Asp309Asn | p.D309N | Q96CW6 | protein_coding | deleterious(0) | probably_damaging(0.948) | TCGA-AR-A1AH-01 | Breast | breast invasive carcinoma | Female | <65 | I/II | Unspecific | PD | |
| SLC7A6OS | insertion | Nonsense_Mutation | novel | c.491_492insGCCTTTTAGGAACCTGACTTTATAGTACAGGGAATTTGGGGAAAGATC | p.Ile164delinsMetProPheArgAsnLeuThrLeuTerTyrArgGluPheGlyGluArgSer | p.I164delinsMPFRNLTL*YREFGERS | Q96CW6 | protein_coding | TCGA-AN-A0FN-01 | Breast | breast invasive carcinoma | Female | <65 | I/II | Unknown | Unknown | SD | ||
| SLC7A6OS | SNV | Missense_Mutation | c.430N>C | p.Glu144Gln | p.E144Q | Q96CW6 | protein_coding | deleterious(0.03) | probably_damaging(0.999) | TCGA-JW-A5VL-01 | Cervix | cervical & endocervical cancer | Female | <65 | I/II | Unknown | Unknown | SD | |
| SLC7A6OS | SNV | Missense_Mutation | novel | c.188N>T | p.Ser63Phe | p.S63F | Q96CW6 | protein_coding | deleterious(0) | probably_damaging(0.988) | TCGA-MY-A913-01 | Cervix | cervical & endocervical cancer | Female | <65 | I/II | Chemotherapy | cisplatin | CR |
| SLC7A6OS | SNV | Missense_Mutation | novel | c.596N>G | p.Asp199Gly | p.D199G | Q96CW6 | protein_coding | deleterious(0) | probably_damaging(0.999) | TCGA-AZ-4315-01 | Colorectum | colon adenocarcinoma | Male | <65 | I/II | Unknown | Unknown | SD |
| SLC7A6OS | SNV | Missense_Mutation | rs865978522 | c.913N>A | p.Asp305Asn | p.D305N | Q96CW6 | protein_coding | deleterious(0.04) | possibly_damaging(0.811) | TCGA-B5-A3FC-01 | Endometrium | uterine corpus endometrioid carcinoma | Female | <65 | I/II | Unknown | Unknown | SD |
| SLC7A6OS | SNV | Missense_Mutation | rs778260157 | c.517N>T | p.Arg173Cys | p.R173C | Q96CW6 | protein_coding | deleterious(0) | probably_damaging(1) | TCGA-B5-A3FC-01 | Endometrium | uterine corpus endometrioid carcinoma | Female | <65 | I/II | Unknown | Unknown | SD |
| Page: 1 2 |
Top |
Related drugs of malignant transformation related genes |
| Identification of chemicals and drugs interact with genes involved in malignant transfromation |
| (DGIdb 4.0) |
| Entrez ID | Symbol | Category | Interaction Types | Drug Claim Name | Drug Name | PMIDs |
| Page: 1 |

Copyright 2023-Present -The University of Texas Health Science Center at Houston |