
|
|||||
|
 | |
| |
| |
| |
| |
| |
|
Gene: SLC7A6 |
Gene summary for SLC7A6 |
| Gene information | Species | Human | Gene symbol | SLC7A6 | Gene ID | 9057 |
| Gene name | solute carrier family 7 member 6 | |
| Gene Alias | LAT-2 | |
| Cytomap | 16q22.1 | |
| Gene Type | protein-coding | GO ID | GO:0003333 | UniProtAcc | A0A024R719 |
Top |
Malignant transformation analysis |
| Identification of the aberrant gene expression in precancerous and cancerous lesions by comparing the gene expression of stem-like cells in diseased tissues with normal stem cells |
| Entrez ID | Symbol | Replicates | Species | Organ | Tissue | Adj P-value | Log2FC | Malignancy |
| 9057 | SLC7A6 | LZE4T | Human | Esophagus | ESCC | 5.48e-08 | 1.64e-01 | 0.0811 |
| 9057 | SLC7A6 | LZE5T | Human | Esophagus | ESCC | 4.85e-02 | 3.24e-01 | 0.0514 |
| 9057 | SLC7A6 | LZE7T | Human | Esophagus | ESCC | 3.12e-08 | 3.92e-01 | 0.0667 |
| 9057 | SLC7A6 | LZE24T | Human | Esophagus | ESCC | 8.52e-07 | 2.21e-01 | 0.0596 |
| 9057 | SLC7A6 | P2T-E | Human | Esophagus | ESCC | 7.69e-07 | 1.44e-01 | 0.1177 |
| 9057 | SLC7A6 | P4T-E | Human | Esophagus | ESCC | 1.99e-14 | 2.72e-01 | 0.1323 |
| 9057 | SLC7A6 | P5T-E | Human | Esophagus | ESCC | 6.03e-06 | 1.65e-01 | 0.1327 |
| 9057 | SLC7A6 | P8T-E | Human | Esophagus | ESCC | 1.16e-16 | 2.81e-01 | 0.0889 |
| 9057 | SLC7A6 | P10T-E | Human | Esophagus | ESCC | 5.37e-11 | 1.63e-01 | 0.116 |
| 9057 | SLC7A6 | P11T-E | Human | Esophagus | ESCC | 2.26e-08 | 3.11e-01 | 0.1426 |
| 9057 | SLC7A6 | P12T-E | Human | Esophagus | ESCC | 2.11e-10 | 8.54e-02 | 0.1122 |
| 9057 | SLC7A6 | P15T-E | Human | Esophagus | ESCC | 6.78e-04 | 1.37e-01 | 0.1149 |
| 9057 | SLC7A6 | P16T-E | Human | Esophagus | ESCC | 5.87e-05 | 8.99e-02 | 0.1153 |
| 9057 | SLC7A6 | P19T-E | Human | Esophagus | ESCC | 5.65e-04 | 2.44e-01 | 0.1662 |
| 9057 | SLC7A6 | P20T-E | Human | Esophagus | ESCC | 3.89e-08 | 1.33e-01 | 0.1124 |
| 9057 | SLC7A6 | P21T-E | Human | Esophagus | ESCC | 9.78e-21 | 4.63e-01 | 0.1617 |
| 9057 | SLC7A6 | P22T-E | Human | Esophagus | ESCC | 8.25e-09 | 1.35e-01 | 0.1236 |
| 9057 | SLC7A6 | P23T-E | Human | Esophagus | ESCC | 1.01e-09 | 2.92e-01 | 0.108 |
| 9057 | SLC7A6 | P24T-E | Human | Esophagus | ESCC | 2.45e-05 | 1.44e-01 | 0.1287 |
| 9057 | SLC7A6 | P26T-E | Human | Esophagus | ESCC | 1.03e-13 | 1.88e-01 | 0.1276 |
| Page: 1 2 3 4 |
| Tissue | Expression Dynamics | Abbreviation |
| Esophagus | 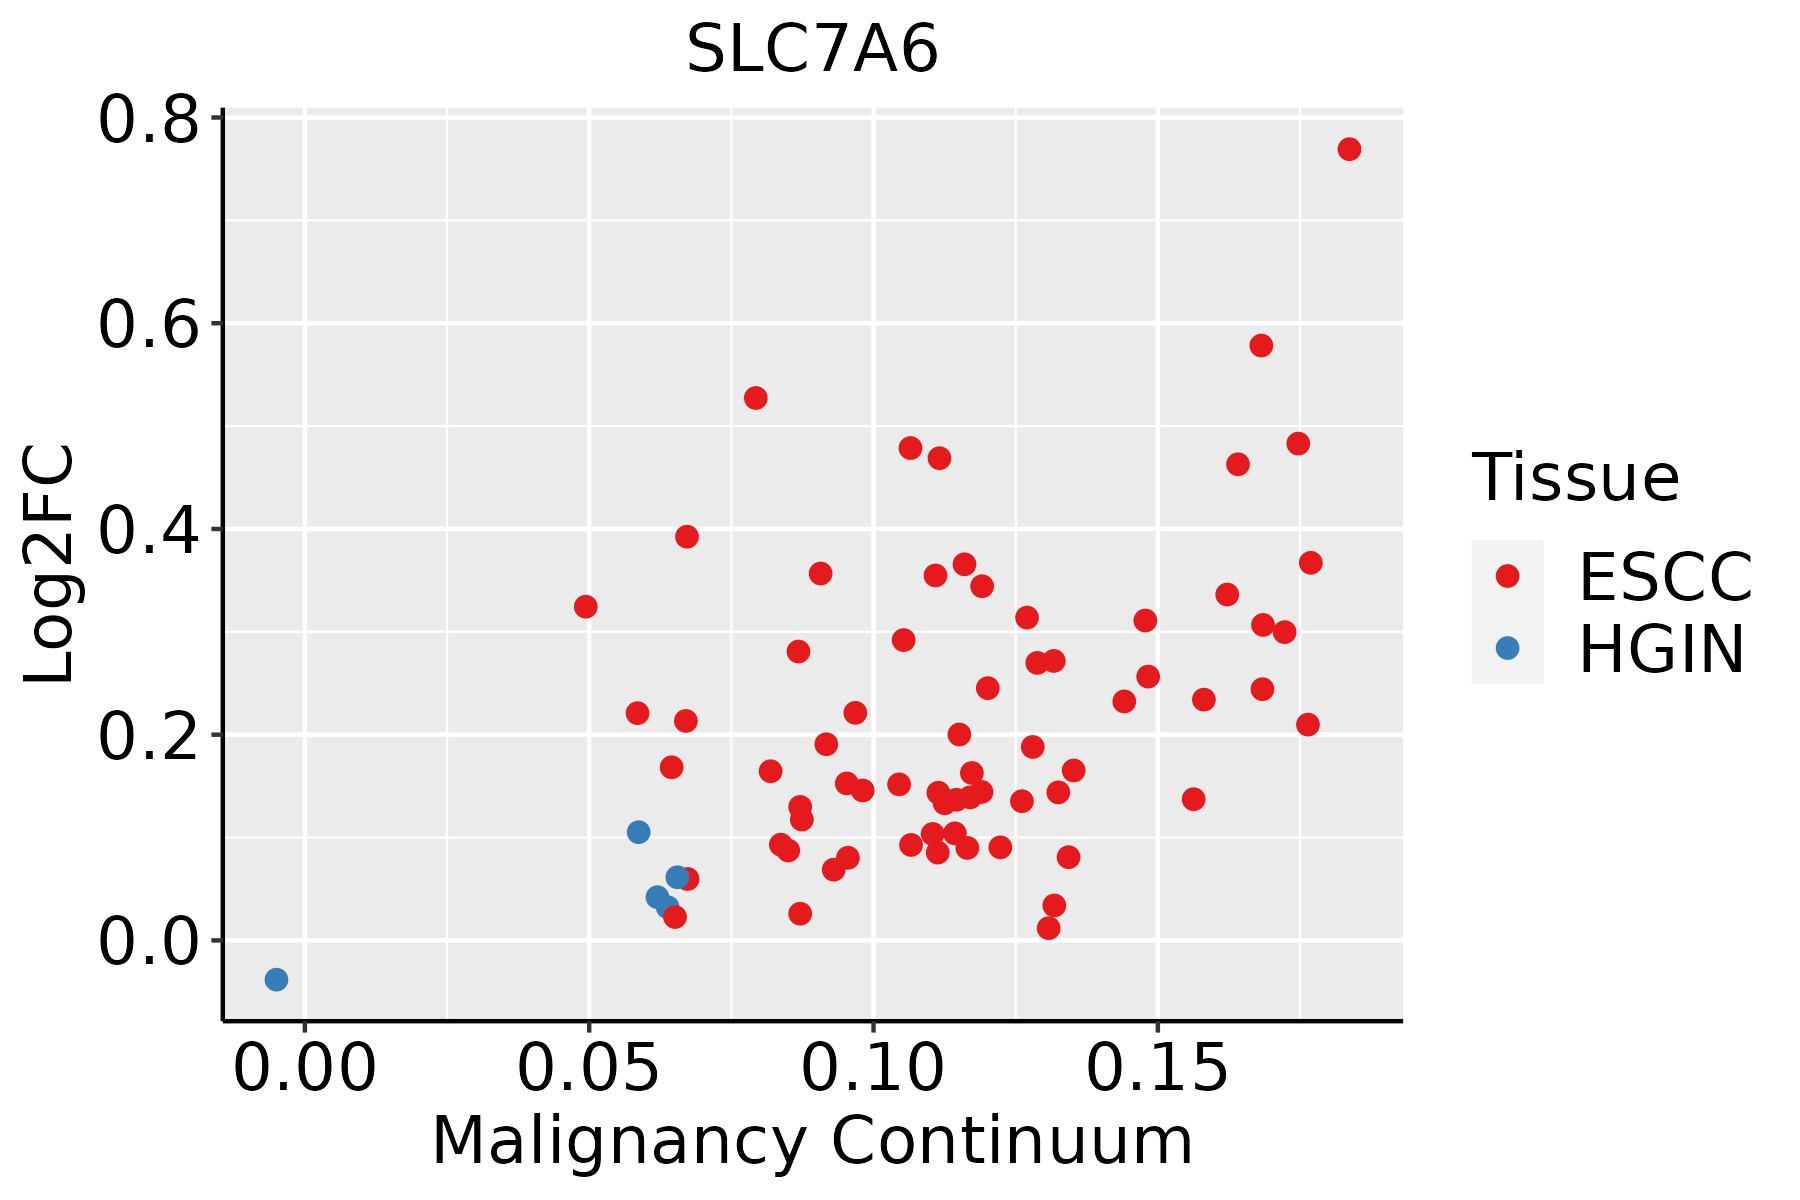 | ESCC: Esophageal squamous cell carcinoma |
| HGIN: High-grade intraepithelial neoplasias | ||
| LGIN: Low-grade intraepithelial neoplasias | ||
| Liver | 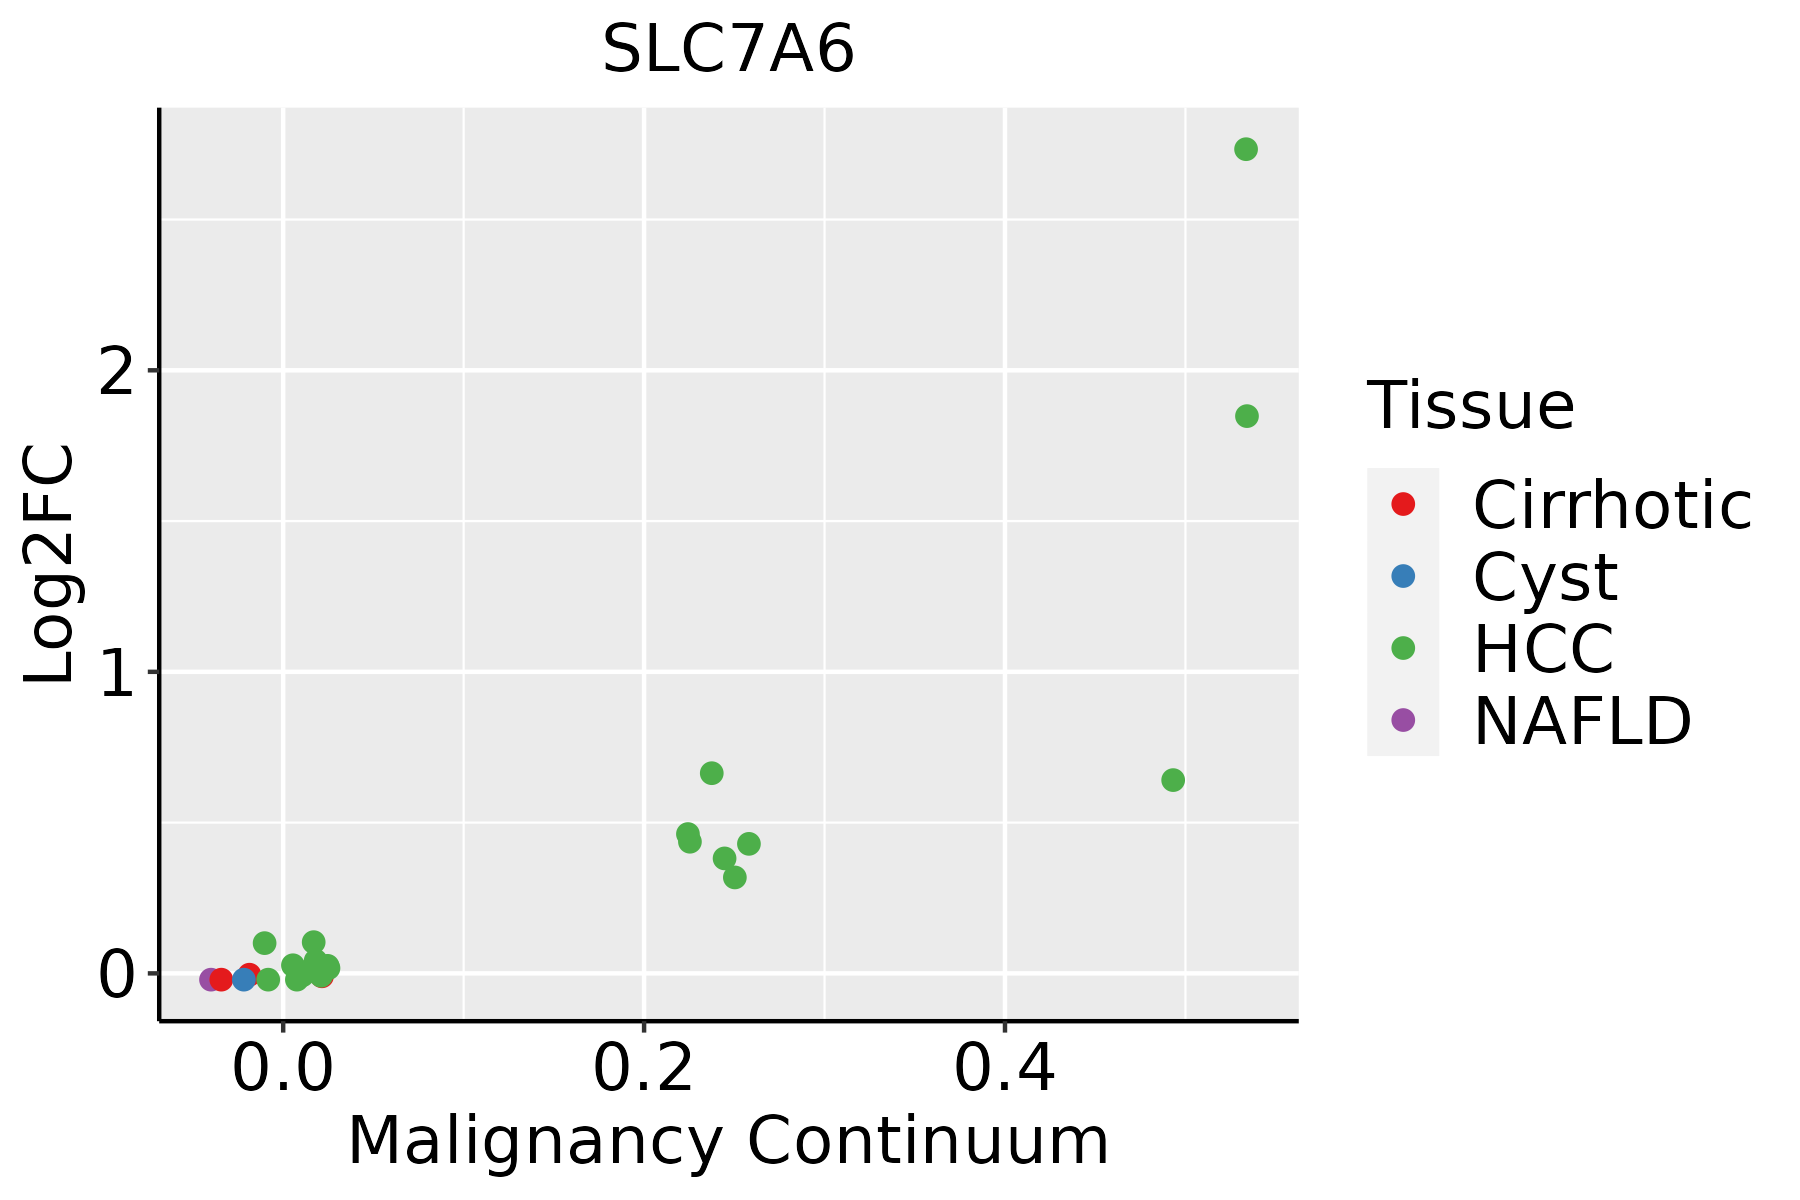 | HCC: Hepatocellular carcinoma |
| NAFLD: Non-alcoholic fatty liver disease | ||
| Oral Cavity | 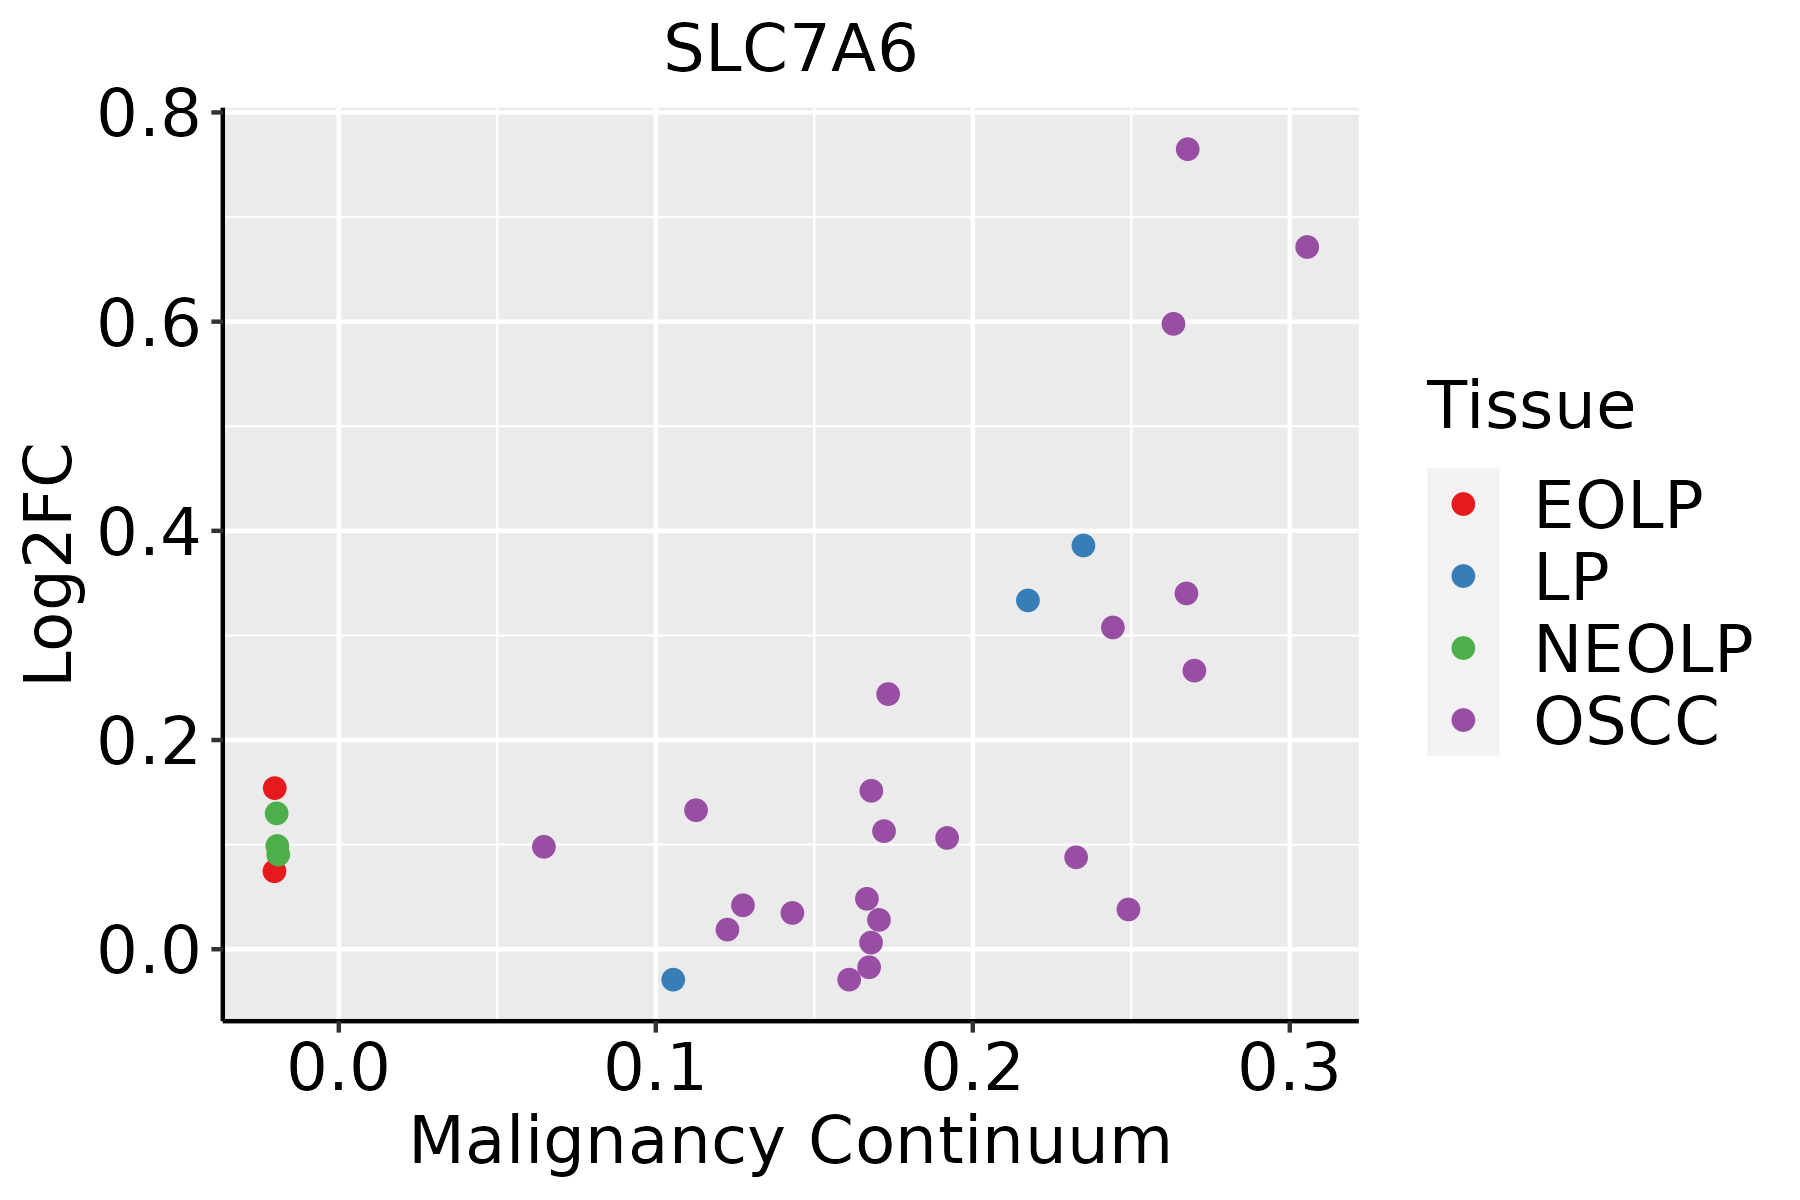 | EOLP: Erosive Oral lichen planus |
| LP: leukoplakia | ||
| NEOLP: Non-erosive oral lichen planus | ||
| OSCC: Oral squamous cell carcinoma | ||
| Thyroid | 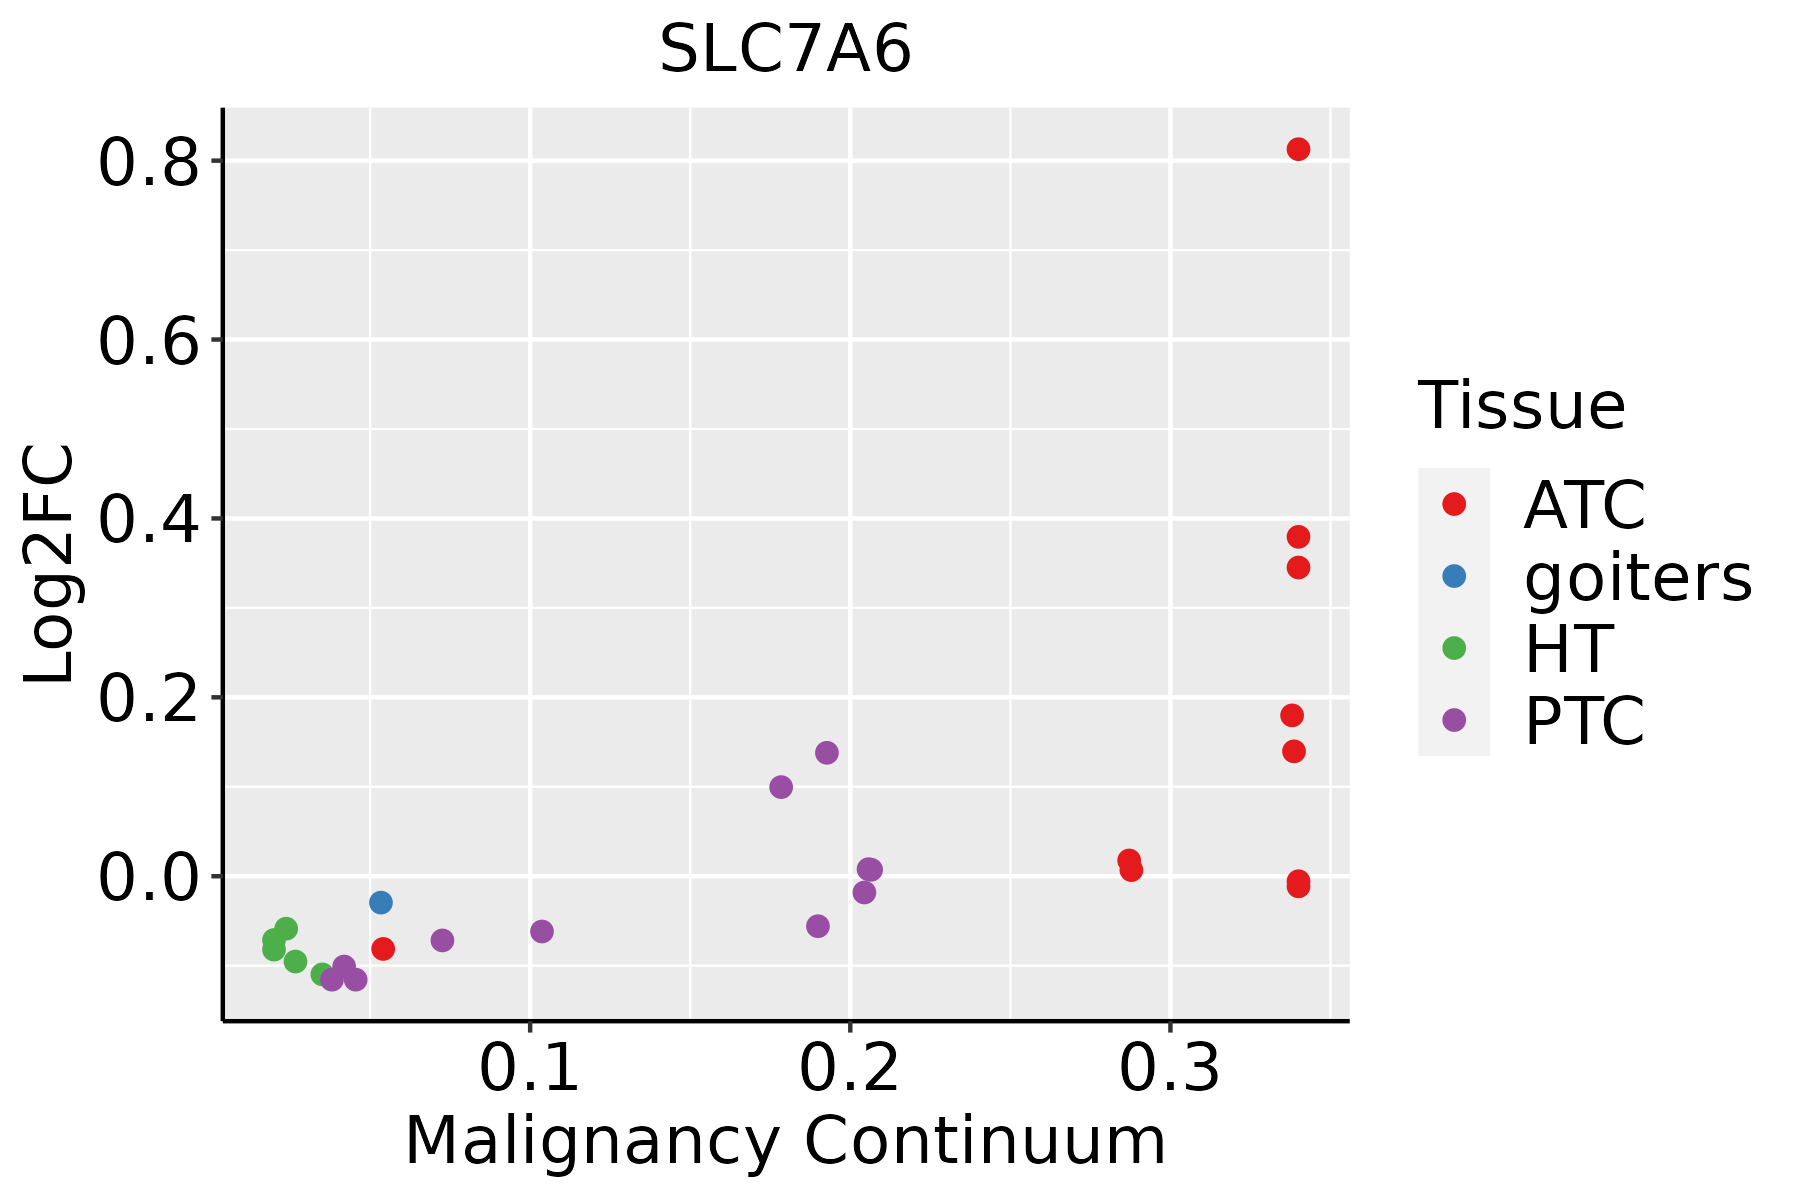 | ATC: Anaplastic thyroid cancer |
| HT: Hashimoto's thyroiditis | ||
| PTC: Papillary thyroid cancer |
| ∗log2FC in expression of this searched gene in stem-like cells from each diseased tissue sample relative to stem-like cells in normal samples in each tissue plotted against the malignancy continuum. Samples are colored based on if they are from different disease stage. |
Top |
Malignant transformation related pathway analysis |
| Find out the enriched GO biological processes and KEGG pathways involved in transition from healthy to precancer to cancer |
| Tissue | Disease Stage | Enriched GO biological Processes |
| Colorectum | AD |  |
| Colorectum | SER |  |
| Colorectum | MSS |  |
| Colorectum | MSI-H |  |
| Colorectum | FAP |  |
| ∗Top 15 enriched GO BP terms are showed in the bar plot of each disease state in each tissue. Each row represents a significant GO biological process which is colored according to the -log10(p.adjust). |
| Page: 1 2 3 4 5 6 7 8 9 |
| GO ID | Tissue | Disease Stage | Description | Gene Ratio | Bg Ratio | pvalue | p.adjust | Count |
| GO:00022446 | Esophagus | ESCC | hematopoietic progenitor cell differentiation | 66/8552 | 114/18723 | 5.74e-03 | 2.13e-02 | 66 |
| GO:00022445 | Oral cavity | OSCC | hematopoietic progenitor cell differentiation | 57/7305 | 114/18723 | 1.09e-02 | 3.71e-02 | 57 |
| Page: 1 |
| Pathway ID | Tissue | Disease Stage | Description | Gene Ratio | Bg Ratio | pvalue | p.adjust | qvalue | Count |
| Page: 1 |
Top |
Cell-cell communication analysis |
| Identification of potential cell-cell interactions between two cell types and their ligand-receptor pairs for different disease states |
| Ligand | Receptor | LRpair | Pathway | Tissue | Disease Stage |
| Page: 1 |
Top |
Single-cell gene regulatory network inference analysis |
| Find out the significant the regulons (TFs) and the target genes of each regulon across cell types for different disease states |
| TF | Cell Type | Tissue | Disease Stage | Target Gene | RSS | Regulon Activity |
| ∗The dot plots of a searched regulon are shown for all cell subpopulations in each disease state of each tissue based on the regulon specific score inferred using pySCENIC and by calculating the average expression. |
| Page: 1 |
Top |
Somatic mutation of malignant transformation related genes |
| Annotation of somatic variants for genes involved in malignant transformation |
| Hugo Symbol | Variant Class | Variant Classification | dbSNP RS | HGVSc | HGVSp | HGVSp Short | SWISSPROT | BIOTYPE | SIFT | PolyPhen | Tumor Sample Barcode | Tissue | Histology | Sex | Age | Stage | Therapy Types | Drugs | Outcome |
| SLC7A6 | SNV | Missense_Mutation | novel | c.174N>C | p.Met58Ile | p.M58I | Q92536 | protein_coding | tolerated(1) | benign(0.163) | TCGA-5L-AAT1-01 | Breast | breast invasive carcinoma | Female | <65 | III/IV | Hormone Therapy | letrozol | SD |
| SLC7A6 | SNV | Missense_Mutation | c.1294T>A | p.Phe432Ile | p.F432I | Q92536 | protein_coding | deleterious(0) | probably_damaging(0.928) | TCGA-AR-A24H-01 | Breast | breast invasive carcinoma | Female | >=65 | I/II | Hormone Therapy | tamoxiphen | SD | |
| SLC7A6 | insertion | Frame_Shift_Ins | novel | c.175_176insCTGGGCAGGATTACCTGGGTATGGACAG | p.Ile59ThrfsTer87 | p.I59Tfs*87 | Q92536 | protein_coding | TCGA-B6-A0IM-01 | Breast | breast invasive carcinoma | Female | >=65 | I/II | Unknown | Unknown | SD | ||
| SLC7A6 | SNV | Missense_Mutation | rs778662864 | c.1042C>T | p.Arg348Trp | p.R348W | Q92536 | protein_coding | deleterious(0) | probably_damaging(1) | TCGA-2W-A8YY-01 | Cervix | cervical & endocervical cancer | Female | <65 | I/II | Chemotherapy | cisplatin | CR |
| SLC7A6 | SNV | Missense_Mutation | c.245T>A | p.Ile82Asn | p.I82N | Q92536 | protein_coding | deleterious(0) | benign(0.217) | TCGA-AD-A5EJ-01 | Colorectum | colon adenocarcinoma | Female | >=65 | I/II | Unknown | Unknown | SD | |
| SLC7A6 | SNV | Missense_Mutation | c.436N>G | p.Thr146Ala | p.T146A | Q92536 | protein_coding | deleterious(0) | probably_damaging(1) | TCGA-DM-A1HB-01 | Colorectum | colon adenocarcinoma | Male | >=65 | III/IV | Unknown | Unknown | SD | |
| SLC7A6 | deletion | Frame_Shift_Del | c.1472delN | p.Gln492SerfsTer8 | p.Q492Sfs*8 | Q92536 | protein_coding | TCGA-G4-6320-01 | Colorectum | colon adenocarcinoma | Male | >=65 | III/IV | Chemotherapy | oxaliplatin | SD | |||
| SLC7A6 | SNV | Missense_Mutation | novel | c.1516G>A | p.Glu506Lys | p.E506K | Q92536 | protein_coding | tolerated(0.09) | benign(0.009) | TCGA-A5-A2K5-01 | Endometrium | uterine corpus endometrioid carcinoma | Female | >=65 | I/II | Unknown | Unknown | SD |
| SLC7A6 | SNV | Missense_Mutation | c.224N>T | p.Ala75Val | p.A75V | Q92536 | protein_coding | deleterious(0) | possibly_damaging(0.686) | TCGA-AP-A059-01 | Endometrium | uterine corpus endometrioid carcinoma | Female | >=65 | I/II | Unknown | Unknown | SD | |
| SLC7A6 | SNV | Missense_Mutation | c.319N>G | p.Lys107Glu | p.K107E | Q92536 | protein_coding | deleterious(0.01) | probably_damaging(0.994) | TCGA-AP-A059-01 | Endometrium | uterine corpus endometrioid carcinoma | Female | >=65 | I/II | Unknown | Unknown | SD |
| Page: 1 2 3 4 |
Top |
Related drugs of malignant transformation related genes |
| Identification of chemicals and drugs interact with genes involved in malignant transfromation |
| (DGIdb 4.0) |
| Entrez ID | Symbol | Category | Interaction Types | Drug Claim Name | Drug Name | PMIDs |
| Page: 1 |

Copyright 2023-Present -The University of Texas Health Science Center at Houston |