
|
|||||
|
 | |
| |
| |
| |
| |
| |
|
Gene: SLC7A2 |
Gene summary for SLC7A2 |
| Gene information | Species | Human | Gene symbol | SLC7A2 | Gene ID | 6542 |
| Gene name | solute carrier family 7 member 2 | |
| Gene Alias | ATRC2 | |
| Cytomap | 8p22 | |
| Gene Type | protein-coding | GO ID | GO:0003008 | UniProtAcc | P52569 |
Top |
Malignant transformation analysis |
| Identification of the aberrant gene expression in precancerous and cancerous lesions by comparing the gene expression of stem-like cells in diseased tissues with normal stem cells |
| Entrez ID | Symbol | Replicates | Species | Organ | Tissue | Adj P-value | Log2FC | Malignancy |
| 6542 | SLC7A2 | GSM4909282 | Human | Breast | IDC | 1.20e-02 | -1.66e-01 | -0.0288 |
| 6542 | SLC7A2 | GSM4909285 | Human | Breast | IDC | 4.45e-03 | -1.73e-01 | 0.21 |
| 6542 | SLC7A2 | GSM4909286 | Human | Breast | IDC | 7.79e-05 | -1.80e-01 | 0.1081 |
| 6542 | SLC7A2 | GSM4909287 | Human | Breast | IDC | 7.40e-03 | -1.76e-01 | 0.2057 |
| 6542 | SLC7A2 | GSM4909290 | Human | Breast | IDC | 8.79e-03 | -1.80e-01 | 0.2096 |
| 6542 | SLC7A2 | GSM4909293 | Human | Breast | IDC | 3.66e-05 | -1.64e-01 | 0.1581 |
| 6542 | SLC7A2 | GSM4909298 | Human | Breast | IDC | 1.65e-04 | -1.80e-01 | 0.1551 |
| 6542 | SLC7A2 | GSM4909301 | Human | Breast | IDC | 1.27e-36 | 8.28e-01 | 0.1577 |
| 6542 | SLC7A2 | GSM4909302 | Human | Breast | IDC | 9.88e-40 | 8.96e-01 | 0.1545 |
| 6542 | SLC7A2 | GSM4909304 | Human | Breast | IDC | 2.11e-02 | 1.77e-01 | 0.1636 |
| 6542 | SLC7A2 | GSM4909307 | Human | Breast | IDC | 5.89e-07 | 3.48e-01 | 0.1569 |
| 6542 | SLC7A2 | GSM4909308 | Human | Breast | IDC | 5.66e-11 | 4.06e-01 | 0.158 |
| 6542 | SLC7A2 | GSM4909311 | Human | Breast | IDC | 3.66e-05 | -1.80e-01 | 0.1534 |
| 6542 | SLC7A2 | GSM4909312 | Human | Breast | IDC | 7.79e-05 | -1.80e-01 | 0.1552 |
| 6542 | SLC7A2 | GSM4909319 | Human | Breast | IDC | 7.79e-05 | -1.80e-01 | 0.1563 |
| 6542 | SLC7A2 | brca1 | Human | Breast | Precancer | 8.07e-06 | -1.74e-01 | -0.0338 |
| 6542 | SLC7A2 | M1 | Human | Breast | IDC | 2.71e-15 | 5.67e-01 | 0.1577 |
| 6542 | SLC7A2 | NCCBC11 | Human | Breast | DCIS | 4.53e-08 | 6.97e-01 | 0.1232 |
| 6542 | SLC7A2 | NCCBC14 | Human | Breast | DCIS | 4.80e-02 | -1.24e-01 | 0.2021 |
| 6542 | SLC7A2 | P1 | Human | Breast | IDC | 4.39e-04 | 2.53e-01 | 0.1527 |
| Page: 1 2 3 4 |
| Tissue | Expression Dynamics | Abbreviation |
| Breast | 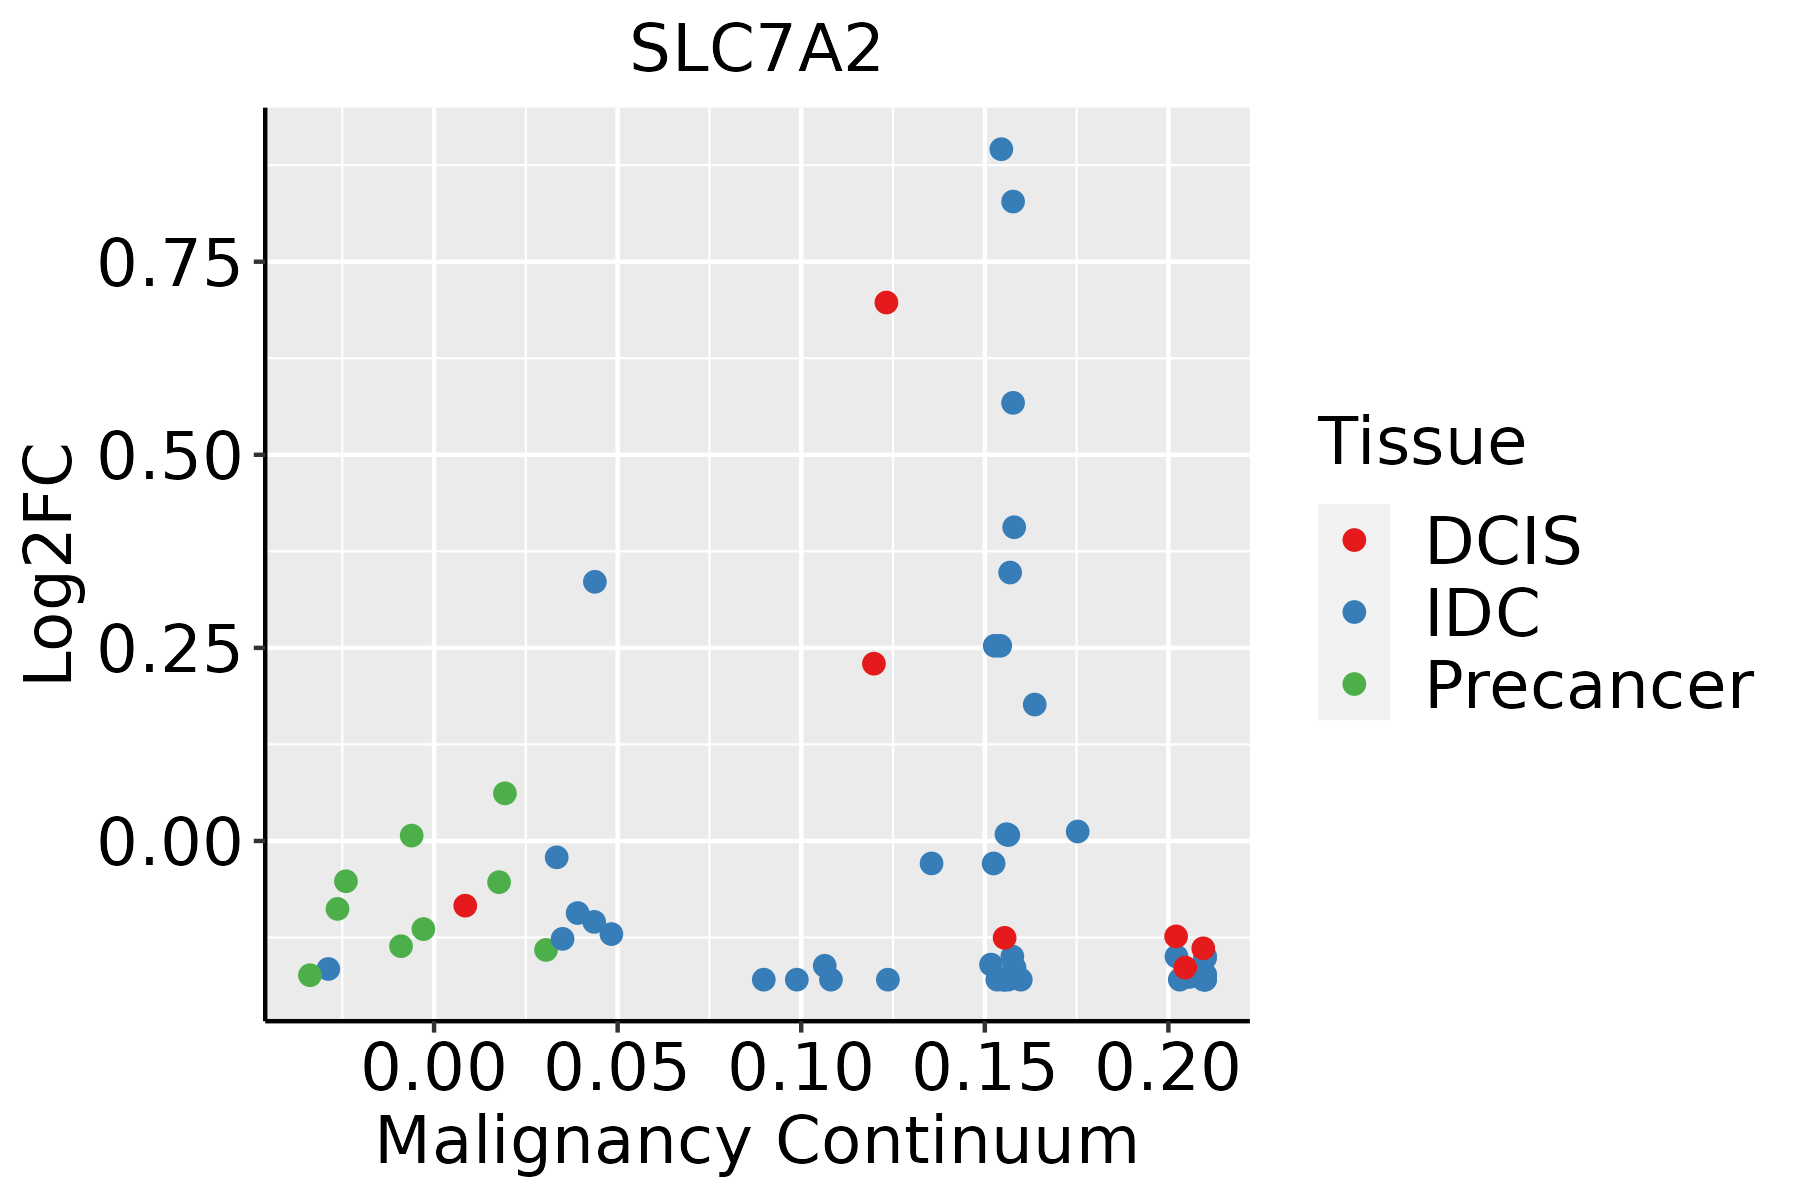 | IDC: Invasive ductal carcinoma |
| DCIS: Ductal carcinoma in situ | ||
| Precancer(BRCA1-mut): Precancerous lesion from BRCA1 mutation carriers | ||
| Esophagus | 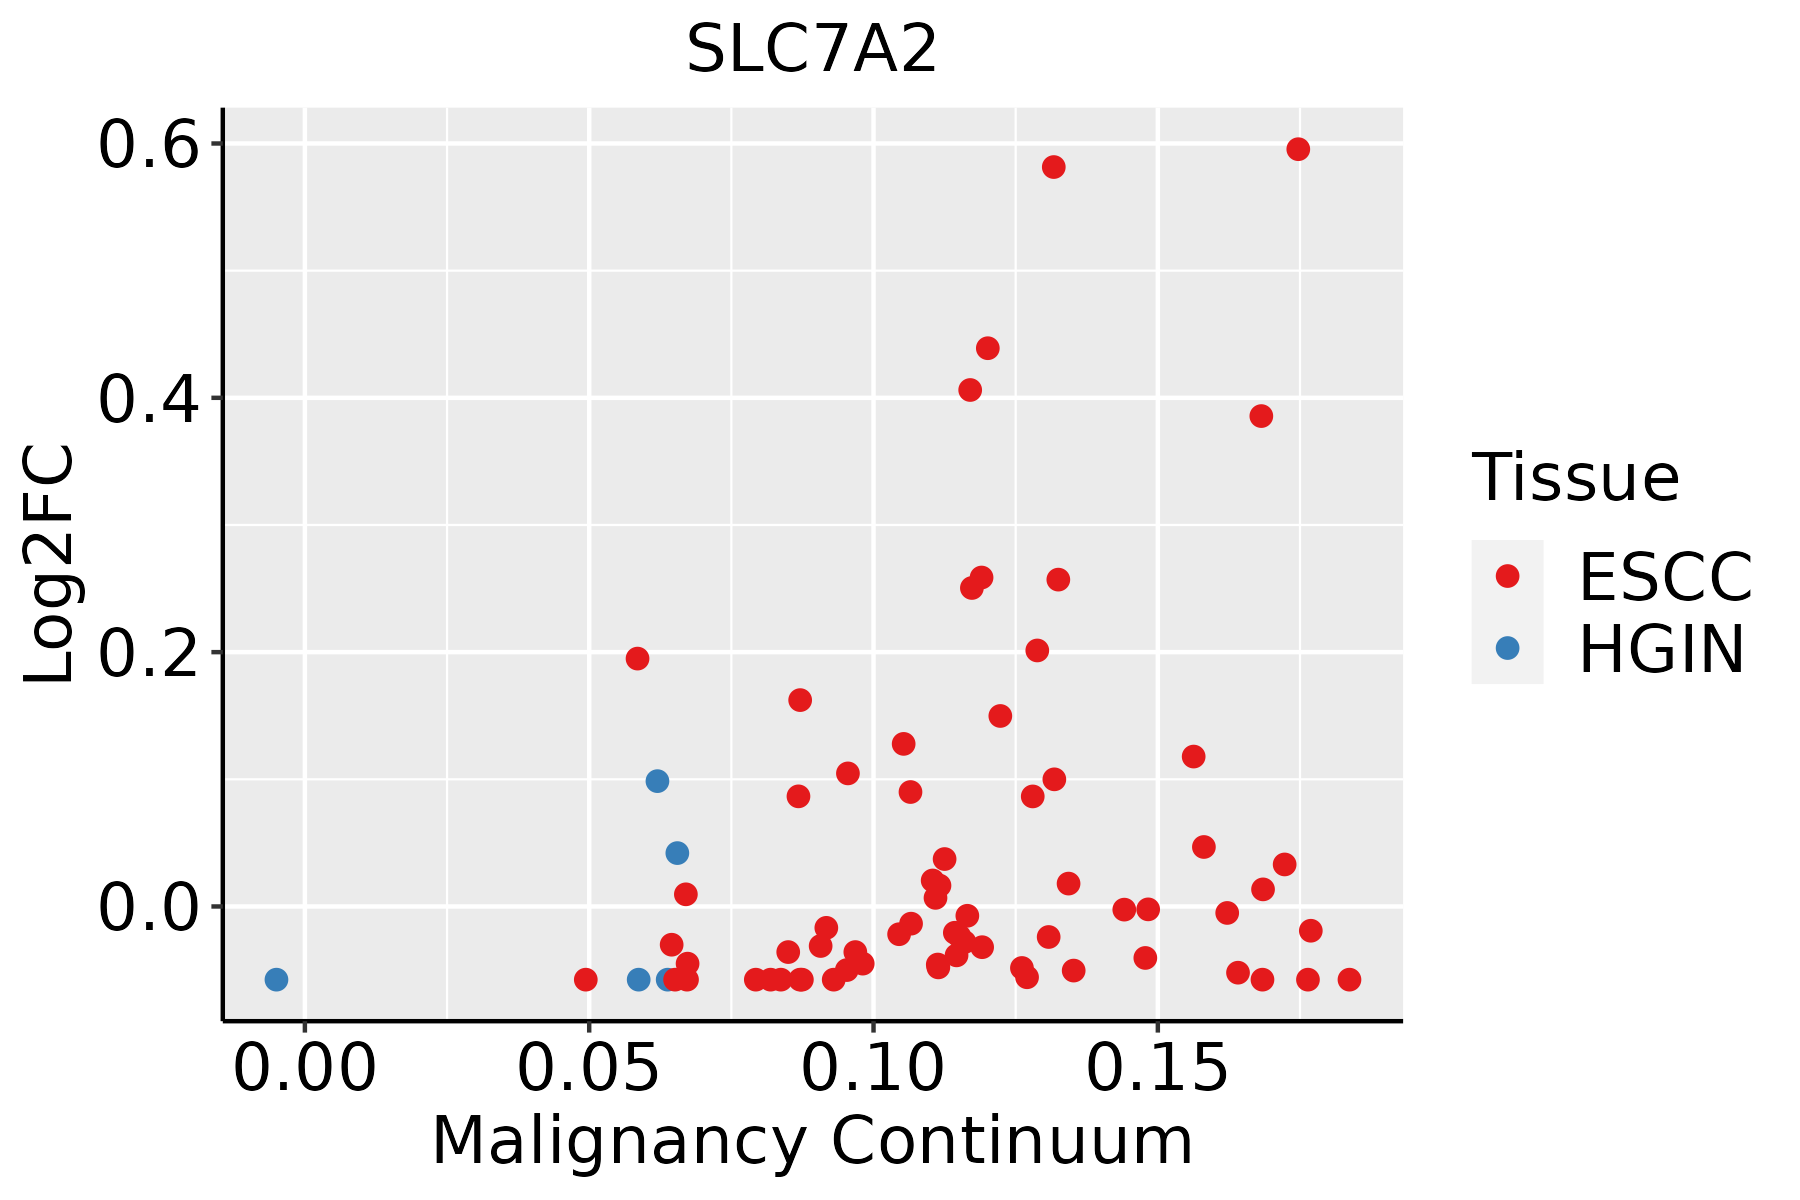 | ESCC: Esophageal squamous cell carcinoma |
| HGIN: High-grade intraepithelial neoplasias | ||
| LGIN: Low-grade intraepithelial neoplasias | ||
| Liver |  | HCC: Hepatocellular carcinoma |
| NAFLD: Non-alcoholic fatty liver disease | ||
| Prostate | 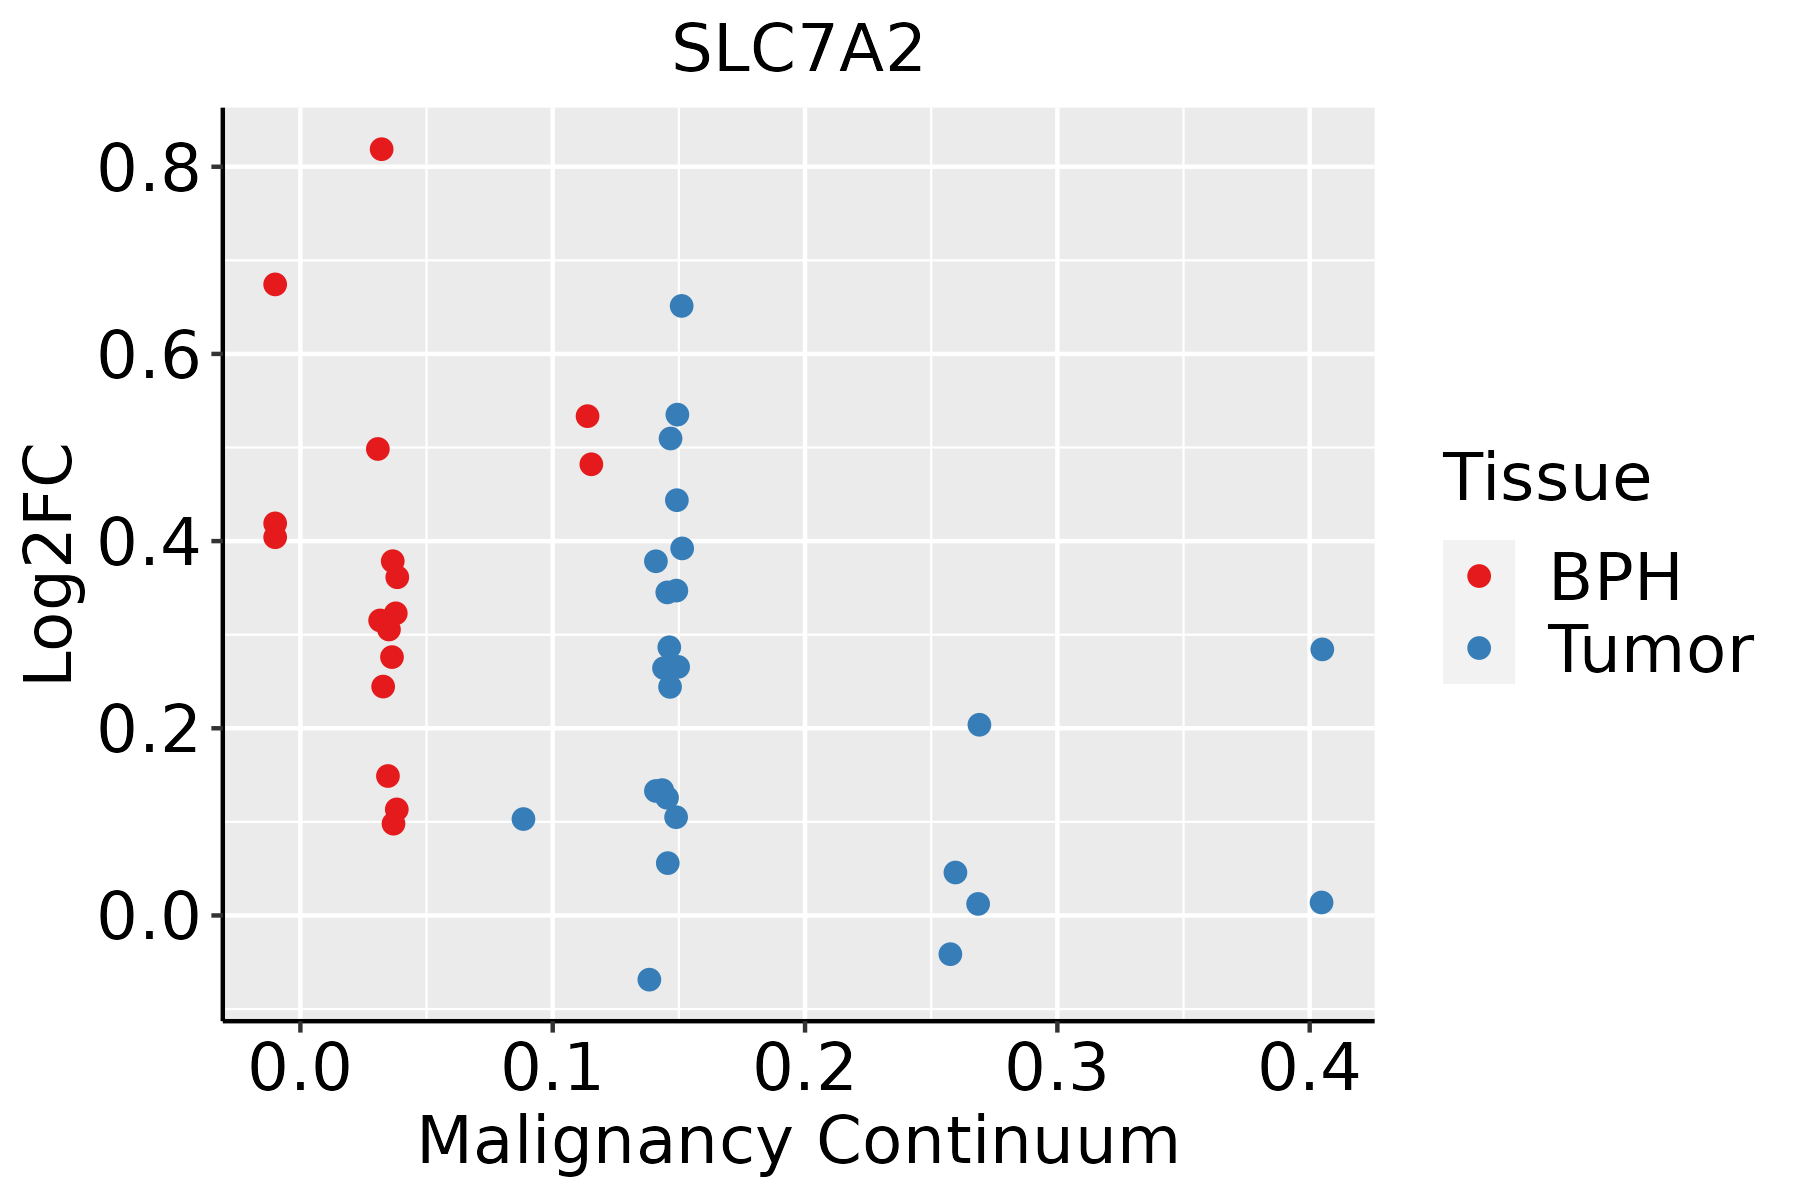 | BPH: Benign Prostatic Hyperplasia |
| Thyroid |  | ATC: Anaplastic thyroid cancer |
| HT: Hashimoto's thyroiditis | ||
| PTC: Papillary thyroid cancer |
| ∗log2FC in expression of this searched gene in stem-like cells from each diseased tissue sample relative to stem-like cells in normal samples in each tissue plotted against the malignancy continuum. Samples are colored based on if they are from different disease stage. |
Top |
Malignant transformation related pathway analysis |
| Find out the enriched GO biological processes and KEGG pathways involved in transition from healthy to precancer to cancer |
| Tissue | Disease Stage | Enriched GO biological Processes |
| Colorectum | AD |  |
| Colorectum | SER |  |
| Colorectum | MSS |  |
| Colorectum | MSI-H |  |
| Colorectum | FAP |  |
| ∗Top 15 enriched GO BP terms are showed in the bar plot of each disease state in each tissue. Each row represents a significant GO biological process which is colored according to the -log10(p.adjust). |
| Page: 1 2 3 4 5 6 7 8 9 |
| GO ID | Tissue | Disease Stage | Description | Gene Ratio | Bg Ratio | pvalue | p.adjust | Count |
| GO:00030182 | Liver | NAFLD | vascular process in circulatory system | 46/1882 | 263/18723 | 1.36e-04 | 2.58e-03 | 46 |
| GO:01501043 | Liver | NAFLD | transport across blood-brain barrier | 17/1882 | 87/18723 | 5.46e-03 | 4.20e-02 | 17 |
| GO:00102322 | Liver | NAFLD | vascular transport | 17/1882 | 88/18723 | 6.15e-03 | 4.61e-02 | 17 |
| GO:015010411 | Liver | HCC | transport across blood-brain barrier | 50/7958 | 87/18723 | 3.42e-03 | 1.55e-02 | 50 |
| GO:001023211 | Liver | HCC | vascular transport | 50/7958 | 88/18723 | 4.69e-03 | 2.02e-02 | 50 |
| GO:00030183 | Prostate | Tumor | vascular process in circulatory system | 61/3246 | 263/18723 | 8.88e-03 | 3.84e-02 | 61 |
| Page: 1 |
| Pathway ID | Tissue | Disease Stage | Description | Gene Ratio | Bg Ratio | pvalue | p.adjust | qvalue | Count |
| Page: 1 |
Top |
Cell-cell communication analysis |
| Identification of potential cell-cell interactions between two cell types and their ligand-receptor pairs for different disease states |
| Ligand | Receptor | LRpair | Pathway | Tissue | Disease Stage |
| Page: 1 |
Top |
Single-cell gene regulatory network inference analysis |
| Find out the significant the regulons (TFs) and the target genes of each regulon across cell types for different disease states |
| TF | Cell Type | Tissue | Disease Stage | Target Gene | RSS | Regulon Activity |
| ∗The dot plots of a searched regulon are shown for all cell subpopulations in each disease state of each tissue based on the regulon specific score inferred using pySCENIC and by calculating the average expression. |
| Page: 1 |
Top |
Somatic mutation of malignant transformation related genes |
| Annotation of somatic variants for genes involved in malignant transformation |
| Hugo Symbol | Variant Class | Variant Classification | dbSNP RS | HGVSc | HGVSp | HGVSp Short | SWISSPROT | BIOTYPE | SIFT | PolyPhen | Tumor Sample Barcode | Tissue | Histology | Sex | Age | Stage | Therapy Types | Drugs | Outcome |
| SLC7A2 | SNV | Missense_Mutation | novel | c.1253N>A | p.Ala418Asp | p.A418D | P52569 | protein_coding | deleterious(0) | possibly_damaging(0.887) | TCGA-B6-A400-01 | Breast | breast invasive carcinoma | Female | <65 | III/IV | Unknown | Unknown | SD |
| SLC7A2 | insertion | Nonsense_Mutation | novel | c.1767_1768insGTGCCATTTCCCATTTGAAAAAAAGGGAAGTATCCAACCCCGAC | p.Asn590ValfsTer6 | p.N590Vfs*6 | P52569 | protein_coding | TCGA-AO-A0JE-01 | Breast | breast invasive carcinoma | Female | <65 | III/IV | Chemotherapy | doxorubicin | SD | ||
| SLC7A2 | SNV | Missense_Mutation | novel | c.1319N>C | p.Leu440Ser | p.L440S | P52569 | protein_coding | deleterious(0.02) | possibly_damaging(0.522) | TCGA-2W-A8YY-01 | Cervix | cervical & endocervical cancer | Female | <65 | I/II | Chemotherapy | cisplatin | CR |
| SLC7A2 | SNV | Missense_Mutation | rs761652013 | c.325G>A | p.Val109Met | p.V109M | P52569 | protein_coding | deleterious(0.04) | possibly_damaging(0.802) | TCGA-JW-A5VI-01 | Cervix | cervical & endocervical cancer | Female | <65 | I/II | Chemotherapy | topotecan | PD |
| SLC7A2 | SNV | Missense_Mutation | c.22N>G | p.Tyr8Asp | p.Y8D | P52569 | protein_coding | tolerated_low_confidence(0.27) | benign(0.01) | TCGA-AA-3510-01 | Colorectum | colon adenocarcinoma | Male | >=65 | I/II | Unknown | Unknown | SD | |
| SLC7A2 | SNV | Missense_Mutation | novel | c.1637N>G | p.Leu546Trp | p.L546W | P52569 | protein_coding | tolerated(0.18) | possibly_damaging(0.753) | TCGA-AA-3510-01 | Colorectum | colon adenocarcinoma | Male | >=65 | I/II | Unknown | Unknown | SD |
| SLC7A2 | SNV | Missense_Mutation | rs139867348 | c.1162G>A | p.Ala388Thr | p.A388T | P52569 | protein_coding | deleterious(0.02) | possibly_damaging(0.761) | TCGA-AA-3660-01 | Colorectum | colon adenocarcinoma | Female | <65 | I/II | Unknown | Unknown | SD |
| SLC7A2 | SNV | Missense_Mutation | novel | c.1673C>T | p.Ala558Val | p.A558V | P52569 | protein_coding | tolerated(0.51) | benign(0.089) | TCGA-AA-3845-01 | Colorectum | colon adenocarcinoma | Female | >=65 | I/II | Unknown | Unknown | PD |
| SLC7A2 | SNV | Missense_Mutation | c.1175G>A | p.Ser392Asn | p.S392N | P52569 | protein_coding | deleterious(0) | possibly_damaging(0.582) | TCGA-AA-A00N-01 | Colorectum | colon adenocarcinoma | Male | >=65 | I/II | Unknown | Unknown | PD | |
| SLC7A2 | SNV | Missense_Mutation | c.437C>T | p.Thr146Ile | p.T146I | P52569 | protein_coding | deleterious(0) | possibly_damaging(0.84) | TCGA-AA-A022-01 | Colorectum | colon adenocarcinoma | Female | >=65 | I/II | Unknown | Unknown | SD |
| Page: 1 2 3 4 5 6 7 8 |
Top |
Related drugs of malignant transformation related genes |
| Identification of chemicals and drugs interact with genes involved in malignant transfromation |
| (DGIdb 4.0) |
| Entrez ID | Symbol | Category | Interaction Types | Drug Claim Name | Drug Name | PMIDs |
| Page: 1 |

Copyright 2023-Present -The University of Texas Health Science Center at Houston |