
|
|||||
|
 | |
| |
| |
| |
| |
| |
|
Gene: SLC7A11 |
Gene summary for SLC7A11 |
| Gene information | Species | Human | Gene symbol | SLC7A11 | Gene ID | 23657 |
| Gene name | solute carrier family 7 member 11 | |
| Gene Alias | CCBR1 | |
| Cytomap | 4q28.3 | |
| Gene Type | protein-coding | GO ID | GO:0000096 | UniProtAcc | Q9UPY5 |
Top |
Malignant transformation analysis |
| Identification of the aberrant gene expression in precancerous and cancerous lesions by comparing the gene expression of stem-like cells in diseased tissues with normal stem cells |
| Entrez ID | Symbol | Replicates | Species | Organ | Tissue | Adj P-value | Log2FC | Malignancy |
| 23657 | SLC7A11 | LZE2T | Human | Esophagus | ESCC | 6.62e-04 | 4.46e-01 | 0.082 |
| 23657 | SLC7A11 | LZE4T | Human | Esophagus | ESCC | 2.90e-39 | 1.43e+00 | 0.0811 |
| 23657 | SLC7A11 | LZE7T | Human | Esophagus | ESCC | 1.08e-14 | 8.50e-01 | 0.0667 |
| 23657 | SLC7A11 | P4T-E | Human | Esophagus | ESCC | 4.06e-07 | 2.60e-01 | 0.1323 |
| 23657 | SLC7A11 | P5T-E | Human | Esophagus | ESCC | 5.95e-06 | 1.46e-01 | 0.1327 |
| 23657 | SLC7A11 | P9T-E | Human | Esophagus | ESCC | 3.53e-24 | 6.74e-01 | 0.1131 |
| 23657 | SLC7A11 | P15T-E | Human | Esophagus | ESCC | 2.41e-35 | 8.29e-01 | 0.1149 |
| 23657 | SLC7A11 | P21T-E | Human | Esophagus | ESCC | 3.76e-24 | 6.73e-01 | 0.1617 |
| 23657 | SLC7A11 | P22T-E | Human | Esophagus | ESCC | 2.11e-06 | 1.71e-01 | 0.1236 |
| 23657 | SLC7A11 | P23T-E | Human | Esophagus | ESCC | 6.41e-03 | 1.81e-01 | 0.108 |
| 23657 | SLC7A11 | P26T-E | Human | Esophagus | ESCC | 2.28e-03 | 1.58e-01 | 0.1276 |
| 23657 | SLC7A11 | P28T-E | Human | Esophagus | ESCC | 7.22e-03 | 2.12e-01 | 0.1149 |
| 23657 | SLC7A11 | P30T-E | Human | Esophagus | ESCC | 6.64e-38 | 1.34e+00 | 0.137 |
| 23657 | SLC7A11 | P32T-E | Human | Esophagus | ESCC | 9.98e-39 | 1.23e+00 | 0.1666 |
| 23657 | SLC7A11 | P39T-E | Human | Esophagus | ESCC | 1.23e-09 | 3.23e-01 | 0.0894 |
| 23657 | SLC7A11 | P42T-E | Human | Esophagus | ESCC | 2.06e-13 | 7.62e-01 | 0.1175 |
| 23657 | SLC7A11 | P47T-E | Human | Esophagus | ESCC | 2.45e-02 | 1.31e-01 | 0.1067 |
| 23657 | SLC7A11 | P48T-E | Human | Esophagus | ESCC | 1.11e-03 | 2.67e-01 | 0.0959 |
| 23657 | SLC7A11 | P49T-E | Human | Esophagus | ESCC | 5.16e-18 | 2.44e+00 | 0.1768 |
| 23657 | SLC7A11 | P52T-E | Human | Esophagus | ESCC | 6.67e-12 | 4.06e-01 | 0.1555 |
| Page: 1 2 3 |
| Tissue | Expression Dynamics | Abbreviation |
| Esophagus |  | ESCC: Esophageal squamous cell carcinoma |
| HGIN: High-grade intraepithelial neoplasias | ||
| LGIN: Low-grade intraepithelial neoplasias | ||
| Liver | 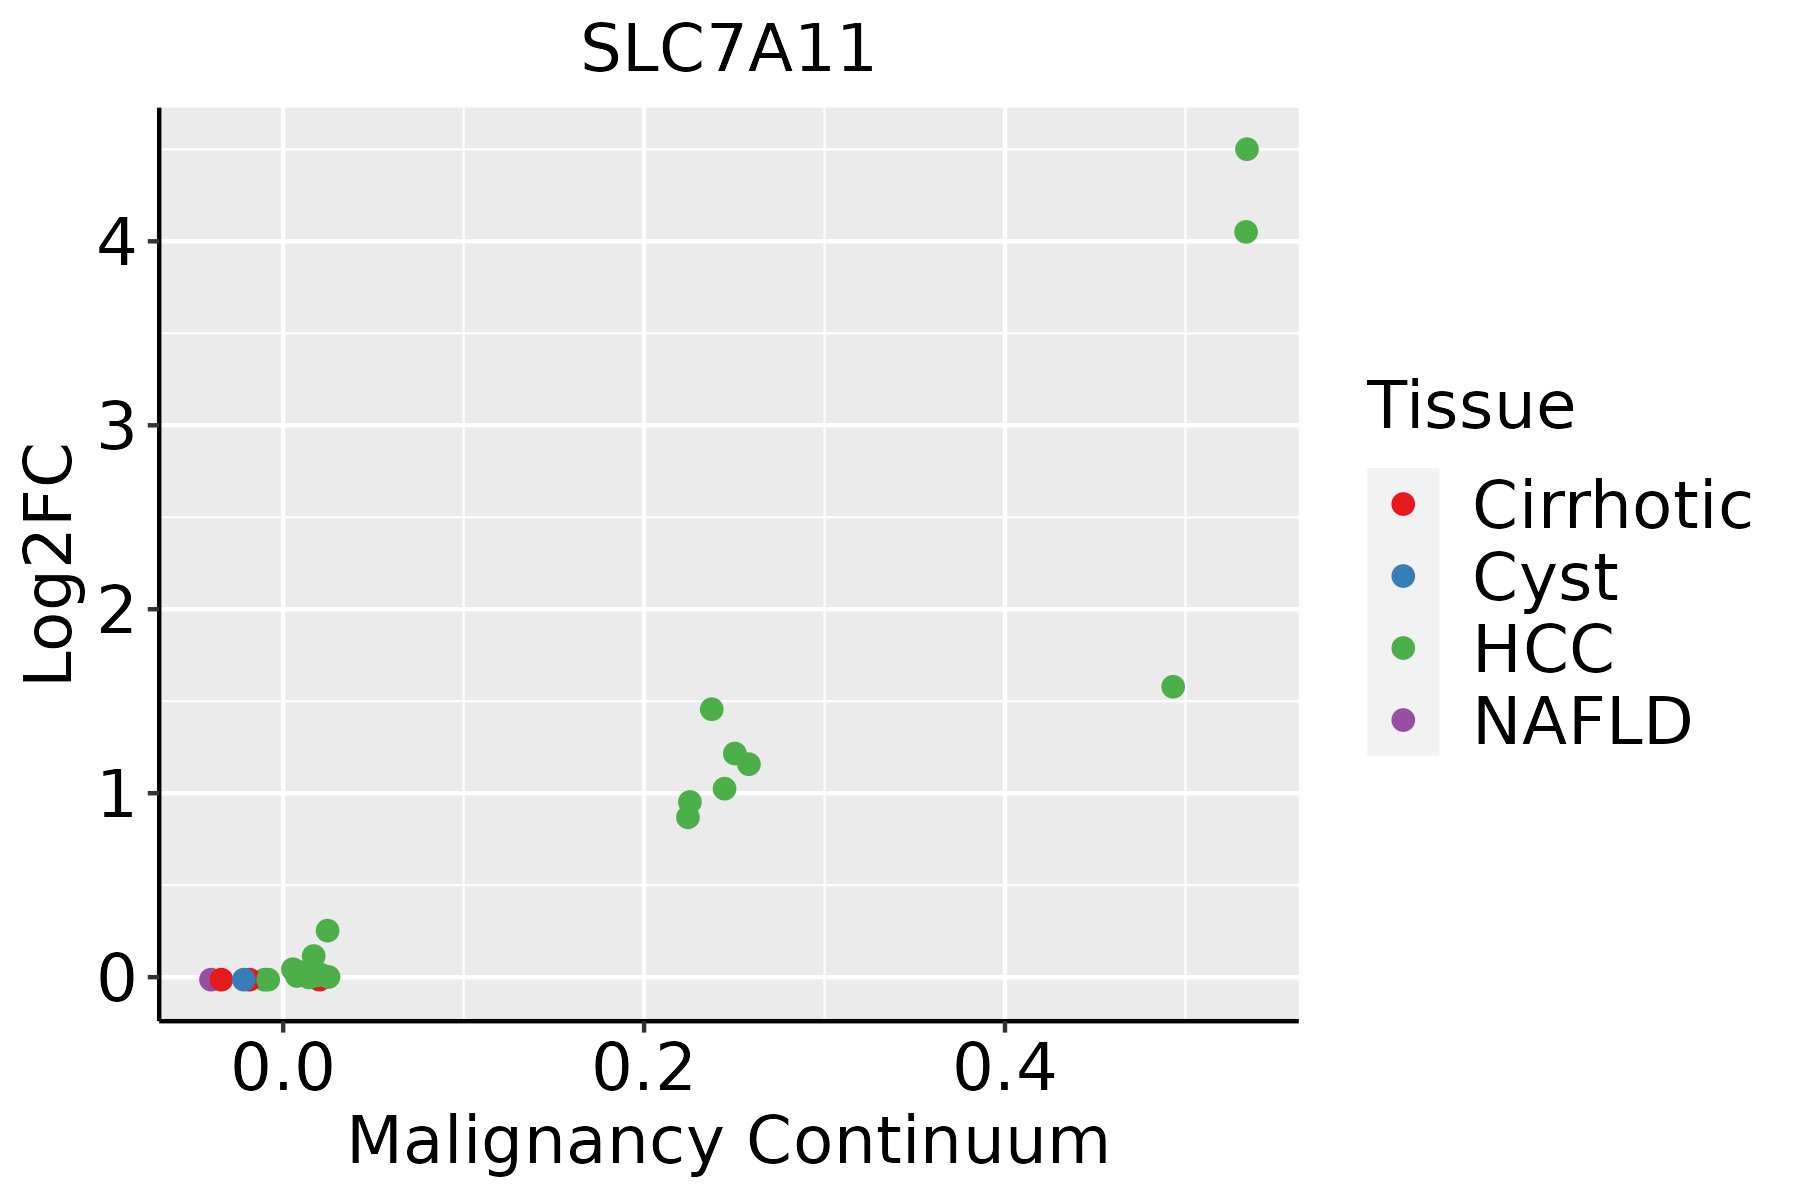 | HCC: Hepatocellular carcinoma |
| NAFLD: Non-alcoholic fatty liver disease | ||
| Oral Cavity | 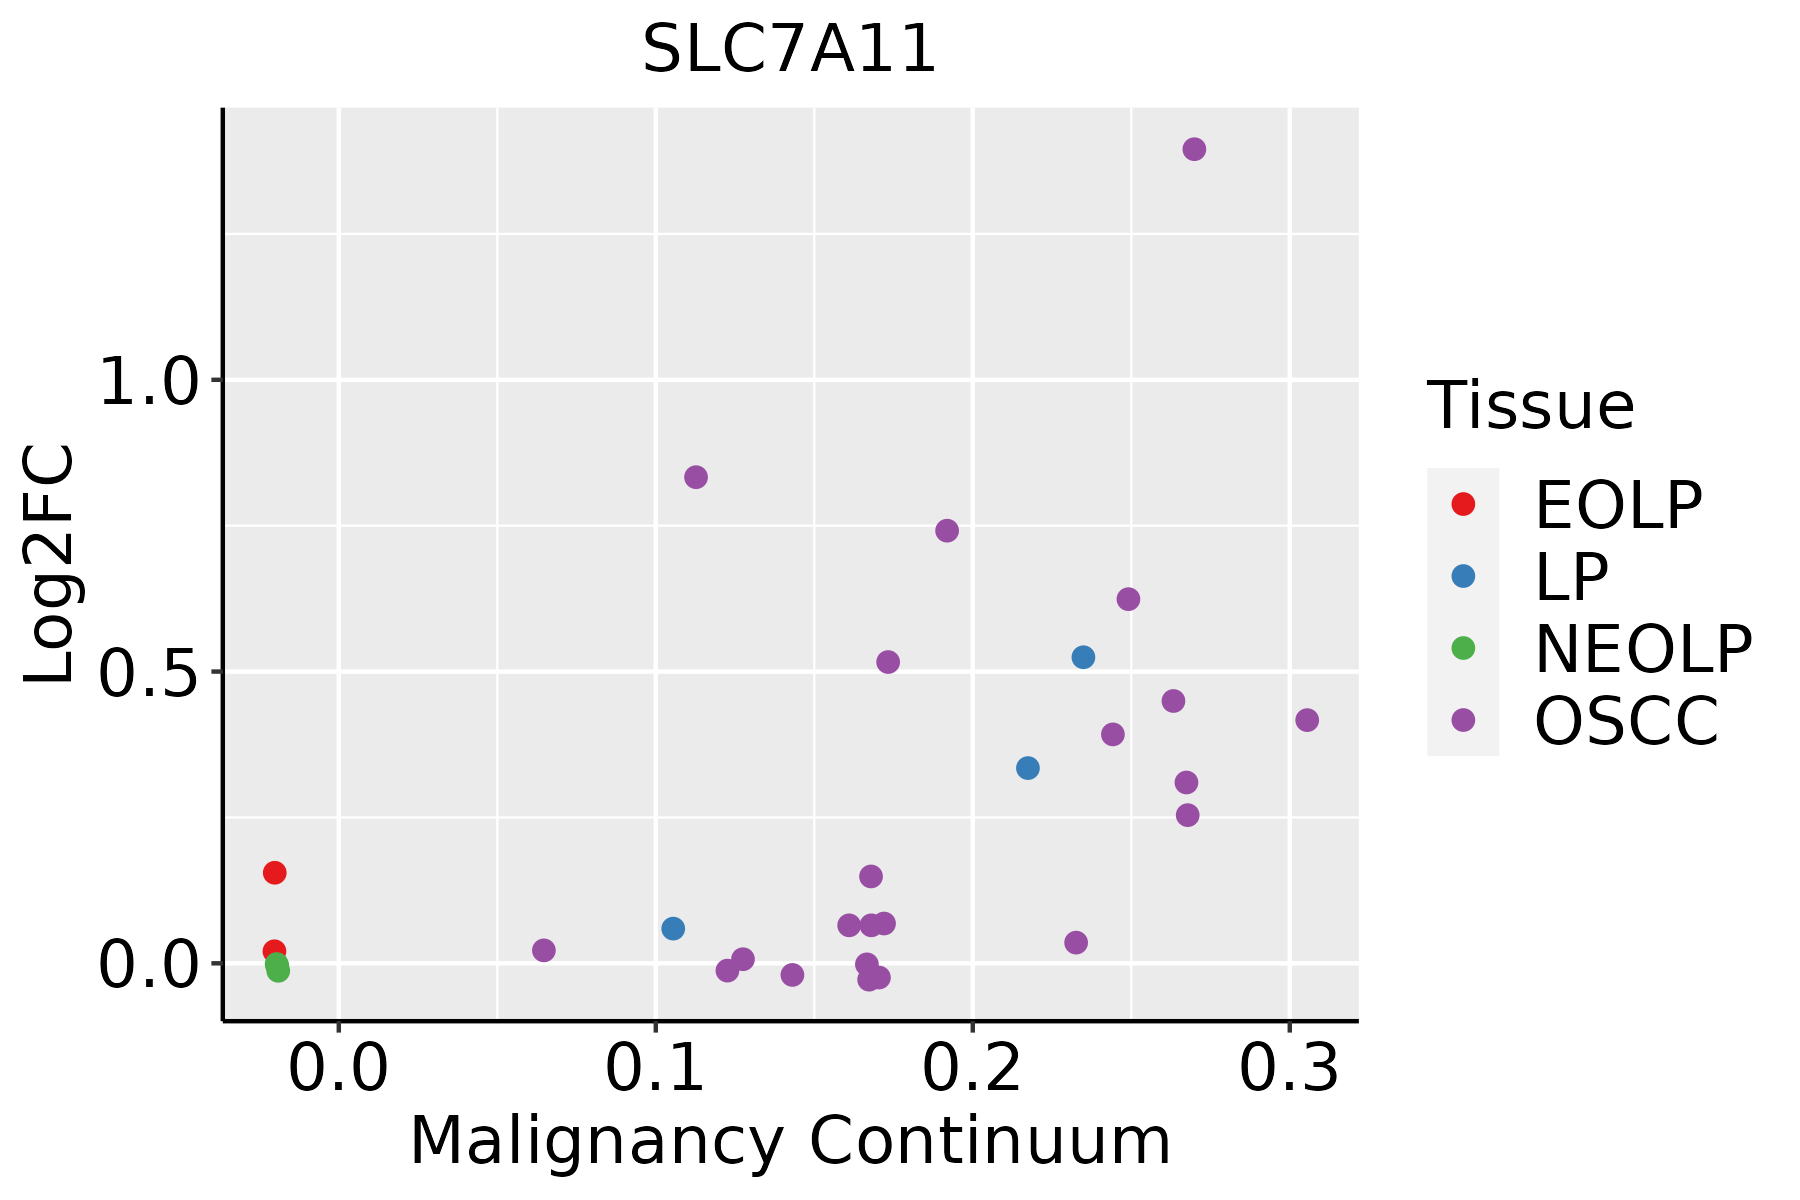 | EOLP: Erosive Oral lichen planus |
| LP: leukoplakia | ||
| NEOLP: Non-erosive oral lichen planus | ||
| OSCC: Oral squamous cell carcinoma | ||
| Prostate |  | BPH: Benign Prostatic Hyperplasia |
| Thyroid | 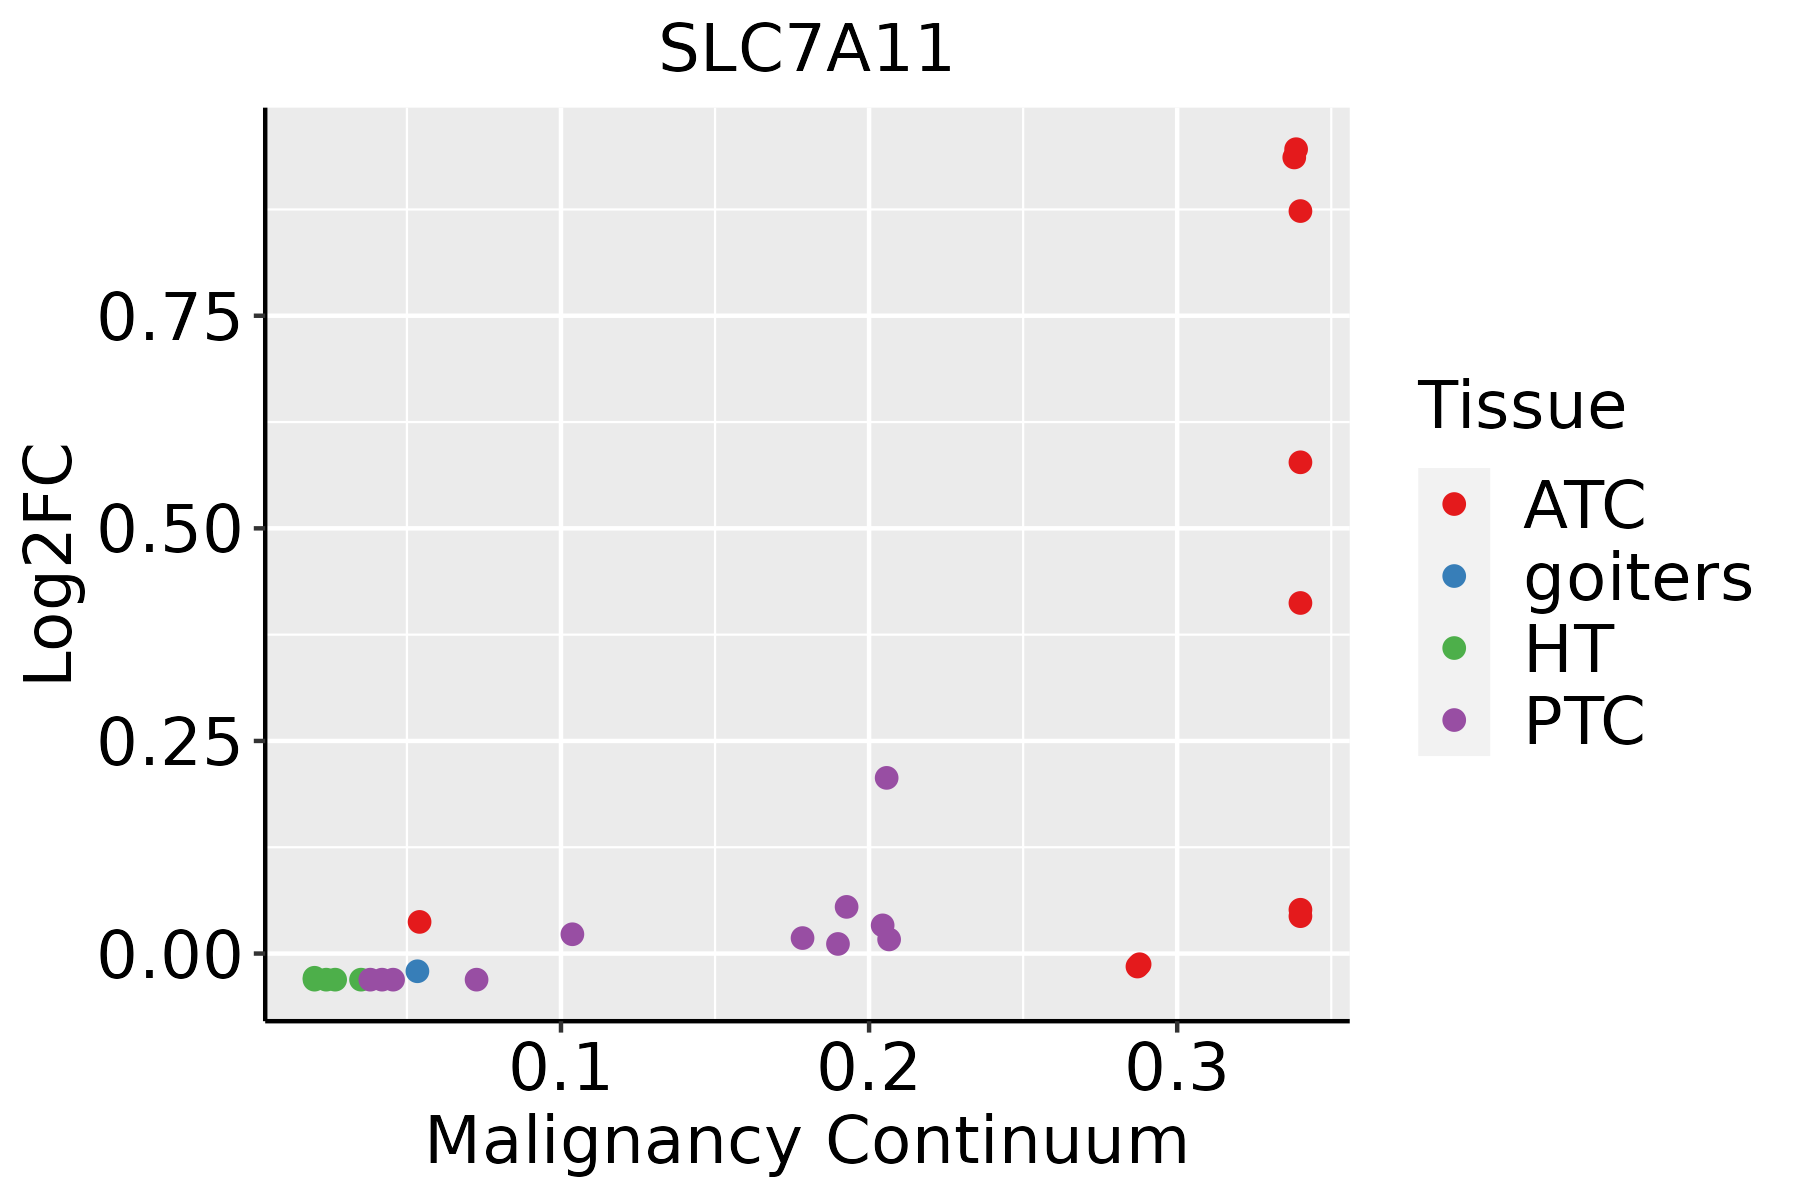 | ATC: Anaplastic thyroid cancer |
| HT: Hashimoto's thyroiditis | ||
| PTC: Papillary thyroid cancer |
| ∗log2FC in expression of this searched gene in stem-like cells from each diseased tissue sample relative to stem-like cells in normal samples in each tissue plotted against the malignancy continuum. Samples are colored based on if they are from different disease stage. |
Top |
Malignant transformation related pathway analysis |
| Find out the enriched GO biological processes and KEGG pathways involved in transition from healthy to precancer to cancer |
| Tissue | Disease Stage | Enriched GO biological Processes |
| Colorectum | AD |  |
| Colorectum | SER |  |
| Colorectum | MSS |  |
| Colorectum | MSI-H |  |
| Colorectum | FAP |  |
| ∗Top 15 enriched GO BP terms are showed in the bar plot of each disease state in each tissue. Each row represents a significant GO biological process which is colored according to the -log10(p.adjust). |
| Page: 1 2 3 4 5 6 7 8 9 |
| GO ID | Tissue | Disease Stage | Description | Gene Ratio | Bg Ratio | pvalue | p.adjust | Count |
| GO:0006979111 | Esophagus | ESCC | response to oxidative stress | 303/8552 | 446/18723 | 7.15e-22 | 1.30e-19 | 303 |
| GO:0062197111 | Esophagus | ESCC | cellular response to chemical stress | 234/8552 | 337/18723 | 5.37e-19 | 5.97e-17 | 234 |
| GO:0034599111 | Esophagus | ESCC | cellular response to oxidative stress | 197/8552 | 288/18723 | 3.76e-15 | 2.15e-13 | 197 |
| GO:000931419 | Esophagus | ESCC | response to radiation | 277/8552 | 456/18723 | 4.42e-11 | 1.43e-09 | 277 |
| GO:190547519 | Esophagus | ESCC | regulation of protein localization to membrane | 117/8552 | 175/18723 | 1.14e-08 | 2.26e-07 | 117 |
| GO:0070997111 | Esophagus | ESCC | neuron death | 216/8552 | 361/18723 | 3.49e-08 | 6.45e-07 | 216 |
| GO:0002262111 | Esophagus | ESCC | myeloid cell homeostasis | 104/8552 | 157/18723 | 1.49e-07 | 2.36e-06 | 104 |
| GO:00067906 | Esophagus | ESCC | sulfur compound metabolic process | 201/8552 | 339/18723 | 2.64e-07 | 3.94e-06 | 201 |
| GO:004206027 | Esophagus | ESCC | wound healing | 243/8552 | 422/18723 | 4.62e-07 | 6.25e-06 | 243 |
| GO:0048872111 | Esophagus | ESCC | homeostasis of number of cells | 163/8552 | 272/18723 | 1.40e-06 | 1.69e-05 | 163 |
| GO:00442725 | Esophagus | ESCC | sulfur compound biosynthetic process | 96/8552 | 148/18723 | 1.86e-06 | 2.16e-05 | 96 |
| GO:1901214111 | Esophagus | ESCC | regulation of neuron death | 186/8552 | 319/18723 | 3.35e-06 | 3.73e-05 | 186 |
| GO:00303239 | Esophagus | ESCC | respiratory tube development | 112/8552 | 181/18723 | 7.82e-06 | 7.69e-05 | 112 |
| GO:00605417 | Esophagus | ESCC | respiratory system development | 123/8552 | 203/18723 | 1.26e-05 | 1.15e-04 | 123 |
| GO:00303249 | Esophagus | ESCC | lung development | 109/8552 | 177/18723 | 1.40e-05 | 1.27e-04 | 109 |
| GO:000941611 | Esophagus | ESCC | response to light stimulus | 183/8552 | 320/18723 | 2.03e-05 | 1.76e-04 | 183 |
| GO:00065757 | Esophagus | ESCC | cellular modified amino acid metabolic process | 112/8552 | 188/18723 | 8.31e-05 | 6.06e-04 | 112 |
| GO:00423986 | Esophagus | ESCC | cellular modified amino acid biosynthetic process | 34/8552 | 46/18723 | 9.39e-05 | 6.70e-04 | 34 |
| GO:000963620 | Esophagus | ESCC | response to toxic substance | 150/8552 | 262/18723 | 1.00e-04 | 7.12e-04 | 150 |
| GO:00620129 | Esophagus | ESCC | regulation of small molecule metabolic process | 184/8552 | 334/18723 | 3.11e-04 | 1.85e-03 | 184 |
| Page: 1 2 3 4 5 6 7 8 9 10 11 12 13 14 15 |
| Pathway ID | Tissue | Disease Stage | Description | Gene Ratio | Bg Ratio | pvalue | p.adjust | qvalue | Count |
| hsa0421629 | Esophagus | ESCC | Ferroptosis | 33/4205 | 41/8465 | 4.58e-05 | 1.99e-04 | 1.02e-04 | 33 |
| hsa0421638 | Esophagus | ESCC | Ferroptosis | 33/4205 | 41/8465 | 4.58e-05 | 1.99e-04 | 1.02e-04 | 33 |
| hsa0421641 | Liver | HCC | Ferroptosis | 33/4020 | 41/8465 | 1.42e-05 | 9.88e-05 | 5.50e-05 | 33 |
| hsa0421651 | Liver | HCC | Ferroptosis | 33/4020 | 41/8465 | 1.42e-05 | 9.88e-05 | 5.50e-05 | 33 |
| hsa0421620 | Oral cavity | OSCC | Ferroptosis | 29/3704 | 41/8465 | 4.26e-04 | 1.30e-03 | 6.60e-04 | 29 |
| hsa04216110 | Oral cavity | OSCC | Ferroptosis | 29/3704 | 41/8465 | 4.26e-04 | 1.30e-03 | 6.60e-04 | 29 |
| hsa0421626 | Prostate | Tumor | Ferroptosis | 24/1791 | 41/8465 | 1.94e-07 | 2.14e-06 | 1.33e-06 | 24 |
| hsa0421636 | Prostate | Tumor | Ferroptosis | 24/1791 | 41/8465 | 1.94e-07 | 2.14e-06 | 1.33e-06 | 24 |
| Page: 1 |
Top |
Cell-cell communication analysis |
| Identification of potential cell-cell interactions between two cell types and their ligand-receptor pairs for different disease states |
| Ligand | Receptor | LRpair | Pathway | Tissue | Disease Stage |
| Page: 1 |
Top |
Single-cell gene regulatory network inference analysis |
| Find out the significant the regulons (TFs) and the target genes of each regulon across cell types for different disease states |
| TF | Cell Type | Tissue | Disease Stage | Target Gene | RSS | Regulon Activity |
| ∗The dot plots of a searched regulon are shown for all cell subpopulations in each disease state of each tissue based on the regulon specific score inferred using pySCENIC and by calculating the average expression. |
| Page: 1 |
Top |
Somatic mutation of malignant transformation related genes |
| Annotation of somatic variants for genes involved in malignant transformation |
| Hugo Symbol | Variant Class | Variant Classification | dbSNP RS | HGVSc | HGVSp | HGVSp Short | SWISSPROT | BIOTYPE | SIFT | PolyPhen | Tumor Sample Barcode | Tissue | Histology | Sex | Age | Stage | Therapy Types | Drugs | Outcome |
| SLC7A11 | SNV | Missense_Mutation | novel | c.1412A>G | p.Asp471Gly | p.D471G | Q9UPY5 | protein_coding | tolerated(0.34) | benign(0.005) | TCGA-AN-A046-01 | Breast | breast invasive carcinoma | Female | >=65 | I/II | Unknown | Unknown | SD |
| SLC7A11 | SNV | Missense_Mutation | novel | c.1483N>A | p.Val495Ile | p.V495I | Q9UPY5 | protein_coding | tolerated(0.29) | benign(0.018) | TCGA-C8-A8HP-01 | Breast | breast invasive carcinoma | Female | <65 | III/IV | Chemotherapy | 5-fluorouracil | CR |
| SLC7A11 | SNV | Missense_Mutation | novel | c.538N>C | p.Asn180His | p.N180H | Q9UPY5 | protein_coding | deleterious(0) | probably_damaging(0.996) | TCGA-D8-A1Y3-01 | Breast | breast invasive carcinoma | Female | <65 | III/IV | Chemotherapy | doxorubicine+cyclophosphamide | SD |
| SLC7A11 | SNV | Missense_Mutation | novel | c.197C>T | p.Pro66Leu | p.P66L | Q9UPY5 | protein_coding | deleterious(0) | probably_damaging(0.999) | TCGA-C5-A7X5-01 | Cervix | cervical & endocervical cancer | Female | >=65 | I/II | Chemotherapy | carboplatin | PD |
| SLC7A11 | SNV | Missense_Mutation | c.787N>A | p.Glu263Lys | p.E263K | Q9UPY5 | protein_coding | tolerated(0.1) | benign(0.101) | TCGA-LP-A5U2-01 | Cervix | cervical & endocervical cancer | Female | <65 | III/IV | Unknown | Unknown | SD | |
| SLC7A11 | SNV | Missense_Mutation | rs760898836 | c.959N>T | p.Pro320Leu | p.P320L | Q9UPY5 | protein_coding | deleterious(0.01) | probably_damaging(0.999) | TCGA-VS-A94Z-01 | Cervix | cervical & endocervical cancer | Female | <65 | I/II | Chemotherapy | cisplatin | CR |
| SLC7A11 | SNV | Missense_Mutation | novel | c.854N>T | p.Asn285Ile | p.N285I | Q9UPY5 | protein_coding | deleterious(0.02) | probably_damaging(0.996) | TCGA-A6-3808-01 | Colorectum | colon adenocarcinoma | Male | >=65 | I/II | Unknown | Unknown | SD |
| SLC7A11 | SNV | Missense_Mutation | c.802N>A | p.Leu268Ile | p.L268I | Q9UPY5 | protein_coding | deleterious(0.01) | possibly_damaging(0.53) | TCGA-AD-5900-01 | Colorectum | colon adenocarcinoma | Male | >=65 | I/II | Unknown | Unknown | SD | |
| SLC7A11 | SNV | Missense_Mutation | c.167C>T | p.Thr56Ile | p.T56I | Q9UPY5 | protein_coding | deleterious(0.02) | benign(0.085) | TCGA-AZ-6599-01 | Colorectum | colon adenocarcinoma | Male | >=65 | I/II | Unknown | Unknown | SD | |
| SLC7A11 | SNV | Missense_Mutation | novel | c.941N>C | p.Asn314Thr | p.N314T | Q9UPY5 | protein_coding | tolerated(0.73) | benign(0.027) | TCGA-CA-6717-01 | Colorectum | colon adenocarcinoma | Male | <65 | I/II | Chemotherapy | oxaliplatin | CR |
| Page: 1 2 3 4 5 |
Top |
Related drugs of malignant transformation related genes |
| Identification of chemicals and drugs interact with genes involved in malignant transfromation |
| (DGIdb 4.0) |
| Entrez ID | Symbol | Category | Interaction Types | Drug Claim Name | Drug Name | PMIDs |
| 23657 | SLC7A11 | TRANSPORTER, DRUGGABLE GENOME, CELL SURFACE | RILUZOLE | RILUZOLE | ||
| 23657 | SLC7A11 | TRANSPORTER, DRUGGABLE GENOME, CELL SURFACE | inhibitor | 135650876 | QUISQUALATE |
| Page: 1 |

Copyright 2023-Present -The University of Texas Health Science Center at Houston |