
|
|||||
|
 | |
| |
| |
| |
| |
| |
|
Gene: SLC6A8 |
Gene summary for SLC6A8 |
| Gene information | Species | Human | Gene symbol | SLC6A8 | Gene ID | 6535 |
| Gene name | solute carrier family 6 member 8 | |
| Gene Alias | CCDS1 | |
| Cytomap | Xq28 | |
| Gene Type | protein-coding | GO ID | GO:0003008 | UniProtAcc | P48029 |
Top |
Malignant transformation analysis |
| Identification of the aberrant gene expression in precancerous and cancerous lesions by comparing the gene expression of stem-like cells in diseased tissues with normal stem cells |
| Entrez ID | Symbol | Replicates | Species | Organ | Tissue | Adj P-value | Log2FC | Malignancy |
| 6535 | SLC6A8 | CA_HPV_2 | Human | Cervix | CC | 3.30e-03 | 2.14e-01 | 0.0391 |
| 6535 | SLC6A8 | CA_HPV_3 | Human | Cervix | CC | 5.53e-03 | 8.31e-02 | 0.0414 |
| 6535 | SLC6A8 | Tumor | Human | Cervix | CC | 2.45e-20 | 5.13e-01 | 0.1241 |
| 6535 | SLC6A8 | sample1 | Human | Cervix | CC | 4.13e-07 | 4.99e-01 | 0.0959 |
| 6535 | SLC6A8 | sample3 | Human | Cervix | CC | 5.03e-43 | 7.97e-01 | 0.1387 |
| 6535 | SLC6A8 | T1 | Human | Cervix | CC | 1.89e-11 | 4.60e-01 | 0.0918 |
| 6535 | SLC6A8 | T3 | Human | Cervix | CC | 2.05e-36 | 7.67e-01 | 0.1389 |
| 6535 | SLC6A8 | HTA11_2487_2000001011 | Human | Colorectum | SER | 6.75e-17 | 1.02e+00 | -0.1808 |
| 6535 | SLC6A8 | HTA11_347_2000001011 | Human | Colorectum | AD | 1.53e-02 | 2.91e-01 | -0.1954 |
| 6535 | SLC6A8 | HTA11_411_2000001011 | Human | Colorectum | SER | 4.53e-05 | 1.30e+00 | -0.2602 |
| 6535 | SLC6A8 | HTA11_2112_2000001011 | Human | Colorectum | SER | 1.14e-05 | 1.34e+00 | -0.2196 |
| 6535 | SLC6A8 | HTA11_3361_2000001011 | Human | Colorectum | AD | 9.63e-03 | 3.36e-01 | -0.1207 |
| 6535 | SLC6A8 | HTA11_696_2000001011 | Human | Colorectum | AD | 1.08e-09 | 4.10e-01 | -0.1464 |
| 6535 | SLC6A8 | HTA11_1391_2000001011 | Human | Colorectum | AD | 1.63e-04 | 3.36e-01 | -0.059 |
| 6535 | SLC6A8 | HTA11_5212_2000001011 | Human | Colorectum | AD | 3.10e-06 | 1.19e+00 | -0.2061 |
| 6535 | SLC6A8 | LZE2T | Human | Esophagus | ESCC | 1.09e-05 | 6.54e-01 | 0.082 |
| 6535 | SLC6A8 | LZE4T | Human | Esophagus | ESCC | 9.08e-12 | 3.03e-01 | 0.0811 |
| 6535 | SLC6A8 | LZE7T | Human | Esophagus | ESCC | 3.55e-14 | 9.95e-01 | 0.0667 |
| 6535 | SLC6A8 | LZE20T | Human | Esophagus | ESCC | 1.45e-06 | 6.72e-01 | 0.0662 |
| 6535 | SLC6A8 | LZE22T | Human | Esophagus | ESCC | 1.16e-02 | 3.99e-01 | 0.068 |
| Page: 1 2 3 4 5 6 |
| Tissue | Expression Dynamics | Abbreviation |
| Cervix |  | CC: Cervix cancer |
| HSIL_HPV: HPV-infected high-grade squamous intraepithelial lesions | ||
| N_HPV: HPV-infected normal cervix | ||
| Colorectum (GSE201348) |  | FAP: Familial adenomatous polyposis |
| CRC: Colorectal cancer | ||
| Colorectum (HTA11) |  | AD: Adenomas |
| SER: Sessile serrated lesions | ||
| MSI-H: Microsatellite-high colorectal cancer | ||
| MSS: Microsatellite stable colorectal cancer | ||
| Esophagus | 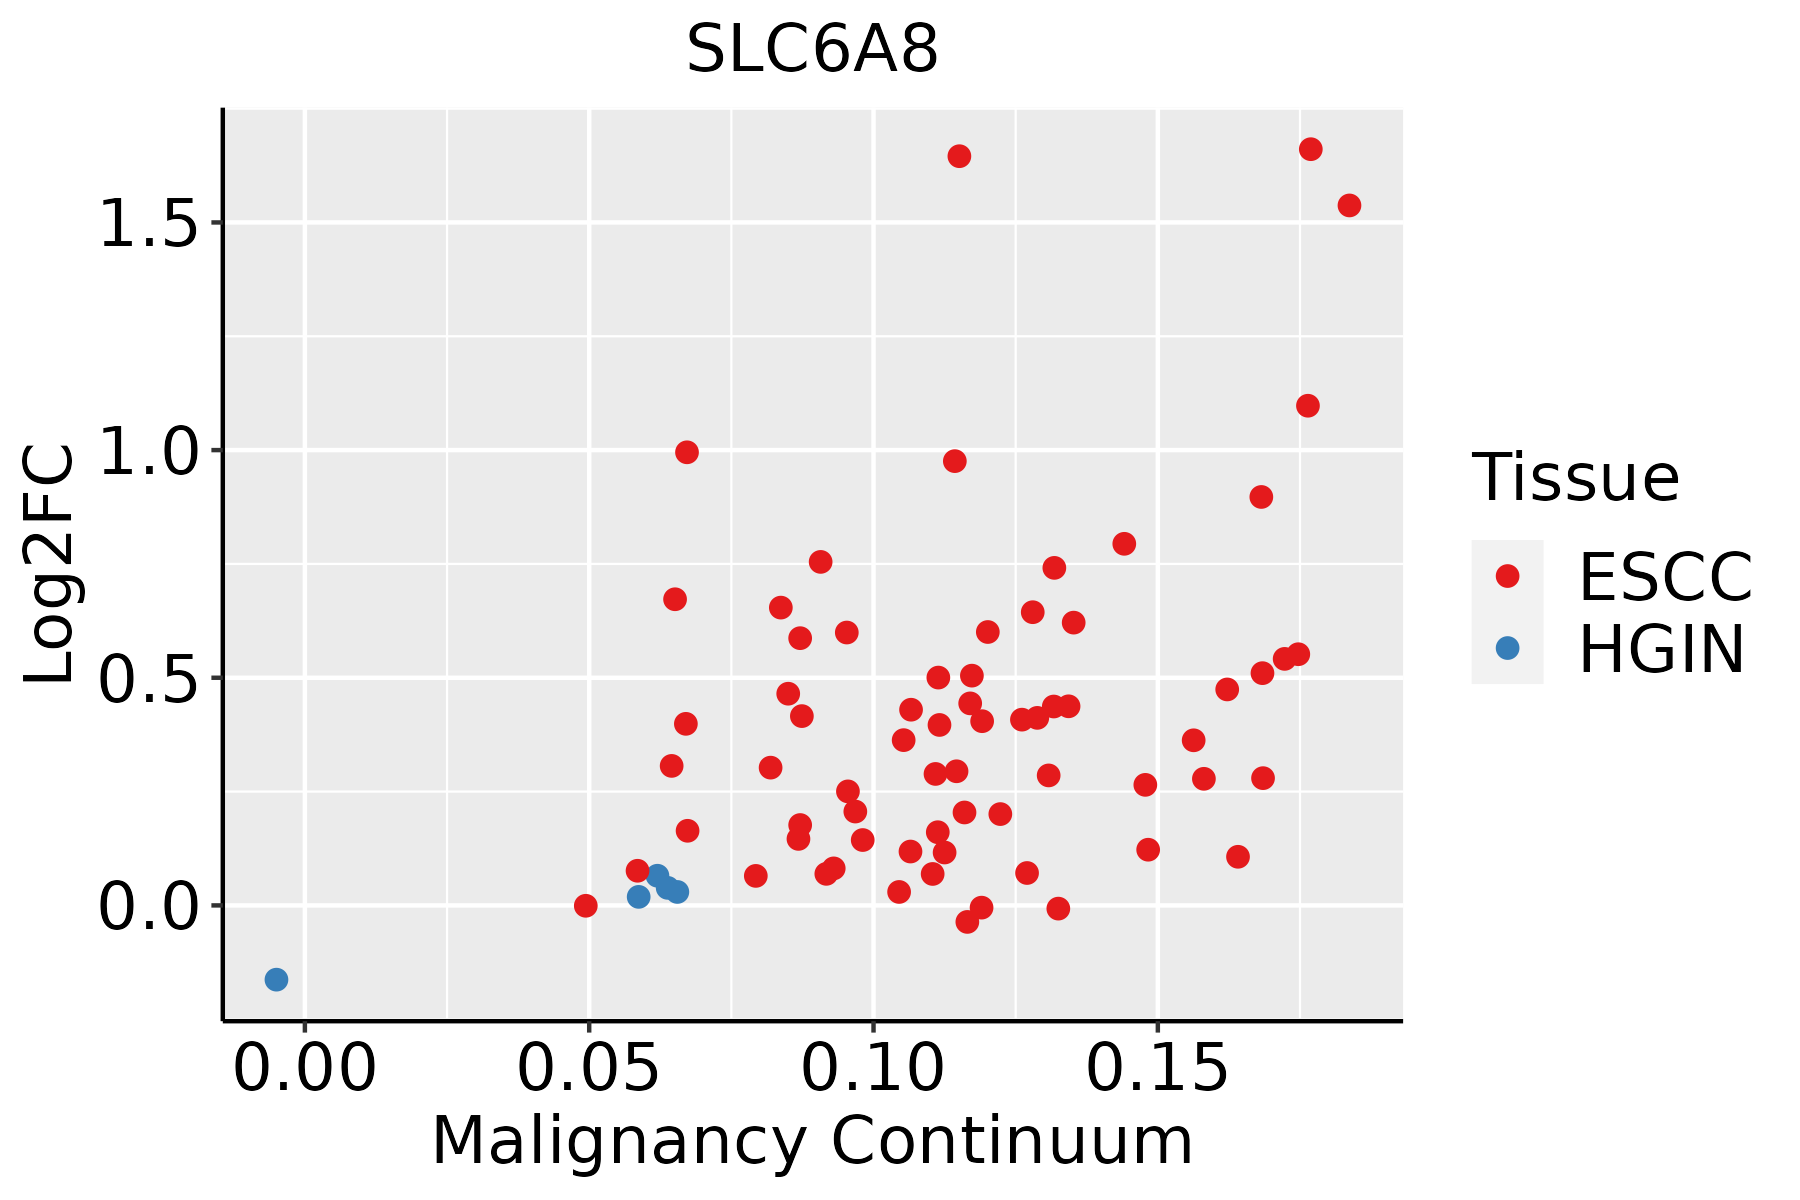 | ESCC: Esophageal squamous cell carcinoma |
| HGIN: High-grade intraepithelial neoplasias | ||
| LGIN: Low-grade intraepithelial neoplasias | ||
| GC |  | CAG: Chronic atrophic gastritis |
| CAG with IM: Chronic atrophic gastritis with intestinal metaplasia | ||
| CSG: Chronic superficial gastritis | ||
| GC: Gastric cancer | ||
| SIM: Severe intestinal metaplasia | ||
| WIM: Wild intestinal metaplasia | ||
| Liver | 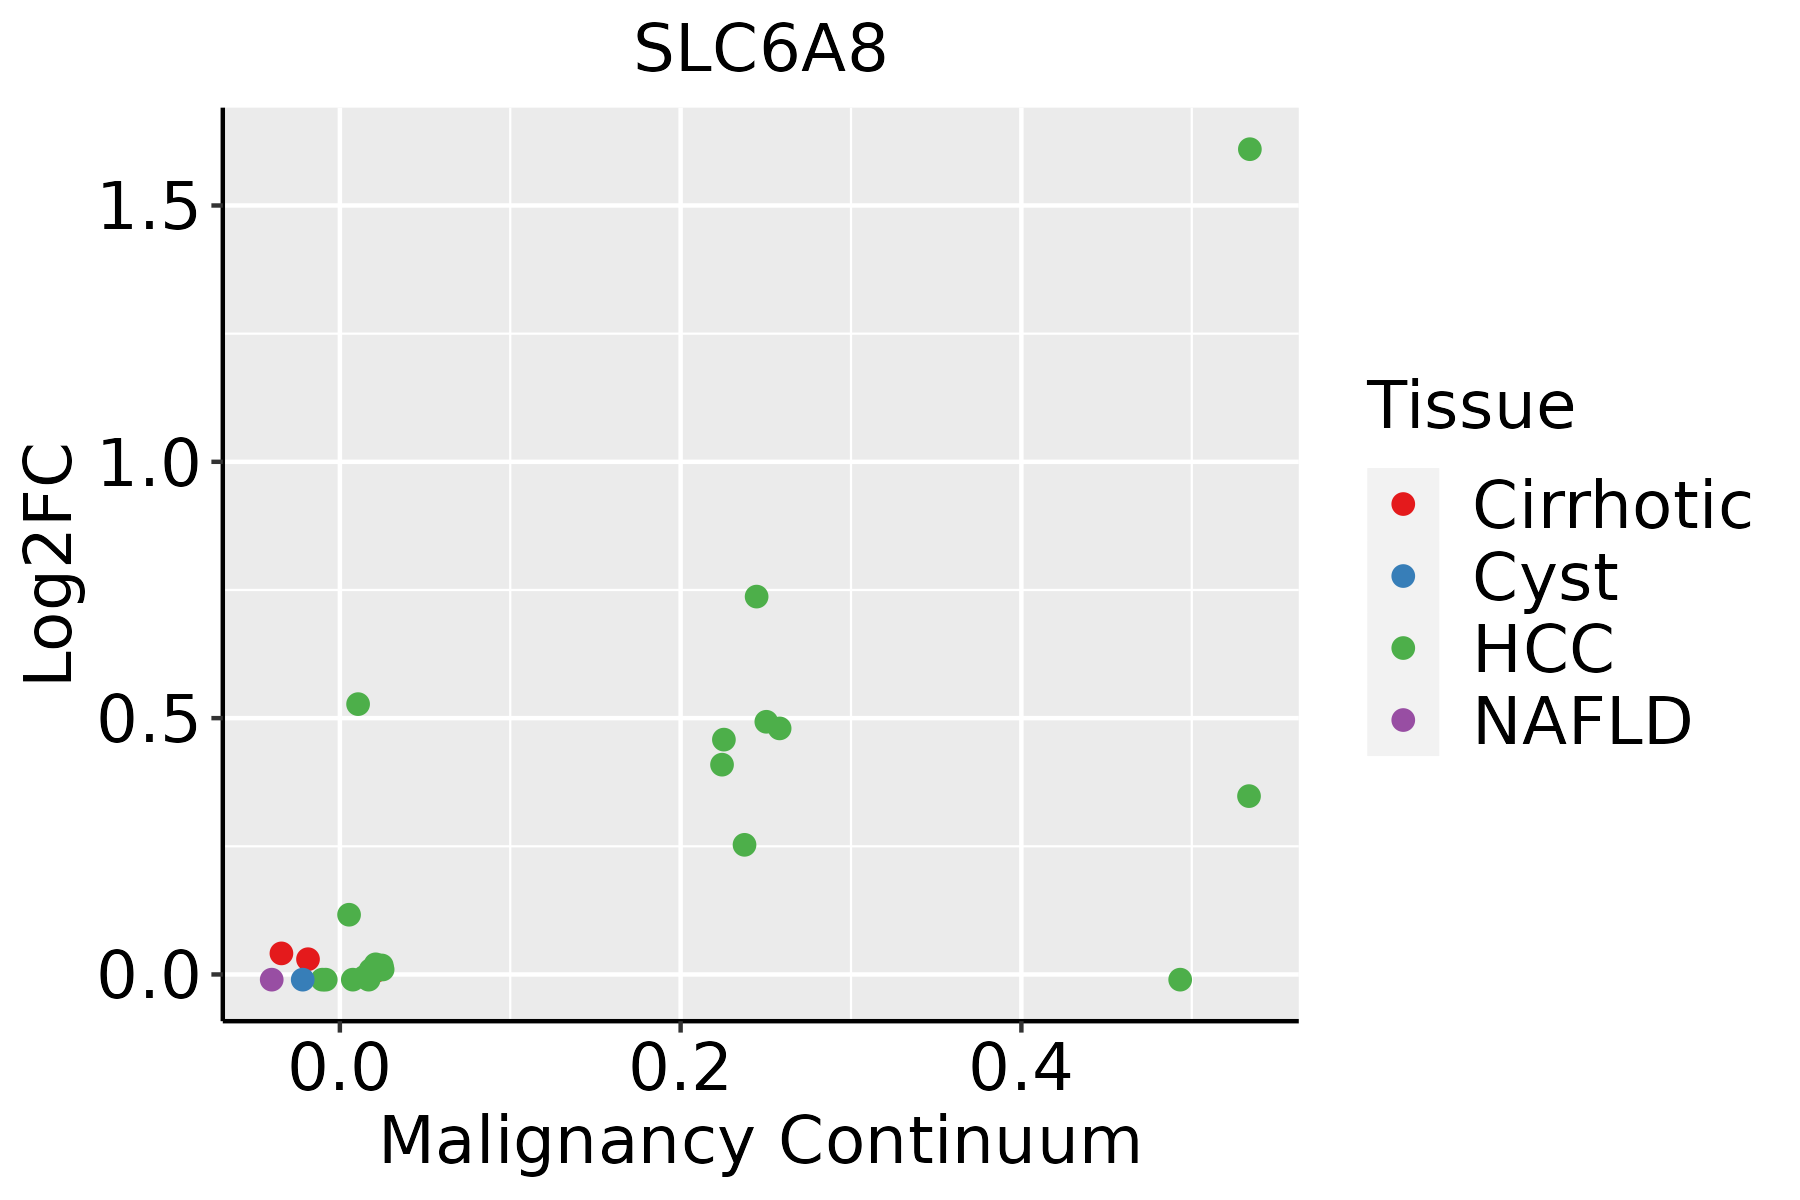 | HCC: Hepatocellular carcinoma |
| NAFLD: Non-alcoholic fatty liver disease | ||
| Oral Cavity | 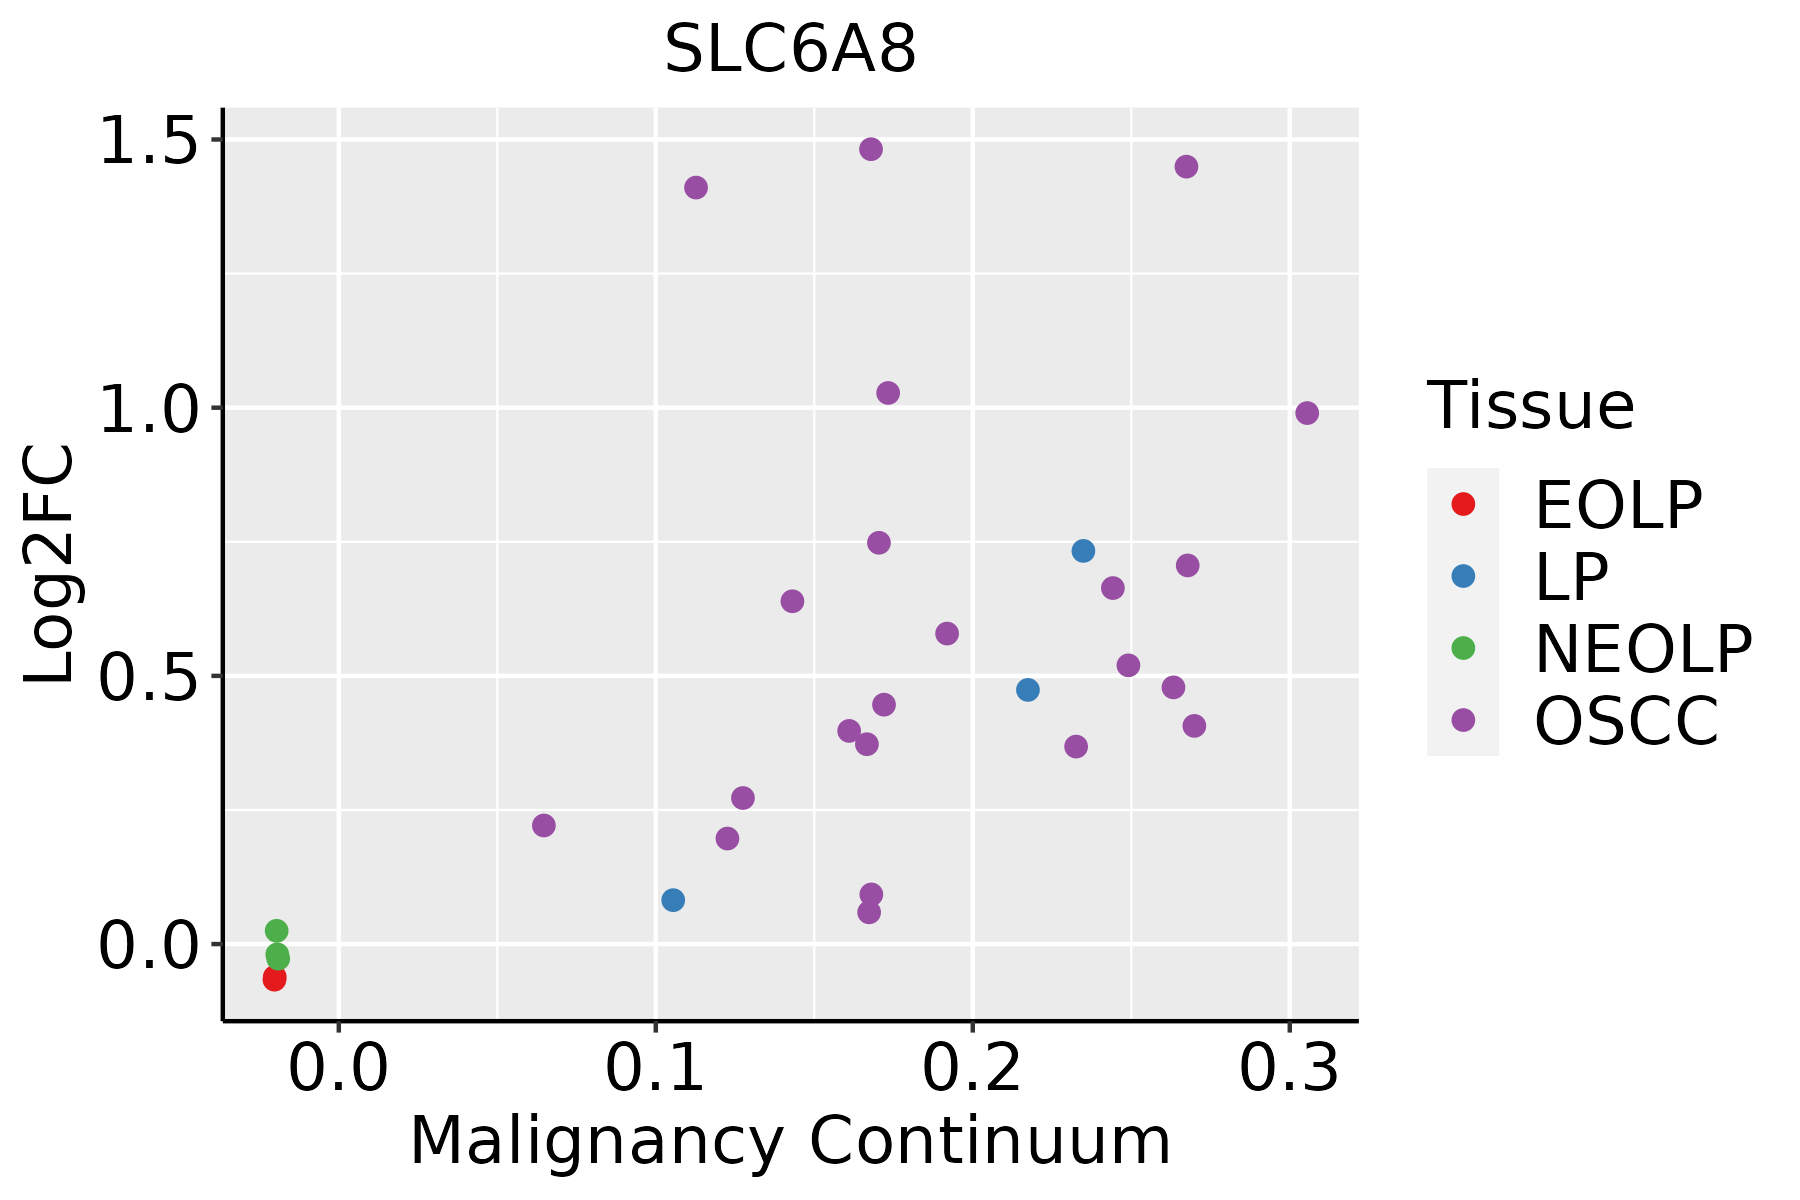 | EOLP: Erosive Oral lichen planus |
| LP: leukoplakia | ||
| NEOLP: Non-erosive oral lichen planus | ||
| OSCC: Oral squamous cell carcinoma | ||
| Skin |  | AK: Actinic keratosis |
| cSCC: Cutaneous squamous cell carcinoma | ||
| SCCIS:squamous cell carcinoma in situ |
| ∗log2FC in expression of this searched gene in stem-like cells from each diseased tissue sample relative to stem-like cells in normal samples in each tissue plotted against the malignancy continuum. Samples are colored based on if they are from different disease stage. |
Top |
Malignant transformation related pathway analysis |
| Find out the enriched GO biological processes and KEGG pathways involved in transition from healthy to precancer to cancer |
| Tissue | Disease Stage | Enriched GO biological Processes |
| Colorectum | AD |  |
| Colorectum | SER |  |
| Colorectum | MSS |  |
| Colorectum | MSI-H |  |
| Colorectum | FAP |  |
| ∗Top 15 enriched GO BP terms are showed in the bar plot of each disease state in each tissue. Each row represents a significant GO biological process which is colored according to the -log10(p.adjust). |
| Page: 1 2 3 4 5 6 7 8 9 |
| GO ID | Tissue | Disease Stage | Description | Gene Ratio | Bg Ratio | pvalue | p.adjust | Count |
| GO:0006575 | Colorectum | AD | cellular modified amino acid metabolic process | 59/3918 | 188/18723 | 4.80e-04 | 5.27e-03 | 59 |
| GO:0003012 | Colorectum | SER | muscle system process | 92/2897 | 452/18723 | 2.98e-03 | 2.63e-02 | 92 |
| GO:00065757 | Esophagus | ESCC | cellular modified amino acid metabolic process | 112/8552 | 188/18723 | 8.31e-05 | 6.06e-04 | 112 |
| GO:000657521 | Liver | HCC | cellular modified amino acid metabolic process | 119/7958 | 188/18723 | 6.47e-09 | 1.67e-07 | 119 |
| GO:00065756 | Oral cavity | OSCC | cellular modified amino acid metabolic process | 91/7305 | 188/18723 | 5.33e-03 | 2.07e-02 | 91 |
| GO:00065758 | Skin | cSCC | cellular modified amino acid metabolic process | 73/4864 | 188/18723 | 7.11e-05 | 6.85e-04 | 73 |
| Page: 1 |
| Pathway ID | Tissue | Disease Stage | Description | Gene Ratio | Bg Ratio | pvalue | p.adjust | qvalue | Count |
| Page: 1 |
Top |
Cell-cell communication analysis |
| Identification of potential cell-cell interactions between two cell types and their ligand-receptor pairs for different disease states |
| Ligand | Receptor | LRpair | Pathway | Tissue | Disease Stage |
| Page: 1 |
Top |
Single-cell gene regulatory network inference analysis |
| Find out the significant the regulons (TFs) and the target genes of each regulon across cell types for different disease states |
| TF | Cell Type | Tissue | Disease Stage | Target Gene | RSS | Regulon Activity |
| ∗The dot plots of a searched regulon are shown for all cell subpopulations in each disease state of each tissue based on the regulon specific score inferred using pySCENIC and by calculating the average expression. |
| Page: 1 |
Top |
Somatic mutation of malignant transformation related genes |
| Annotation of somatic variants for genes involved in malignant transformation |
| Hugo Symbol | Variant Class | Variant Classification | dbSNP RS | HGVSc | HGVSp | HGVSp Short | SWISSPROT | BIOTYPE | SIFT | PolyPhen | Tumor Sample Barcode | Tissue | Histology | Sex | Age | Stage | Therapy Types | Drugs | Outcome |
| SLC6A8 | SNV | Missense_Mutation | c.1114N>A | p.Val372Met | p.V372M | P48029 | protein_coding | deleterious(0.04) | benign(0.378) | TCGA-A2-A04P-01 | Breast | breast invasive carcinoma | Female | <65 | III/IV | Chemotherapy | taxol | PD | |
| SLC6A8 | SNV | Missense_Mutation | c.393A>T | p.Lys131Asn | p.K131N | P48029 | protein_coding | deleterious(0.01) | possibly_damaging(0.836) | TCGA-AO-A128-01 | Breast | breast invasive carcinoma | Female | <65 | I/II | Chemotherapy | doxorubicin | SD | |
| SLC6A8 | SNV | Missense_Mutation | novel | c.620N>A | p.Arg207Gln | p.R207Q | P48029 | protein_coding | tolerated(0.19) | benign(0.066) | TCGA-GM-A3XL-01 | Breast | breast invasive carcinoma | Female | <65 | I/II | Chemotherapy | fluorouracil | CR |
| SLC6A8 | SNV | Missense_Mutation | c.208G>T | p.Val70Leu | p.V70L | P48029 | protein_coding | deleterious(0) | probably_damaging(0.989) | TCGA-EK-A3GK-01 | Cervix | cervical & endocervical cancer | Female | <65 | I/II | Unknown | Unknown | SD | |
| SLC6A8 | SNV | Missense_Mutation | c.1118A>C | p.His373Pro | p.H373P | P48029 | protein_coding | tolerated(1) | benign(0) | TCGA-FU-A3HZ-01 | Cervix | cervical & endocervical cancer | Female | <65 | I/II | Chemotherapy | cisplatin | CR | |
| SLC6A8 | SNV | Missense_Mutation | c.186N>G | p.Ile62Met | p.I62M | P48029 | protein_coding | tolerated(0.09) | probably_damaging(0.979) | TCGA-VS-A8EC-01 | Cervix | cervical & endocervical cancer | Female | <65 | III/IV | Chemotherapy | carboplatin | CR | |
| SLC6A8 | SNV | Missense_Mutation | novel | c.464N>A | p.Gly155Asp | p.G155D | P48029 | protein_coding | deleterious(0) | possibly_damaging(0.763) | TCGA-A6-2686-01 | Colorectum | colon adenocarcinoma | Female | >=65 | I/II | Unknown | Unknown | SD |
| SLC6A8 | SNV | Missense_Mutation | rs782802482 | c.833N>A | p.Arg278His | p.R278H | P48029 | protein_coding | tolerated(0.07) | possibly_damaging(0.751) | TCGA-A6-6780-01 | Colorectum | colon adenocarcinoma | Male | >=65 | I/II | Unknown | Unknown | SD |
| SLC6A8 | SNV | Missense_Mutation | c.497C>T | p.Thr166Met | p.T166M | P48029 | protein_coding | deleterious(0.03) | possibly_damaging(0.553) | TCGA-NH-A5IV-01 | Colorectum | colon adenocarcinoma | Female | >=65 | I/II | Unknown | Unknown | SD | |
| SLC6A8 | SNV | Missense_Mutation | rs373570632 | c.1888G>A | p.Val630Met | p.V630M | P48029 | protein_coding | tolerated(0.07) | benign(0.402) | TCGA-WS-AB45-01 | Colorectum | colon adenocarcinoma | Female | <65 | I/II | Unknown | Unknown | SD |
| Page: 1 2 3 4 5 |
Top |
Related drugs of malignant transformation related genes |
| Identification of chemicals and drugs interact with genes involved in malignant transfromation |
| (DGIdb 4.0) |
| Entrez ID | Symbol | Category | Interaction Types | Drug Claim Name | Drug Name | PMIDs |
| Page: 1 |

Copyright 2023-Present -The University of Texas Health Science Center at Houston |