
|
|||||
|
 | |
| |
| |
| |
| |
| |
|
Gene: SLC6A19 |
Gene summary for SLC6A19 |
| Gene information | Species | Human | Gene symbol | SLC6A19 | Gene ID | 340024 |
| Gene name | solute carrier family 6 member 19 | |
| Gene Alias | B0AT1 | |
| Cytomap | 5p15.33 | |
| Gene Type | protein-coding | GO ID | GO:0003333 | UniProtAcc | Q695T7 |
Top |
Malignant transformation analysis |
| Identification of the aberrant gene expression in precancerous and cancerous lesions by comparing the gene expression of stem-like cells in diseased tissues with normal stem cells |
| Entrez ID | Symbol | Replicates | Species | Organ | Tissue | Adj P-value | Log2FC | Malignancy |
| 340024 | SLC6A19 | Pat01-B | Human | Stomach | GC | 1.20e-52 | 9.96e-01 | 0.5754 |
| 340024 | SLC6A19 | Pat03-B | Human | Stomach | GC | 5.15e-28 | 6.76e-01 | 0.3693 |
| 340024 | SLC6A19 | Pat17-B | Human | Stomach | GC | 2.71e-07 | 3.82e-01 | 0.3109 |
| 340024 | SLC6A19 | SIM_1 | Human | Stomach | SIM | 6.82e-04 | 3.02e-01 | 0.3573 |
| 340024 | SLC6A19 | SIM_4 | Human | Stomach | SIM | 5.40e-04 | 2.47e-01 | 0.2664 |
| Page: 1 |
| Tissue | Expression Dynamics | Abbreviation |
| GC | 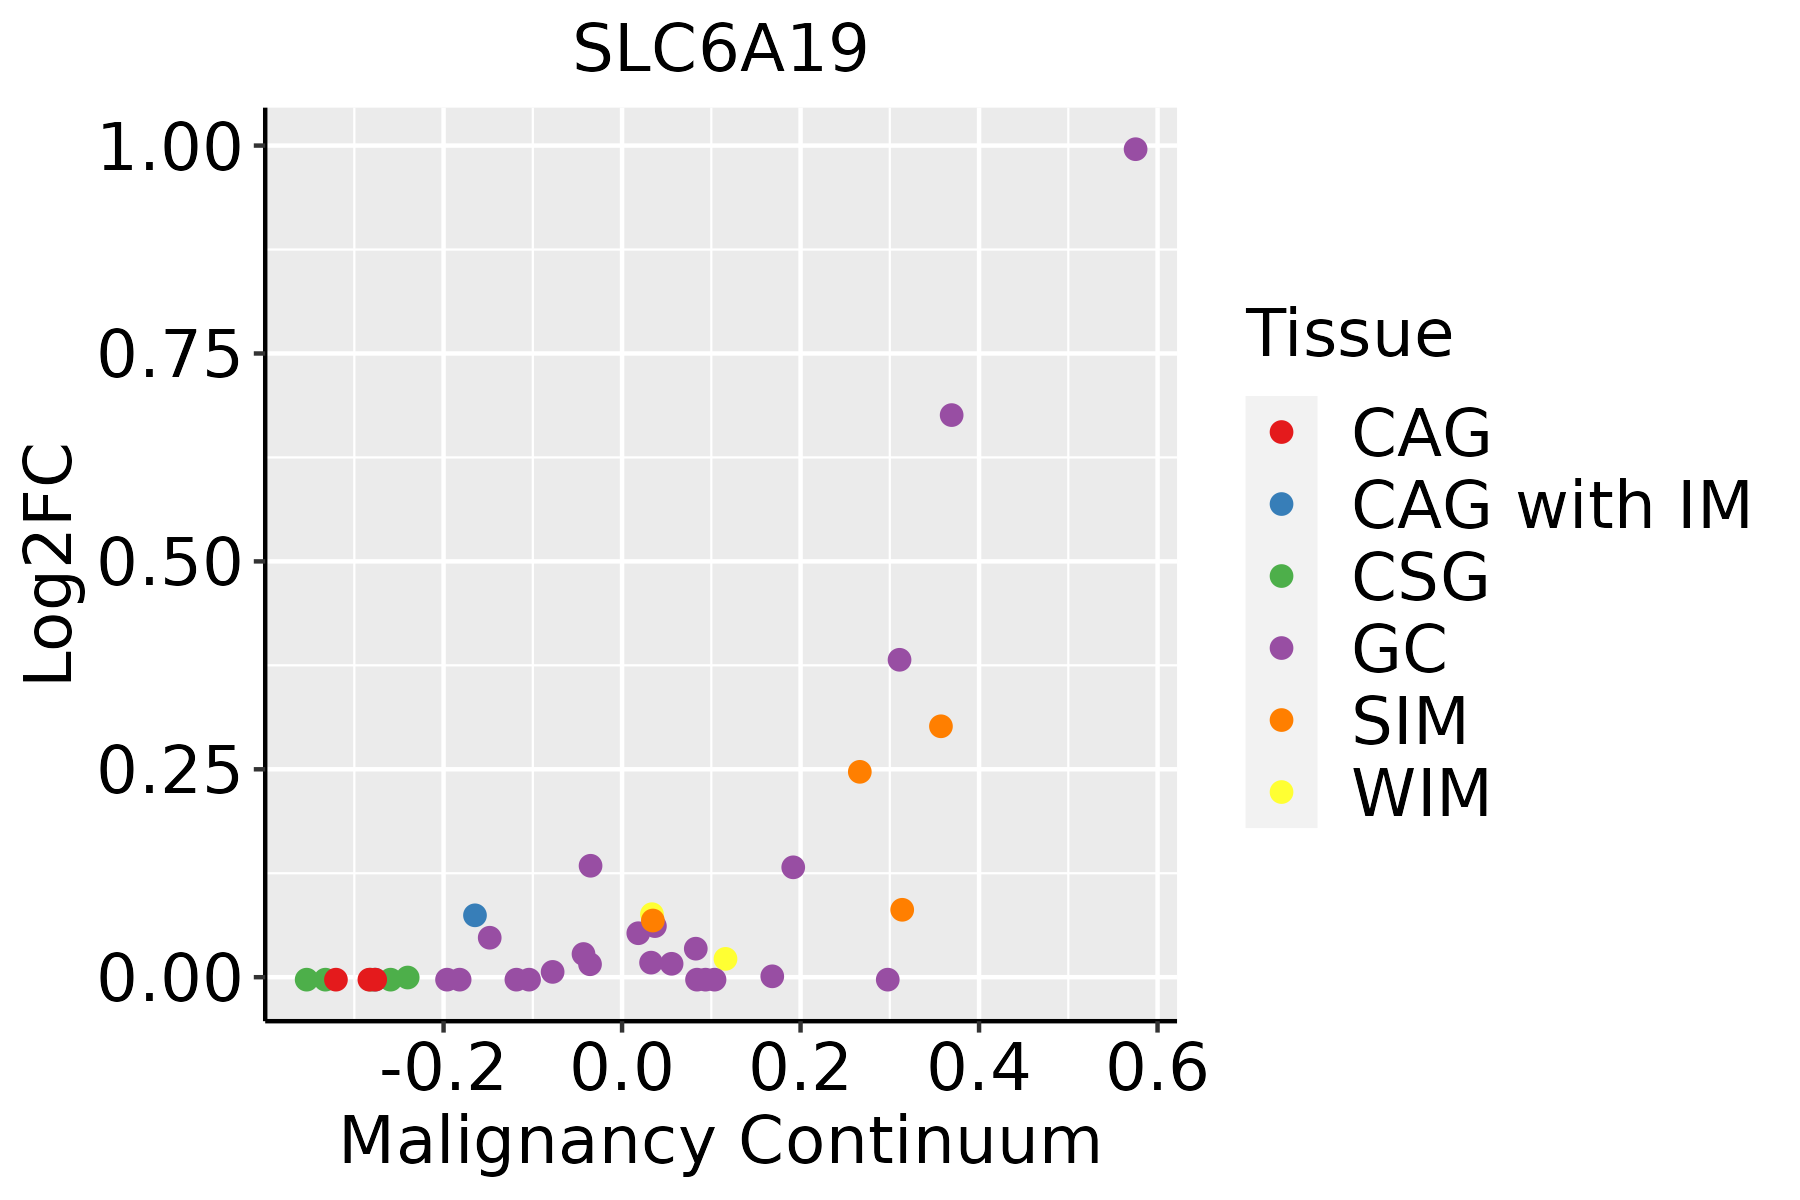 | CAG: Chronic atrophic gastritis |
| CAG with IM: Chronic atrophic gastritis with intestinal metaplasia | ||
| CSG: Chronic superficial gastritis | ||
| GC: Gastric cancer | ||
| SIM: Severe intestinal metaplasia | ||
| WIM: Wild intestinal metaplasia |
| ∗log2FC in expression of this searched gene in stem-like cells from each diseased tissue sample relative to stem-like cells in normal samples in each tissue plotted against the malignancy continuum. Samples are colored based on if they are from different disease stage. |
Top |
Malignant transformation related pathway analysis |
| Find out the enriched GO biological processes and KEGG pathways involved in transition from healthy to precancer to cancer |
| Tissue | Disease Stage | Enriched GO biological Processes |
| Colorectum | AD |  |
| Colorectum | SER |  |
| Colorectum | MSS |  |
| Colorectum | MSI-H |  |
| Colorectum | FAP |  |
| ∗Top 15 enriched GO BP terms are showed in the bar plot of each disease state in each tissue. Each row represents a significant GO biological process which is colored according to the -log10(p.adjust). |
| Page: 1 2 3 4 5 6 7 8 9 |
| GO ID | Tissue | Disease Stage | Description | Gene Ratio | Bg Ratio | pvalue | p.adjust | Count |
| GO:00316676 | Stomach | GC | response to nutrient levels | 56/1159 | 474/18723 | 2.47e-06 | 1.06e-04 | 56 |
| GO:0007584 | Stomach | GC | response to nutrient | 20/1159 | 174/18723 | 5.58e-03 | 4.33e-02 | 20 |
| GO:00316675 | Stomach | SIM | response to nutrient levels | 40/708 | 474/18723 | 1.97e-06 | 1.02e-04 | 40 |
| GO:00075843 | Stomach | SIM | response to nutrient | 15/708 | 174/18723 | 2.56e-03 | 2.54e-02 | 15 |
| Page: 1 |
| Pathway ID | Tissue | Disease Stage | Description | Gene Ratio | Bg Ratio | pvalue | p.adjust | qvalue | Count |
| hsa04978 | Stomach | GC | Mineral absorption | 15/708 | 60/8465 | 8.88e-05 | 9.80e-04 | 6.90e-04 | 15 |
| hsa049781 | Stomach | GC | Mineral absorption | 15/708 | 60/8465 | 8.88e-05 | 9.80e-04 | 6.90e-04 | 15 |
| hsa049788 | Stomach | SIM | Mineral absorption | 11/465 | 60/8465 | 3.61e-04 | 3.41e-03 | 2.74e-03 | 11 |
| hsa049789 | Stomach | SIM | Mineral absorption | 11/465 | 60/8465 | 3.61e-04 | 3.41e-03 | 2.74e-03 | 11 |
| Page: 1 |
Top |
Cell-cell communication analysis |
| Identification of potential cell-cell interactions between two cell types and their ligand-receptor pairs for different disease states |
| Ligand | Receptor | LRpair | Pathway | Tissue | Disease Stage |
| Page: 1 |
Top |
Single-cell gene regulatory network inference analysis |
| Find out the significant the regulons (TFs) and the target genes of each regulon across cell types for different disease states |
| TF | Cell Type | Tissue | Disease Stage | Target Gene | RSS | Regulon Activity |
| ∗The dot plots of a searched regulon are shown for all cell subpopulations in each disease state of each tissue based on the regulon specific score inferred using pySCENIC and by calculating the average expression. |
| Page: 1 |
Top |
Somatic mutation of malignant transformation related genes |
| Annotation of somatic variants for genes involved in malignant transformation |
| Hugo Symbol | Variant Class | Variant Classification | dbSNP RS | HGVSc | HGVSp | HGVSp Short | SWISSPROT | BIOTYPE | SIFT | PolyPhen | Tumor Sample Barcode | Tissue | Histology | Sex | Age | Stage | Therapy Types | Drugs | Outcome |
| SLC6A19 | SNV | Missense_Mutation | novel | c.1820N>A | p.Arg607Lys | p.R607K | Q695T7 | protein_coding | tolerated(0.35) | benign(0.006) | TCGA-A8-A06Z-01 | Breast | breast invasive carcinoma | Female | >=65 | I/II | Unknown | Unknown | SD |
| SLC6A19 | SNV | Missense_Mutation | c.470N>G | p.Glu157Gly | p.E157G | Q695T7 | protein_coding | tolerated(0.38) | benign(0.005) | TCGA-E2-A1LH-01 | Breast | breast invasive carcinoma | Female | <65 | I/II | Chemotherapy | adriamycin | SD | |
| SLC6A19 | deletion | Frame_Shift_Del | novel | c.1795delN | p.Gly599AlafsTer22 | p.G599Afs*22 | Q695T7 | protein_coding | TCGA-EW-A2FV-01 | Breast | breast invasive carcinoma | Female | <65 | III/IV | Chemotherapy | docetaxel | SD | ||
| SLC6A19 | SNV | Missense_Mutation | novel | c.289C>T | p.Arg97Trp | p.R97W | Q695T7 | protein_coding | deleterious(0) | probably_damaging(0.998) | TCGA-2W-A8YY-01 | Cervix | cervical & endocervical cancer | Female | <65 | I/II | Chemotherapy | cisplatin | CR |
| SLC6A19 | SNV | Missense_Mutation | rs377603594 | c.610G>A | p.Ala204Thr | p.A204T | Q695T7 | protein_coding | deleterious(0.02) | benign(0.192) | TCGA-2W-A8YY-01 | Cervix | cervical & endocervical cancer | Female | <65 | I/II | Chemotherapy | cisplatin | CR |
| SLC6A19 | SNV | Missense_Mutation | rs201050149 | c.739G>A | p.Ala247Thr | p.A247T | Q695T7 | protein_coding | deleterious(0) | possibly_damaging(0.871) | TCGA-2W-A8YY-01 | Cervix | cervical & endocervical cancer | Female | <65 | I/II | Chemotherapy | cisplatin | CR |
| SLC6A19 | SNV | Missense_Mutation | rs142164435 | c.982C>T | p.Arg328Cys | p.R328C | Q695T7 | protein_coding | deleterious(0) | benign(0.329) | TCGA-2W-A8YY-01 | Cervix | cervical & endocervical cancer | Female | <65 | I/II | Chemotherapy | cisplatin | CR |
| SLC6A19 | SNV | Missense_Mutation | rs146143094 | c.1177G>A | p.Val393Met | p.V393M | Q695T7 | protein_coding | deleterious(0) | benign(0.223) | TCGA-2W-A8YY-01 | Cervix | cervical & endocervical cancer | Female | <65 | I/II | Chemotherapy | cisplatin | CR |
| SLC6A19 | SNV | Missense_Mutation | c.927N>G | p.Ile309Met | p.I309M | Q695T7 | protein_coding | deleterious(0) | probably_damaging(0.936) | TCGA-C5-A1BM-01 | Cervix | cervical & endocervical cancer | Female | >=65 | I/II | Unknown | Unknown | SD | |
| SLC6A19 | SNV | Missense_Mutation | novel | c.289N>T | p.Arg97Trp | p.R97W | Q695T7 | protein_coding | deleterious(0) | probably_damaging(0.998) | TCGA-VS-A94W-01 | Cervix | cervical & endocervical cancer | Female | <65 | I/II | Chemotherapy | cisplatin | CR |
| Page: 1 2 3 4 5 6 7 8 9 |
Top |
Related drugs of malignant transformation related genes |
| Identification of chemicals and drugs interact with genes involved in malignant transfromation |
| (DGIdb 4.0) |
| Entrez ID | Symbol | Category | Interaction Types | Drug Claim Name | Drug Name | PMIDs |
| 340024 | SLC6A19 | DRUGGABLE GENOME, TRANSPORTER | inhibitor | 223365936 | BENZATROPINE | |
| 340024 | SLC6A19 | DRUGGABLE GENOME, TRANSPORTER | inhibitor | 381744938 | CINROMIDE |
| Page: 1 |

Copyright 2023-Present -The University of Texas Health Science Center at Houston |