
|
|||||
|
 | |
| |
| |
| |
| |
| |
|
Gene: SLC6A15 |
Gene summary for SLC6A15 |
| Gene information | Species | Human | Gene symbol | SLC6A15 | Gene ID | 55117 |
| Gene name | solute carrier family 6 member 15 | |
| Gene Alias | NTT73 | |
| Cytomap | 12q21.31 | |
| Gene Type | protein-coding | GO ID | GO:0003333 | UniProtAcc | Q8IXG2 |
Top |
Malignant transformation analysis |
| Identification of the aberrant gene expression in precancerous and cancerous lesions by comparing the gene expression of stem-like cells in diseased tissues with normal stem cells |
| Entrez ID | Symbol | Replicates | Species | Organ | Tissue | Adj P-value | Log2FC | Malignancy |
| 55117 | SLC6A15 | P2T-E | Human | Esophagus | ESCC | 1.33e-21 | 4.51e-01 | 0.1177 |
| 55117 | SLC6A15 | P5T-E | Human | Esophagus | ESCC | 2.86e-05 | 3.19e-02 | 0.1327 |
| 55117 | SLC6A15 | P10T-E | Human | Esophagus | ESCC | 1.75e-04 | 4.77e-02 | 0.116 |
| 55117 | SLC6A15 | P12T-E | Human | Esophagus | ESCC | 5.12e-04 | 1.99e-02 | 0.1122 |
| 55117 | SLC6A15 | P16T-E | Human | Esophagus | ESCC | 3.26e-54 | 9.89e-01 | 0.1153 |
| 55117 | SLC6A15 | P20T-E | Human | Esophagus | ESCC | 5.28e-10 | 7.63e-02 | 0.1124 |
| 55117 | SLC6A15 | P26T-E | Human | Esophagus | ESCC | 4.58e-12 | 2.37e-01 | 0.1276 |
| 55117 | SLC6A15 | P27T-E | Human | Esophagus | ESCC | 2.34e-02 | 3.94e-02 | 0.1055 |
| 55117 | SLC6A15 | P32T-E | Human | Esophagus | ESCC | 3.81e-12 | 2.40e-01 | 0.1666 |
| 55117 | SLC6A15 | P37T-E | Human | Esophagus | ESCC | 1.37e-10 | 3.02e-01 | 0.1371 |
| 55117 | SLC6A15 | P54T-E | Human | Esophagus | ESCC | 1.94e-13 | 2.93e-01 | 0.0975 |
| 55117 | SLC6A15 | P56T-E | Human | Esophagus | ESCC | 4.74e-06 | 8.16e-01 | 0.1613 |
| 55117 | SLC6A15 | P62T-E | Human | Esophagus | ESCC | 2.99e-03 | 1.49e-01 | 0.1302 |
| 55117 | SLC6A15 | P65T-E | Human | Esophagus | ESCC | 4.47e-03 | -3.21e-02 | 0.0978 |
| 55117 | SLC6A15 | P74T-E | Human | Esophagus | ESCC | 1.10e-03 | 1.18e-01 | 0.1479 |
| 55117 | SLC6A15 | P76T-E | Human | Esophagus | ESCC | 2.59e-03 | 1.21e-01 | 0.1207 |
| 55117 | SLC6A15 | P83T-E | Human | Esophagus | ESCC | 1.03e-09 | 3.57e-01 | 0.1738 |
| 55117 | SLC6A15 | P89T-E | Human | Esophagus | ESCC | 2.69e-06 | 8.37e-01 | 0.1752 |
| 55117 | SLC6A15 | P91T-E | Human | Esophagus | ESCC | 1.72e-05 | 9.24e-01 | 0.1828 |
| 55117 | SLC6A15 | P107T-E | Human | Esophagus | ESCC | 1.38e-19 | 4.92e-01 | 0.171 |
| Page: 1 2 |
| Tissue | Expression Dynamics | Abbreviation |
| Esophagus | 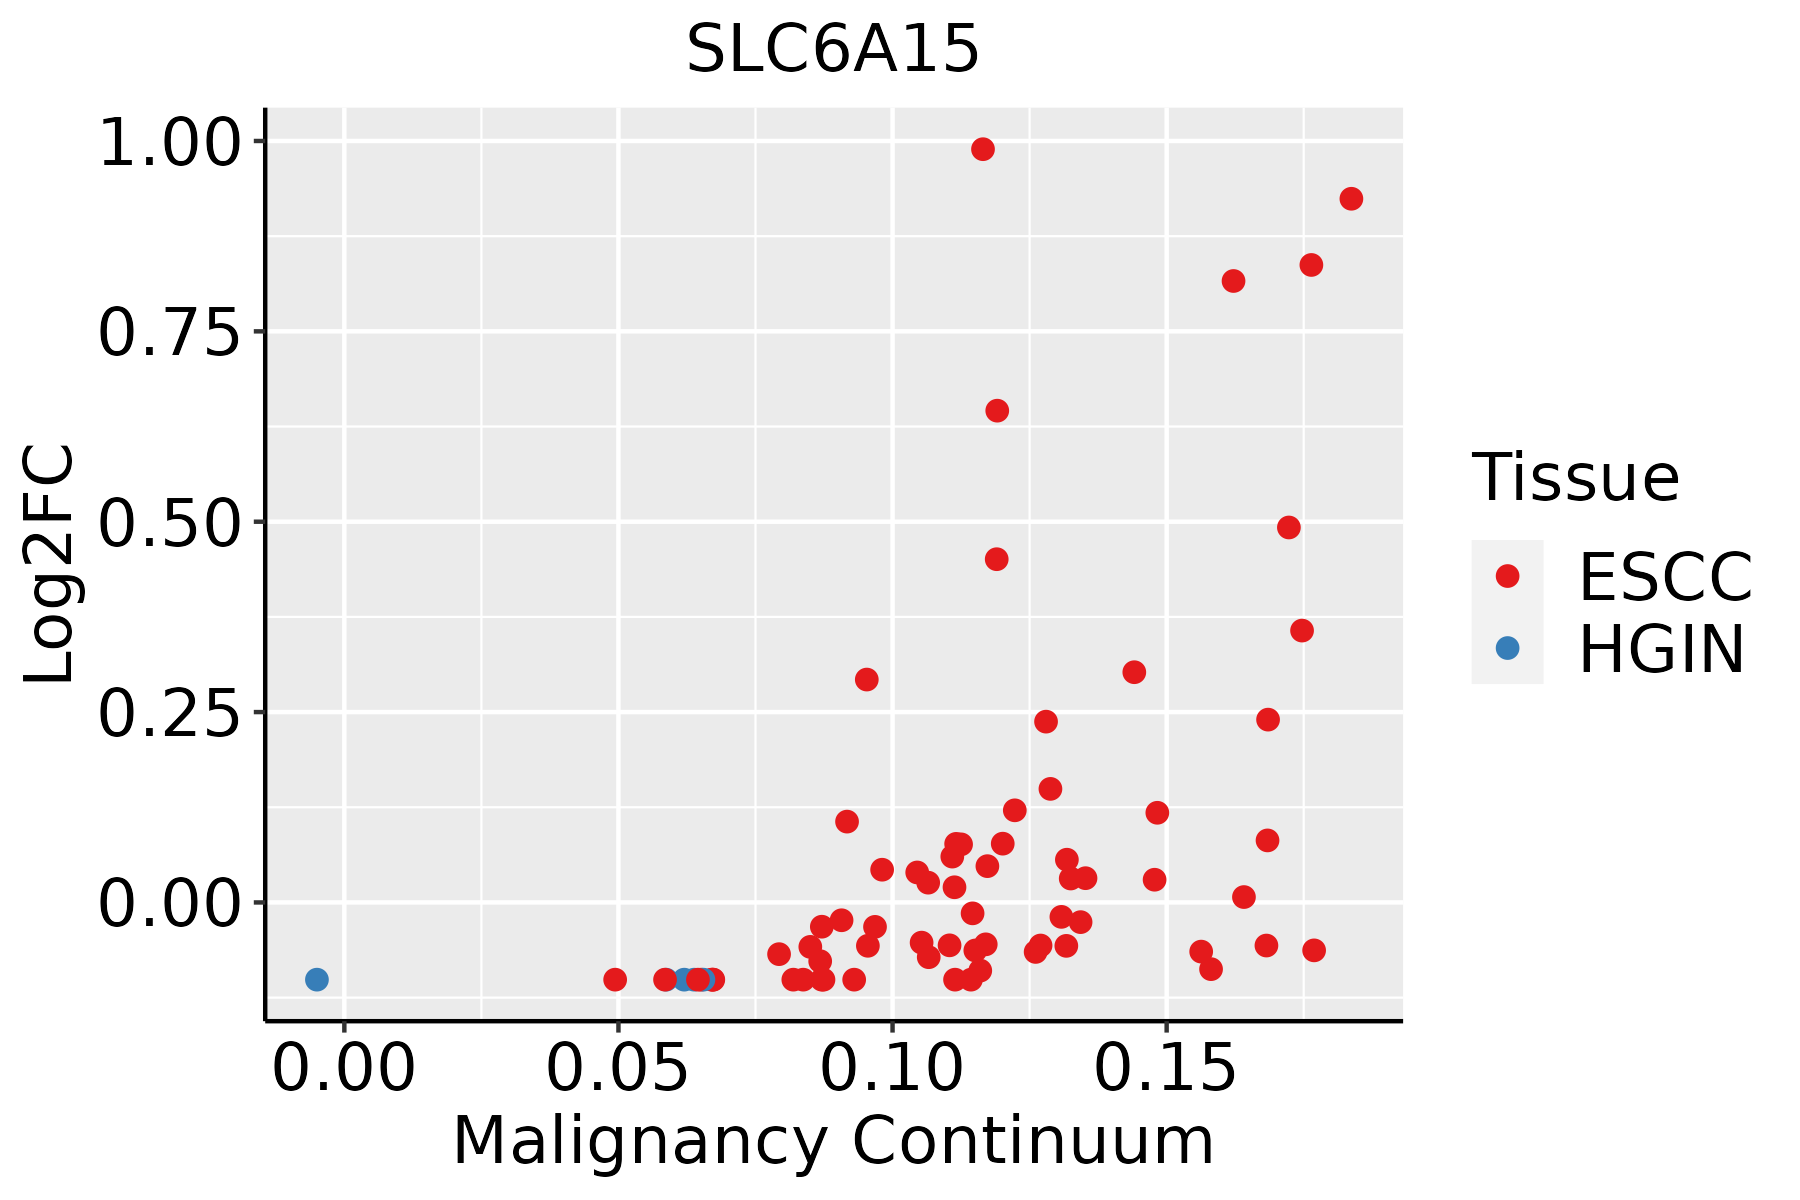 | ESCC: Esophageal squamous cell carcinoma |
| HGIN: High-grade intraepithelial neoplasias | ||
| LGIN: Low-grade intraepithelial neoplasias | ||
| Oral Cavity | 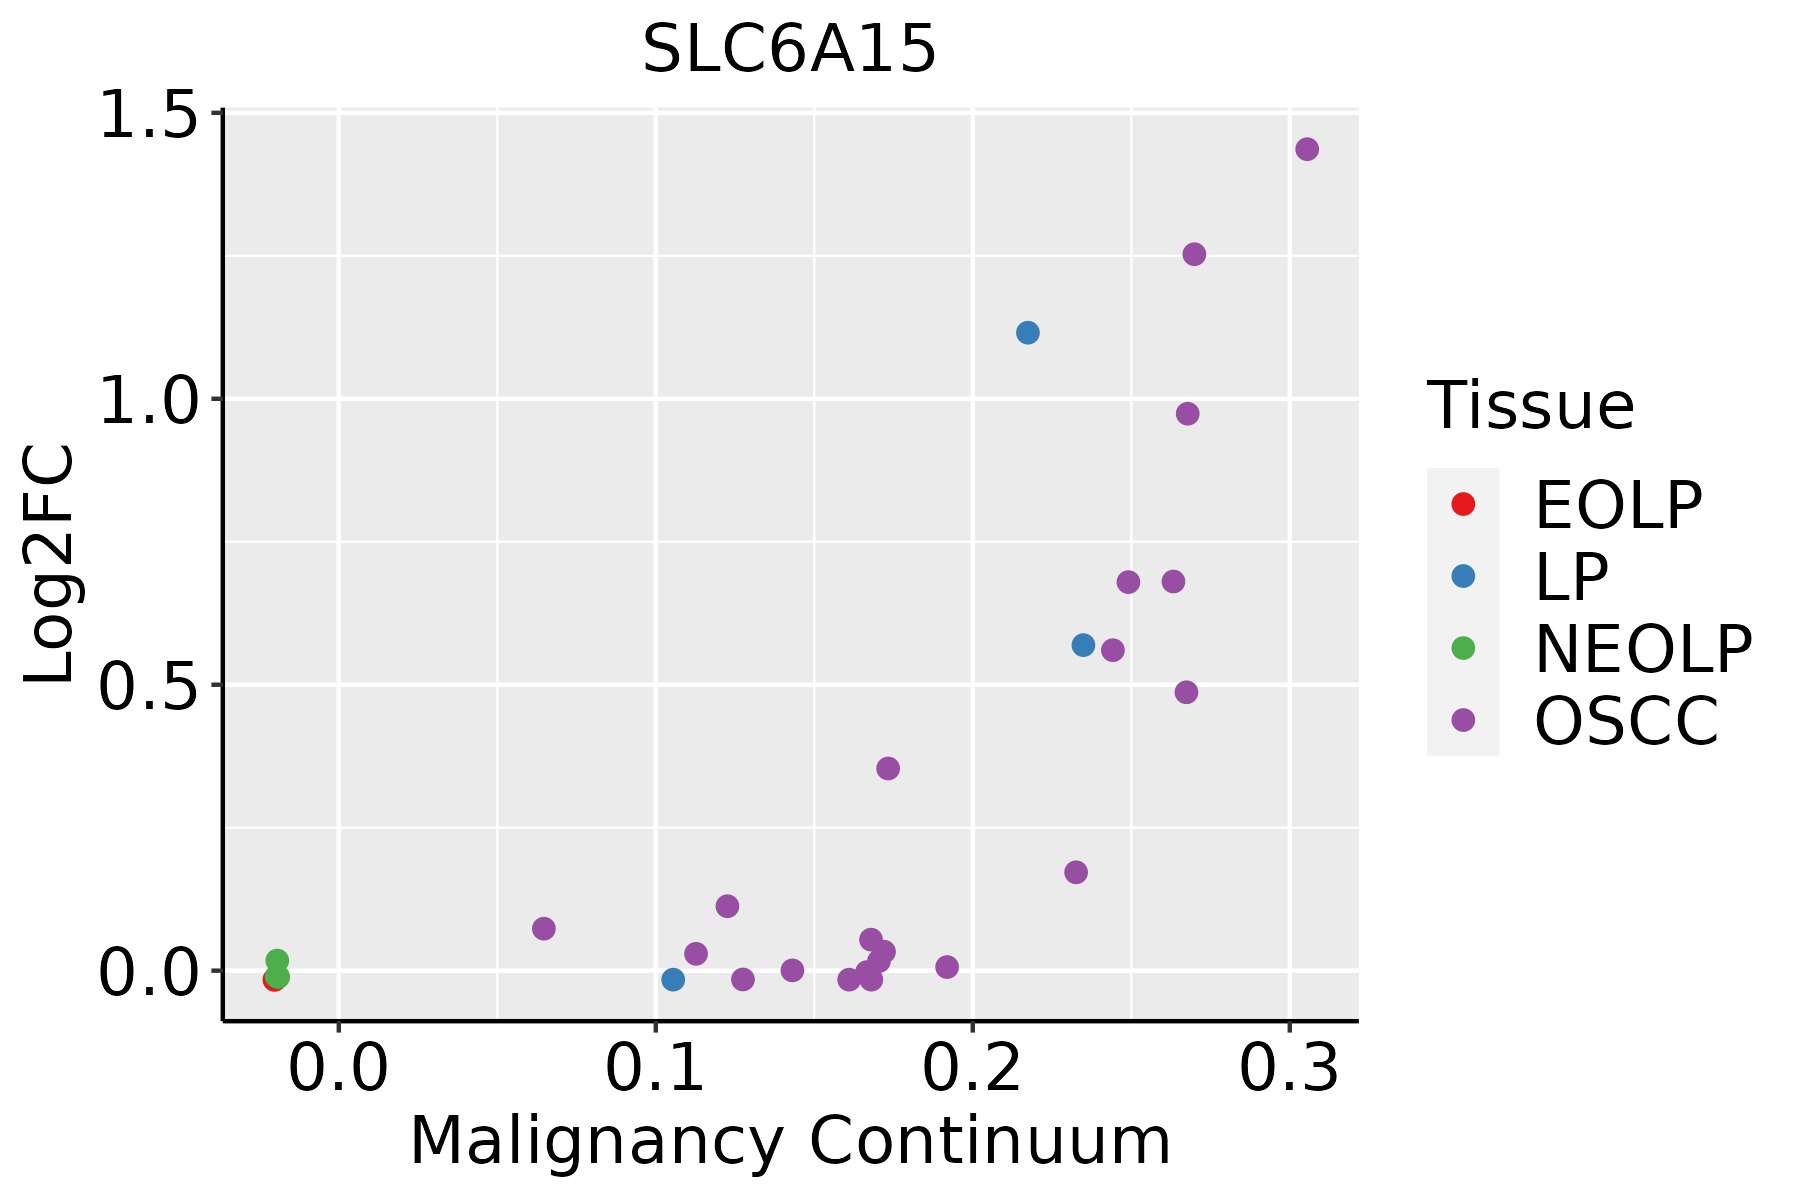 | EOLP: Erosive Oral lichen planus |
| LP: leukoplakia | ||
| NEOLP: Non-erosive oral lichen planus | ||
| OSCC: Oral squamous cell carcinoma |
| ∗log2FC in expression of this searched gene in stem-like cells from each diseased tissue sample relative to stem-like cells in normal samples in each tissue plotted against the malignancy continuum. Samples are colored based on if they are from different disease stage. |
Top |
Malignant transformation related pathway analysis |
| Find out the enriched GO biological processes and KEGG pathways involved in transition from healthy to precancer to cancer |
| Tissue | Disease Stage | Enriched GO biological Processes |
| Colorectum | AD |  |
| Colorectum | SER |  |
| Colorectum | MSS |  |
| Colorectum | MSI-H |  |
| Colorectum | FAP |  |
| ∗Top 15 enriched GO BP terms are showed in the bar plot of each disease state in each tissue. Each row represents a significant GO biological process which is colored according to the -log10(p.adjust). |
| Page: 1 2 3 4 5 6 7 8 9 |
| GO ID | Tissue | Disease Stage | Description | Gene Ratio | Bg Ratio | pvalue | p.adjust | Count |
| Page: 1 |
| Pathway ID | Tissue | Disease Stage | Description | Gene Ratio | Bg Ratio | pvalue | p.adjust | qvalue | Count |
| Page: 1 |
Top |
Cell-cell communication analysis |
| Identification of potential cell-cell interactions between two cell types and their ligand-receptor pairs for different disease states |
| Ligand | Receptor | LRpair | Pathway | Tissue | Disease Stage |
| Page: 1 |
Top |
Single-cell gene regulatory network inference analysis |
| Find out the significant the regulons (TFs) and the target genes of each regulon across cell types for different disease states |
| TF | Cell Type | Tissue | Disease Stage | Target Gene | RSS | Regulon Activity |
| ∗The dot plots of a searched regulon are shown for all cell subpopulations in each disease state of each tissue based on the regulon specific score inferred using pySCENIC and by calculating the average expression. |
| Page: 1 |
Top |
Somatic mutation of malignant transformation related genes |
| Annotation of somatic variants for genes involved in malignant transformation |
| Hugo Symbol | Variant Class | Variant Classification | dbSNP RS | HGVSc | HGVSp | HGVSp Short | SWISSPROT | BIOTYPE | SIFT | PolyPhen | Tumor Sample Barcode | Tissue | Histology | Sex | Age | Stage | Therapy Types | Drugs | Outcome |
| SLC6A15 | SNV | Missense_Mutation | novel | c.352G>C | p.Glu118Gln | p.E118Q | Q9H2J7 | protein_coding | deleterious(0) | probably_damaging(0.999) | TCGA-A2-A0CL-01 | Breast | breast invasive carcinoma | Female | <65 | III/IV | Chemotherapy | cytoxan | SD |
| SLC6A15 | SNV | Missense_Mutation | novel | c.592N>A | p.Glu198Lys | p.E198K | Q9H2J7 | protein_coding | tolerated(0.33) | benign(0.426) | TCGA-AC-A5XS-01 | Breast | breast invasive carcinoma | Female | >=65 | I/II | Hormone Therapy | femara | SD |
| SLC6A15 | SNV | Missense_Mutation | c.197G>A | p.Ser66Asn | p.S66N | Q9H2J7 | protein_coding | tolerated(0.39) | benign(0.024) | TCGA-AN-A0AK-01 | Breast | breast invasive carcinoma | Female | >=65 | I/II | Unknown | Unknown | SD | |
| SLC6A15 | SNV | Missense_Mutation | c.847N>T | p.Arg283Cys | p.R283C | Q9H2J7 | protein_coding | tolerated(0.05) | possibly_damaging(0.67) | TCGA-C8-A27A-01 | Breast | breast invasive carcinoma | Female | <65 | I/II | Chemotherapy | 5-fluorouracil | CR | |
| SLC6A15 | SNV | Missense_Mutation | c.1417G>A | p.Gly473Ser | p.G473S | Q9H2J7 | protein_coding | tolerated(0.47) | benign(0.124) | TCGA-GM-A2DH-01 | Breast | breast invasive carcinoma | Female | <65 | I/II | Chemotherapy | taxol | CR | |
| SLC6A15 | SNV | Missense_Mutation | novel | c.1961N>T | p.Ser654Phe | p.S654F | Q9H2J7 | protein_coding | deleterious(0) | possibly_damaging(0.724) | TCGA-2W-A8YY-01 | Cervix | cervical & endocervical cancer | Female | <65 | I/II | Chemotherapy | cisplatin | CR |
| SLC6A15 | SNV | Missense_Mutation | novel | c.1318N>A | p.Gly440Ser | p.G440S | Q9H2J7 | protein_coding | deleterious(0.02) | probably_damaging(0.999) | TCGA-2W-A8YY-01 | Cervix | cervical & endocervical cancer | Female | <65 | I/II | Chemotherapy | cisplatin | CR |
| SLC6A15 | SNV | Missense_Mutation | novel | c.1010N>C | p.Val337Ala | p.V337A | Q9H2J7 | protein_coding | deleterious(0) | probably_damaging(0.983) | TCGA-2W-A8YY-01 | Cervix | cervical & endocervical cancer | Female | <65 | I/II | Chemotherapy | cisplatin | CR |
| SLC6A15 | SNV | Missense_Mutation | novel | c.44A>G | p.Asp15Gly | p.D15G | Q9H2J7 | protein_coding | deleterious(0.05) | benign(0.014) | TCGA-VS-A94Z-01 | Cervix | cervical & endocervical cancer | Female | <65 | I/II | Chemotherapy | cisplatin | CR |
| SLC6A15 | SNV | Missense_Mutation | novel | c.1024T>G | p.Phe342Val | p.F342V | Q9H2J7 | protein_coding | tolerated(0.06) | probably_damaging(1) | TCGA-A6-3809-01 | Colorectum | colon adenocarcinoma | Female | >=65 | I/II | Unknown | Unknown | SD |
| Page: 1 2 3 4 5 6 7 8 9 10 11 12 13 14 15 |
Top |
Related drugs of malignant transformation related genes |
| Identification of chemicals and drugs interact with genes involved in malignant transfromation |
| (DGIdb 4.0) |
| Entrez ID | Symbol | Category | Interaction Types | Drug Claim Name | Drug Name | PMIDs |
| 55117 | SLC6A15 | DRUGGABLE GENOME, TRANSPORTER | inhibitor | 178103791 | LORATADINE | |
| 55117 | SLC6A15 | DRUGGABLE GENOME, TRANSPORTER | LORATADINE | LORATADINE | 25318072 |
| Page: 1 |

Copyright 2023-Present -The University of Texas Health Science Center at Houston |