
|
|||||
|
 | |
| |
| |
| |
| |
| |
|
Gene: SLC6A1 |
Gene summary for SLC6A1 |
| Gene information | Species | Human | Gene symbol | SLC6A1 | Gene ID | 6529 |
| Gene name | solute carrier family 6 member 1 | |
| Gene Alias | GABATHG | |
| Cytomap | 3p25.3 | |
| Gene Type | protein-coding | GO ID | GO:0001504 | UniProtAcc | A0A024R2G0 |
Top |
Malignant transformation analysis |
| Identification of the aberrant gene expression in precancerous and cancerous lesions by comparing the gene expression of stem-like cells in diseased tissues with normal stem cells |
| Entrez ID | Symbol | Replicates | Species | Organ | Tissue | Adj P-value | Log2FC | Malignancy |
| 6529 | SLC6A1 | NAFLD1 | Human | Liver | NAFLD | 3.06e-09 | 8.25e-01 | -0.04 |
| 6529 | SLC6A1 | S41 | Human | Liver | Cirrhotic | 1.52e-02 | 4.48e-01 | -0.0343 |
| 6529 | SLC6A1 | S43 | Human | Liver | Cirrhotic | 2.14e-02 | -1.16e-02 | -0.0187 |
| 6529 | SLC6A1 | HCC1_Meng | Human | Liver | HCC | 5.00e-03 | -1.10e-01 | 0.0246 |
| 6529 | SLC6A1 | HCC2_Meng | Human | Liver | HCC | 4.78e-05 | -1.14e-01 | 0.0107 |
| 6529 | SLC6A1 | HCC1 | Human | Liver | HCC | 8.64e-04 | 1.17e+00 | 0.5336 |
| 6529 | SLC6A1 | HCC2 | Human | Liver | HCC | 6.83e-23 | 2.82e+00 | 0.5341 |
| Page: 1 |
| Tissue | Expression Dynamics | Abbreviation |
| Liver | 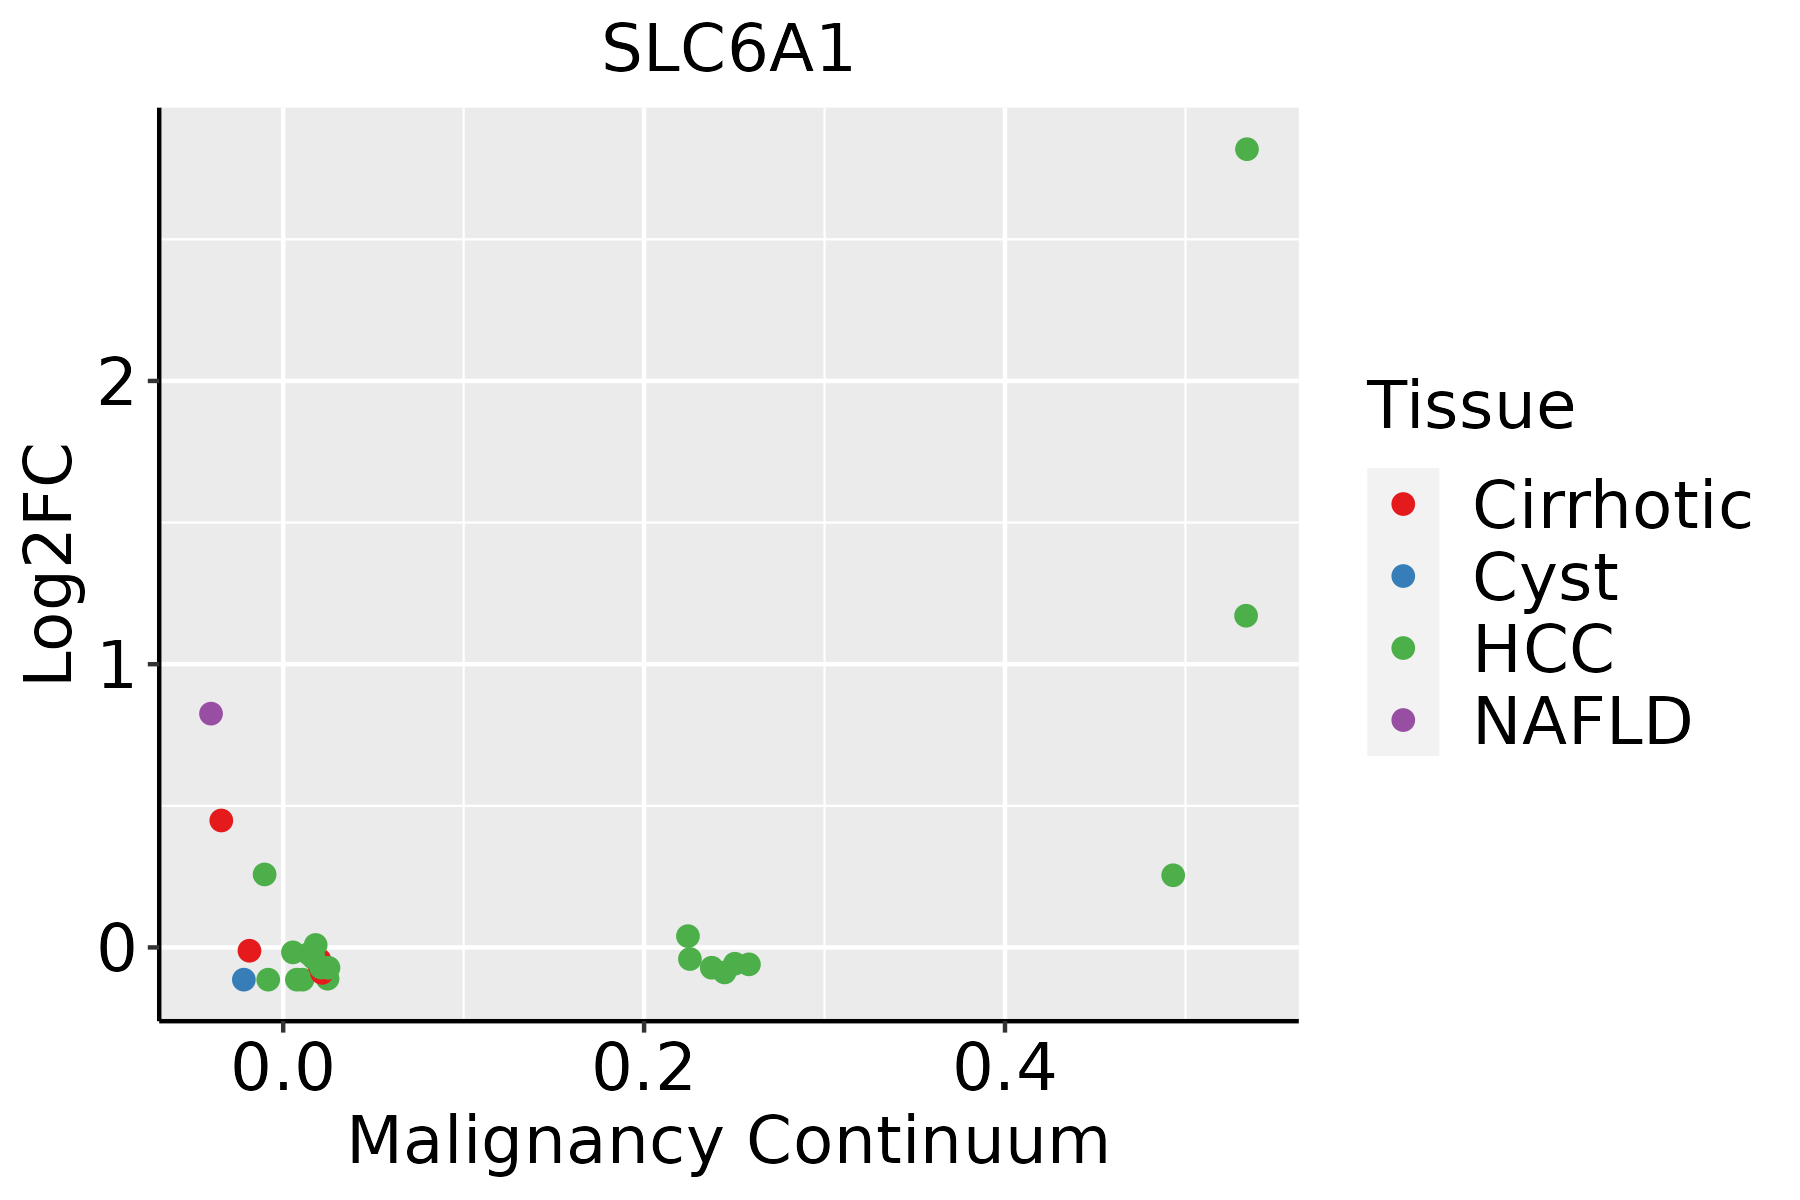 | HCC: Hepatocellular carcinoma |
| NAFLD: Non-alcoholic fatty liver disease |
| ∗log2FC in expression of this searched gene in stem-like cells from each diseased tissue sample relative to stem-like cells in normal samples in each tissue plotted against the malignancy continuum. Samples are colored based on if they are from different disease stage. |
Top |
Malignant transformation related pathway analysis |
| Find out the enriched GO biological processes and KEGG pathways involved in transition from healthy to precancer to cancer |
| Tissue | Disease Stage | Enriched GO biological Processes |
| Colorectum | AD |  |
| Colorectum | SER |  |
| Colorectum | MSS |  |
| Colorectum | MSI-H |  |
| Colorectum | FAP |  |
| ∗Top 15 enriched GO BP terms are showed in the bar plot of each disease state in each tissue. Each row represents a significant GO biological process which is colored according to the -log10(p.adjust). |
| Page: 1 2 3 4 5 6 7 8 9 |
| GO ID | Tissue | Disease Stage | Description | Gene Ratio | Bg Ratio | pvalue | p.adjust | Count |
| GO:000941020 | Esophagus | ESCC | response to xenobiotic stimulus | 253/8552 | 462/18723 | 4.55e-05 | 3.58e-04 | 253 |
| GO:000963620 | Esophagus | ESCC | response to toxic substance | 150/8552 | 262/18723 | 1.00e-04 | 7.12e-04 | 150 |
| GO:00094107 | Liver | NAFLD | response to xenobiotic stimulus | 88/1882 | 462/18723 | 2.53e-09 | 4.11e-07 | 88 |
| GO:00100387 | Liver | NAFLD | response to metal ion | 62/1882 | 373/18723 | 5.05e-05 | 1.19e-03 | 62 |
| GO:00097437 | Liver | NAFLD | response to carbohydrate | 45/1882 | 253/18723 | 1.07e-04 | 2.11e-03 | 45 |
| GO:00030182 | Liver | NAFLD | vascular process in circulatory system | 46/1882 | 263/18723 | 1.36e-04 | 2.58e-03 | 46 |
| GO:00140747 | Liver | NAFLD | response to purine-containing compound | 29/1882 | 148/18723 | 3.34e-04 | 5.13e-03 | 29 |
| GO:0042220 | Liver | NAFLD | response to cocaine | 13/1882 | 55/18723 | 2.64e-03 | 2.42e-02 | 13 |
| GO:00096367 | Liver | NAFLD | response to toxic substance | 41/1882 | 262/18723 | 2.83e-03 | 2.57e-02 | 41 |
| GO:00323553 | Liver | NAFLD | response to estradiol | 25/1882 | 141/18723 | 3.51e-03 | 3.01e-02 | 25 |
| GO:00515923 | Liver | NAFLD | response to calcium ion | 26/1882 | 149/18723 | 3.69e-03 | 3.15e-02 | 26 |
| GO:01501043 | Liver | NAFLD | transport across blood-brain barrier | 17/1882 | 87/18723 | 5.46e-03 | 4.20e-02 | 17 |
| GO:00102322 | Liver | NAFLD | vascular transport | 17/1882 | 88/18723 | 6.15e-03 | 4.61e-02 | 17 |
| GO:001003812 | Liver | Cirrhotic | response to metal ion | 150/4634 | 373/18723 | 2.27e-11 | 1.37e-09 | 150 |
| GO:000963612 | Liver | Cirrhotic | response to toxic substance | 104/4634 | 262/18723 | 5.63e-08 | 1.74e-06 | 104 |
| GO:000974312 | Liver | Cirrhotic | response to carbohydrate | 101/4634 | 253/18723 | 6.24e-08 | 1.92e-06 | 101 |
| GO:005159211 | Liver | Cirrhotic | response to calcium ion | 61/4634 | 149/18723 | 9.47e-06 | 1.38e-04 | 61 |
| GO:0010288 | Liver | Cirrhotic | response to lead ion | 14/4634 | 24/18723 | 4.64e-04 | 3.75e-03 | 14 |
| GO:00323551 | Liver | Cirrhotic | response to estradiol | 51/4634 | 141/18723 | 1.60e-03 | 1.04e-02 | 51 |
| GO:001407411 | Liver | Cirrhotic | response to purine-containing compound | 53/4634 | 148/18723 | 1.70e-03 | 1.08e-02 | 53 |
| Page: 1 2 |
| Pathway ID | Tissue | Disease Stage | Description | Gene Ratio | Bg Ratio | pvalue | p.adjust | qvalue | Count |
| Page: 1 |
Top |
Cell-cell communication analysis |
| Identification of potential cell-cell interactions between two cell types and their ligand-receptor pairs for different disease states |
| Ligand | Receptor | LRpair | Pathway | Tissue | Disease Stage |
| Page: 1 |
Top |
Single-cell gene regulatory network inference analysis |
| Find out the significant the regulons (TFs) and the target genes of each regulon across cell types for different disease states |
| TF | Cell Type | Tissue | Disease Stage | Target Gene | RSS | Regulon Activity |
| ∗The dot plots of a searched regulon are shown for all cell subpopulations in each disease state of each tissue based on the regulon specific score inferred using pySCENIC and by calculating the average expression. |
| Page: 1 |
Top |
Somatic mutation of malignant transformation related genes |
| Annotation of somatic variants for genes involved in malignant transformation |
| Hugo Symbol | Variant Class | Variant Classification | dbSNP RS | HGVSc | HGVSp | HGVSp Short | SWISSPROT | BIOTYPE | SIFT | PolyPhen | Tumor Sample Barcode | Tissue | Histology | Sex | Age | Stage | Therapy Types | Drugs | Outcome |
| SLC6A1 | SNV | Missense_Mutation | c.571N>C | p.Glu191Gln | p.E191Q | P30531 | protein_coding | deleterious(0.02) | possibly_damaging(0.876) | TCGA-IR-A3LH-01 | Cervix | cervical & endocervical cancer | Female | <65 | I/II | Chemotherapy | cisplatin | CR | |
| SLC6A1 | SNV | Missense_Mutation | c.98A>C | p.Lys33Thr | p.K33T | P30531 | protein_coding | tolerated(0.44) | benign(0.001) | TCGA-A6-6653-01 | Colorectum | colon adenocarcinoma | Male | >=65 | I/II | Unknown | Unknown | SD | |
| SLC6A1 | SNV | Missense_Mutation | c.199G>A | p.Val67Ile | p.V67I | P30531 | protein_coding | tolerated(0.05) | probably_damaging(0.998) | TCGA-AA-3496-01 | Colorectum | colon adenocarcinoma | Female | >=65 | I/II | Unknown | Unknown | SD | |
| SLC6A1 | SNV | Missense_Mutation | c.1040N>G | p.His347Arg | p.H347R | P30531 | protein_coding | tolerated(0.09) | benign(0.289) | TCGA-AA-3710-01 | Colorectum | colon adenocarcinoma | Female | >=65 | I/II | Unknown | Unknown | SD | |
| SLC6A1 | SNV | Missense_Mutation | c.1657N>A | p.Ala553Thr | p.A553T | P30531 | protein_coding | tolerated(0.1) | benign(0.122) | TCGA-AA-3715-01 | Colorectum | colon adenocarcinoma | Male | >=65 | I/II | Unknown | Unknown | PD | |
| SLC6A1 | SNV | Missense_Mutation | rs1139554 | c.1672N>G | p.Thr558Ala | p.T558A | P30531 | protein_coding | tolerated(0.59) | benign(0.159) | TCGA-AA-3947-01 | Colorectum | colon adenocarcinoma | Female | <65 | I/II | Unknown | Unknown | SD |
| SLC6A1 | SNV | Missense_Mutation | novel | c.1536N>A | p.Phe512Leu | p.F512L | P30531 | protein_coding | tolerated(0.08) | possibly_damaging(0.876) | TCGA-AA-3984-01 | Colorectum | colon adenocarcinoma | Female | <65 | I/II | Unknown | Unknown | SD |
| SLC6A1 | SNV | Missense_Mutation | c.1061N>A | p.Ala354Asp | p.A354D | P30531 | protein_coding | tolerated(0.12) | benign(0.16) | TCGA-AD-5900-01 | Colorectum | colon adenocarcinoma | Male | >=65 | I/II | Unknown | Unknown | SD | |
| SLC6A1 | SNV | Missense_Mutation | c.1652N>G | p.Tyr551Cys | p.Y551C | P30531 | protein_coding | deleterious(0.05) | probably_damaging(0.989) | TCGA-AZ-4315-01 | Colorectum | colon adenocarcinoma | Male | <65 | I/II | Unknown | Unknown | SD | |
| SLC6A1 | SNV | Missense_Mutation | c.278N>T | p.Ala93Val | p.A93V | P30531 | protein_coding | deleterious(0.03) | probably_damaging(0.959) | TCGA-CK-6746-01 | Colorectum | colon adenocarcinoma | Female | >=65 | I/II | Unknown | Unknown | SD |
| Page: 1 2 3 4 5 6 7 8 |
Top |
Related drugs of malignant transformation related genes |
| Identification of chemicals and drugs interact with genes involved in malignant transfromation |
| (DGIdb 4.0) |
| Entrez ID | Symbol | Category | Interaction Types | Drug Claim Name | Drug Name | PMIDs |
| 6529 | SLC6A1 | TRANSPORTER, DRUGGABLE GENOME, EXTERNAL SIDE OF PLASMA MEMBRANE, CELL SURFACE | inhibitor | CHEMBL1695 | TIAGABINE HYDROCHLORIDE | |
| 6529 | SLC6A1 | TRANSPORTER, DRUGGABLE GENOME, EXTERNAL SIDE OF PLASMA MEMBRANE, CELL SURFACE | COCAINE | COCAINE | ||
| 6529 | SLC6A1 | TRANSPORTER, DRUGGABLE GENOME, EXTERNAL SIDE OF PLASMA MEMBRANE, CELL SURFACE | TIAGABINE | TIAGABINE | ||
| 6529 | SLC6A1 | TRANSPORTER, DRUGGABLE GENOME, EXTERNAL SIDE OF PLASMA MEMBRANE, CELL SURFACE | inhibitor | 178103126 | ||
| 6529 | SLC6A1 | TRANSPORTER, DRUGGABLE GENOME, EXTERNAL SIDE OF PLASMA MEMBRANE, CELL SURFACE | inhibitor | 178101332 | CHEMBL77287 | |
| 6529 | SLC6A1 | TRANSPORTER, DRUGGABLE GENOME, EXTERNAL SIDE OF PLASMA MEMBRANE, CELL SURFACE | inhibitor | 178101520 | TIAGABINE | |
| 6529 | SLC6A1 | TRANSPORTER, DRUGGABLE GENOME, EXTERNAL SIDE OF PLASMA MEMBRANE, CELL SURFACE | inhibitor | 178101304 | ||
| 6529 | SLC6A1 | TRANSPORTER, DRUGGABLE GENOME, EXTERNAL SIDE OF PLASMA MEMBRANE, CELL SURFACE | Metadoxine | |||
| 6529 | SLC6A1 | TRANSPORTER, DRUGGABLE GENOME, EXTERNAL SIDE OF PLASMA MEMBRANE, CELL SURFACE | inhibitor | 178103127 | ||
| 6529 | SLC6A1 | TRANSPORTER, DRUGGABLE GENOME, EXTERNAL SIDE OF PLASMA MEMBRANE, CELL SURFACE | inhibitor | 178101399 |
| Page: 1 2 |

Copyright 2023-Present -The University of Texas Health Science Center at Houston |