
|
|||||
|
 | |
| |
| |
| |
| |
| |
|
Gene: SLC5A6 |
Gene summary for SLC5A6 |
| Gene information | Species | Human | Gene symbol | SLC5A6 | Gene ID | 8884 |
| Gene name | solute carrier family 5 member 6 | |
| Gene Alias | NERIB | |
| Cytomap | 2p23.3 | |
| Gene Type | protein-coding | GO ID | GO:0003008 | UniProtAcc | Q9HD19 |
Top |
Malignant transformation analysis |
| Identification of the aberrant gene expression in precancerous and cancerous lesions by comparing the gene expression of stem-like cells in diseased tissues with normal stem cells |
| Entrez ID | Symbol | Replicates | Species | Organ | Tissue | Adj P-value | Log2FC | Malignancy |
| 8884 | SLC5A6 | HTA11_866_3004761011 | Human | Colorectum | AD | 1.12e-06 | 2.61e-01 | 0.096 |
| 8884 | SLC5A6 | HTA11_7696_3000711011 | Human | Colorectum | AD | 4.49e-05 | 1.79e-01 | 0.0674 |
| 8884 | SLC5A6 | HTA11_6818_2000001021 | Human | Colorectum | AD | 2.34e-05 | 2.17e-01 | 0.0588 |
| 8884 | SLC5A6 | HTA11_99999965104_69814 | Human | Colorectum | MSS | 6.41e-07 | 4.08e-01 | 0.281 |
| 8884 | SLC5A6 | HTA11_99999971662_82457 | Human | Colorectum | MSS | 3.51e-41 | 9.10e-01 | 0.3859 |
| 8884 | SLC5A6 | HTA11_99999973899_84307 | Human | Colorectum | MSS | 3.35e-08 | 5.69e-01 | 0.2585 |
| 8884 | SLC5A6 | HTA11_99999974143_84620 | Human | Colorectum | MSS | 1.37e-27 | 6.52e-01 | 0.3005 |
| 8884 | SLC5A6 | CRC-3-11773 | Human | Colorectum | CRC | 3.64e-02 | 2.22e-01 | 0.2564 |
| 8884 | SLC5A6 | LZE7T | Human | Esophagus | ESCC | 1.13e-04 | 2.29e-01 | 0.0667 |
| 8884 | SLC5A6 | LZE24T | Human | Esophagus | ESCC | 1.76e-10 | 2.28e-01 | 0.0596 |
| 8884 | SLC5A6 | LZE21T | Human | Esophagus | ESCC | 5.20e-03 | 1.93e-01 | 0.0655 |
| 8884 | SLC5A6 | P2T-E | Human | Esophagus | ESCC | 2.37e-14 | 3.20e-01 | 0.1177 |
| 8884 | SLC5A6 | P4T-E | Human | Esophagus | ESCC | 8.04e-05 | 2.54e-01 | 0.1323 |
| 8884 | SLC5A6 | P5T-E | Human | Esophagus | ESCC | 6.21e-06 | 8.27e-02 | 0.1327 |
| 8884 | SLC5A6 | P8T-E | Human | Esophagus | ESCC | 1.70e-10 | 7.32e-02 | 0.0889 |
| 8884 | SLC5A6 | P9T-E | Human | Esophagus | ESCC | 1.17e-07 | 1.12e-01 | 0.1131 |
| 8884 | SLC5A6 | P10T-E | Human | Esophagus | ESCC | 1.70e-14 | 1.70e-01 | 0.116 |
| 8884 | SLC5A6 | P11T-E | Human | Esophagus | ESCC | 1.62e-04 | 2.98e-01 | 0.1426 |
| 8884 | SLC5A6 | P12T-E | Human | Esophagus | ESCC | 1.34e-11 | 2.92e-01 | 0.1122 |
| 8884 | SLC5A6 | P15T-E | Human | Esophagus | ESCC | 6.61e-13 | 3.29e-01 | 0.1149 |
| Page: 1 2 3 4 |
| Tissue | Expression Dynamics | Abbreviation |
| Colorectum (GSE201348) | 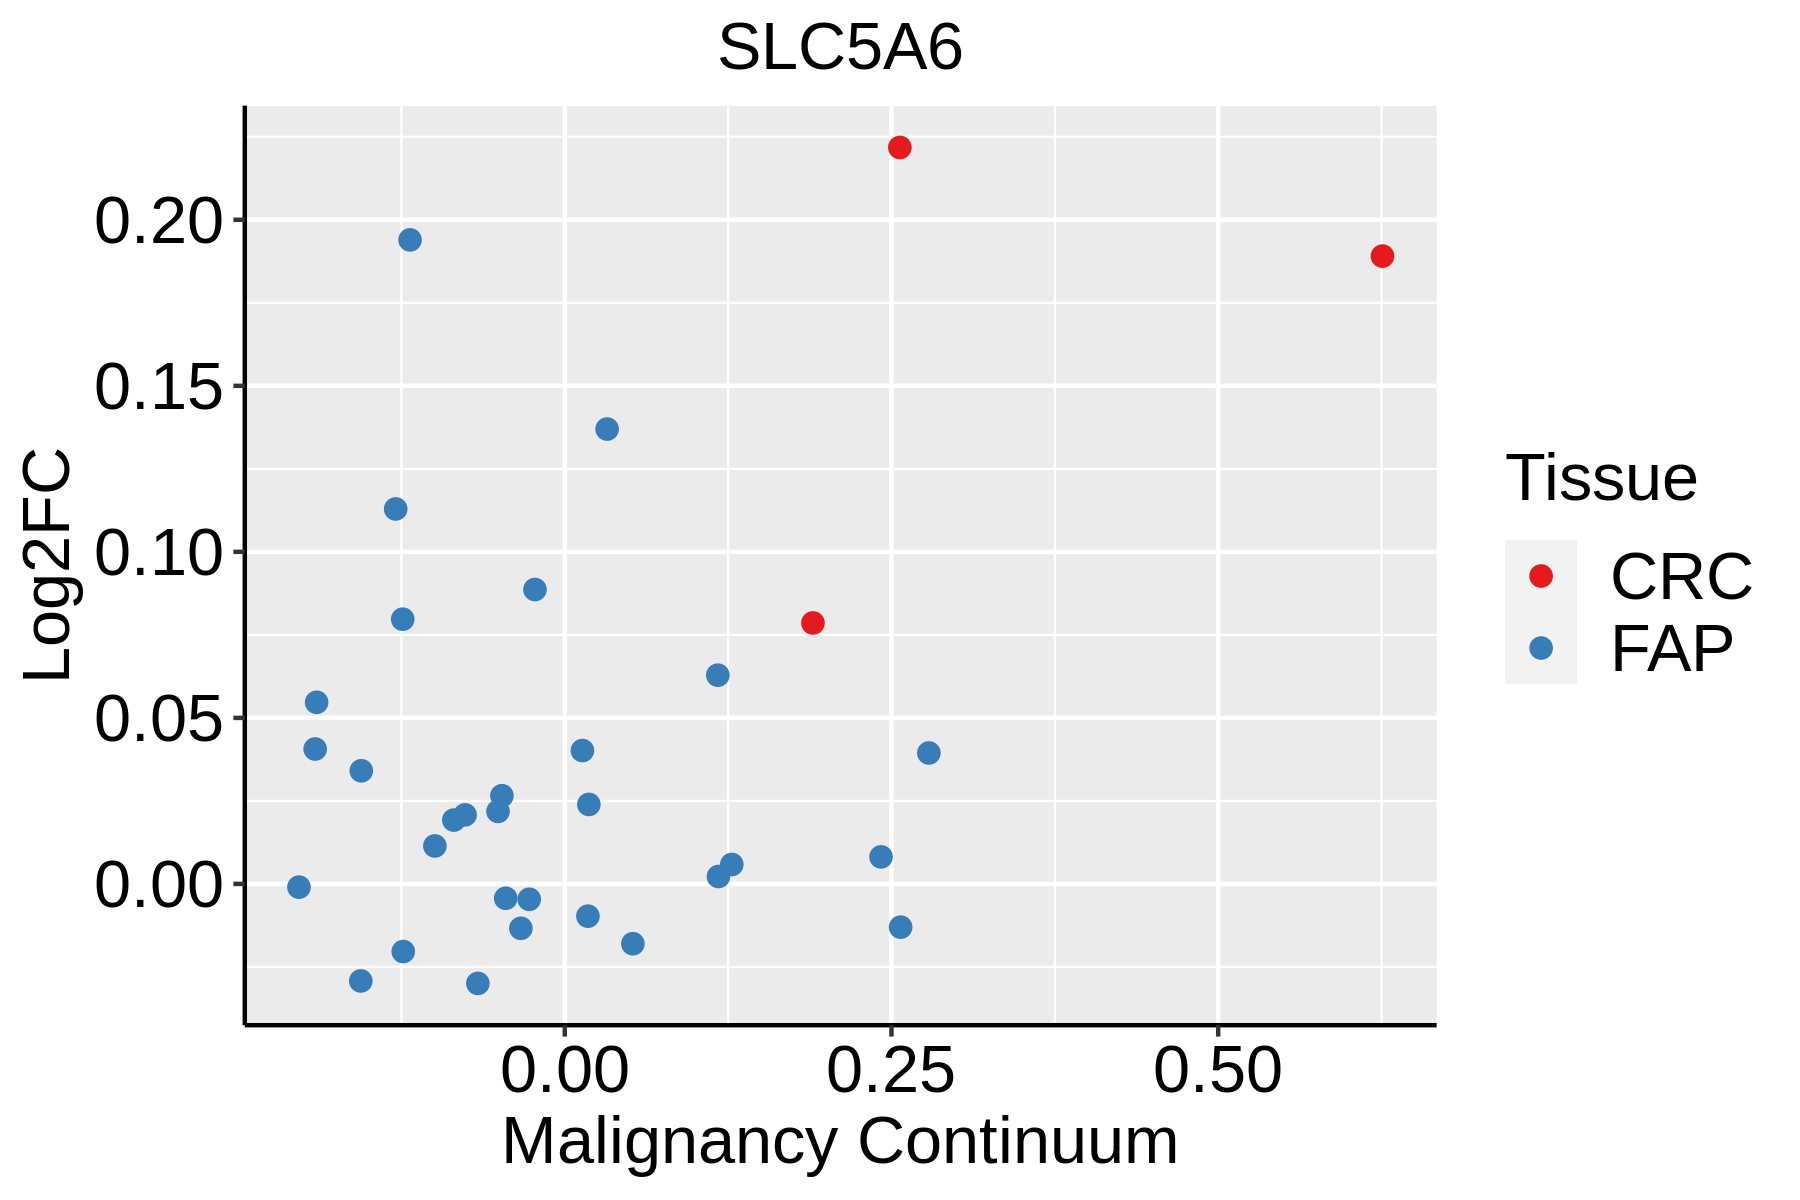 | FAP: Familial adenomatous polyposis |
| CRC: Colorectal cancer | ||
| Colorectum (HTA11) |  | AD: Adenomas |
| SER: Sessile serrated lesions | ||
| MSI-H: Microsatellite-high colorectal cancer | ||
| MSS: Microsatellite stable colorectal cancer | ||
| Esophagus | 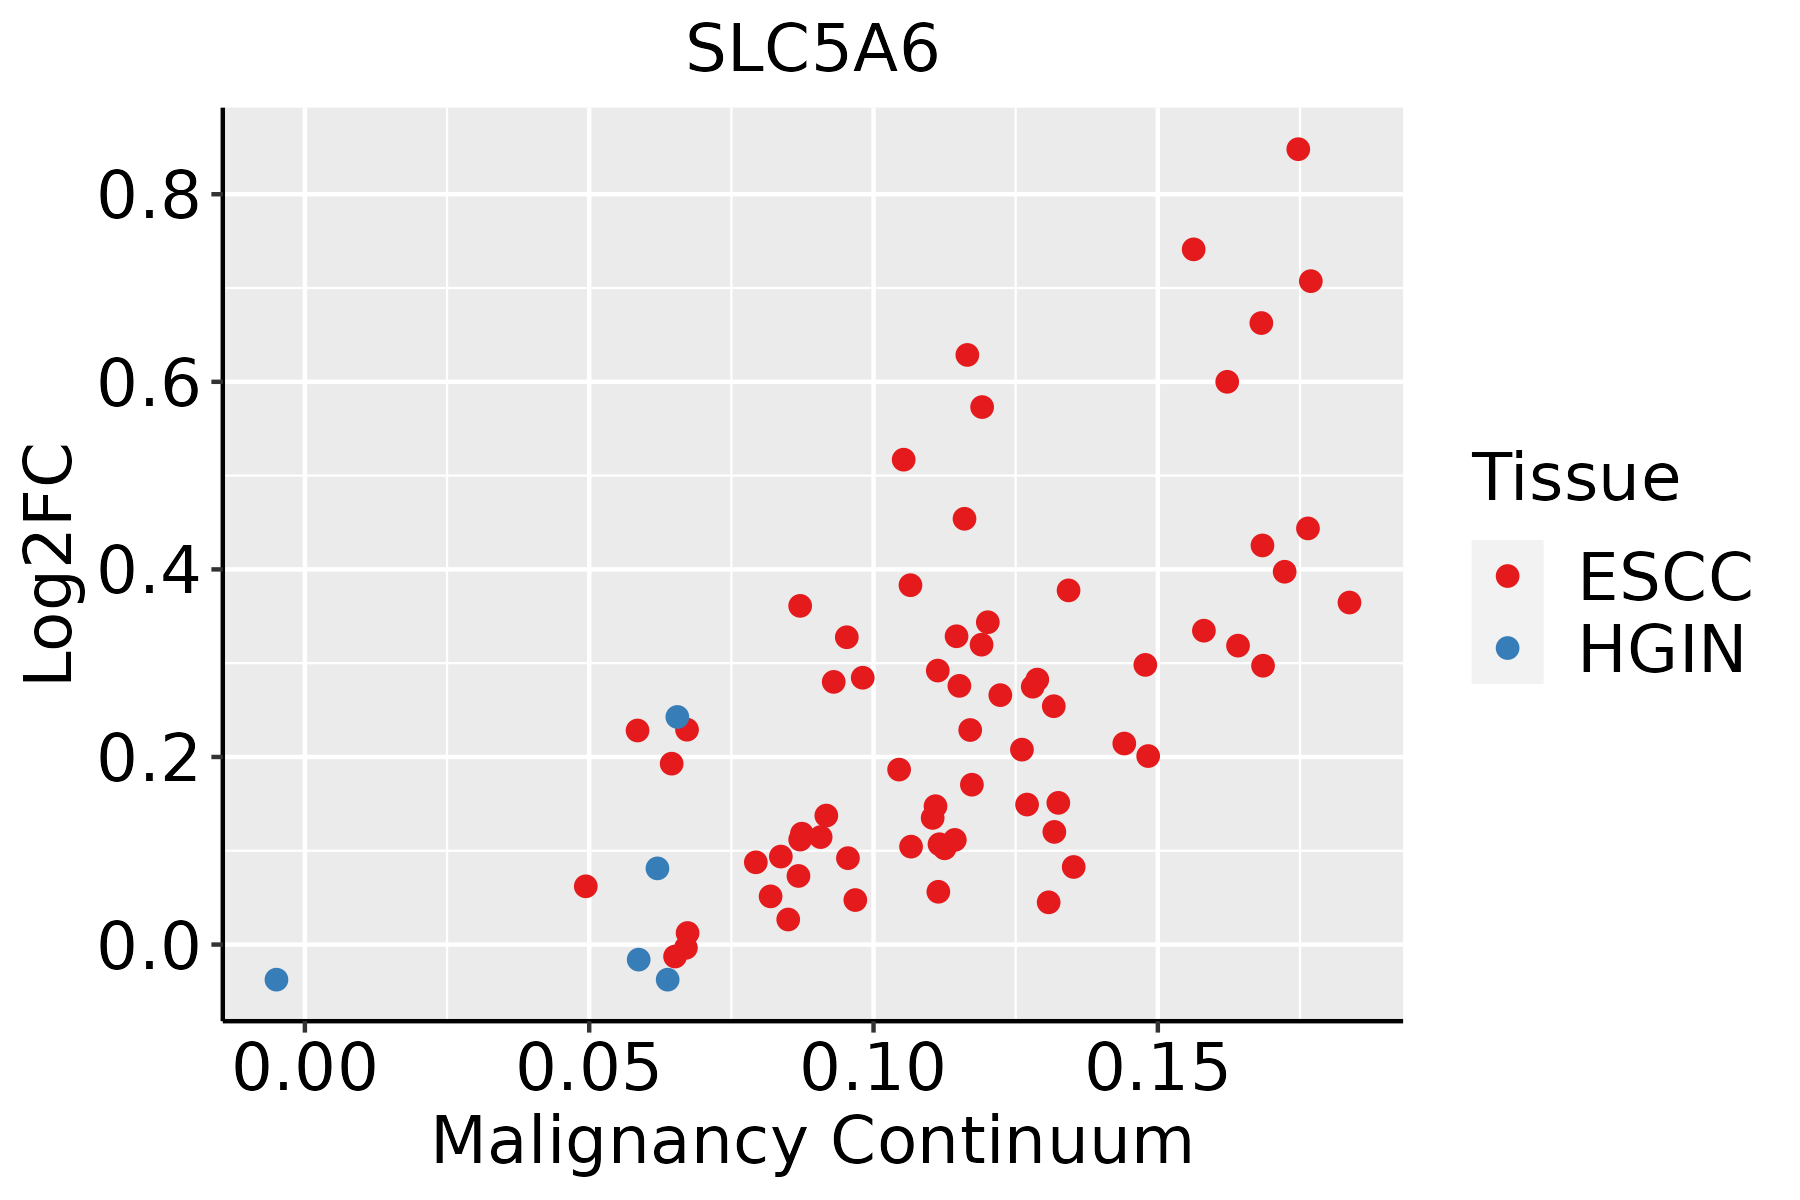 | ESCC: Esophageal squamous cell carcinoma |
| HGIN: High-grade intraepithelial neoplasias | ||
| LGIN: Low-grade intraepithelial neoplasias | ||
| Liver | 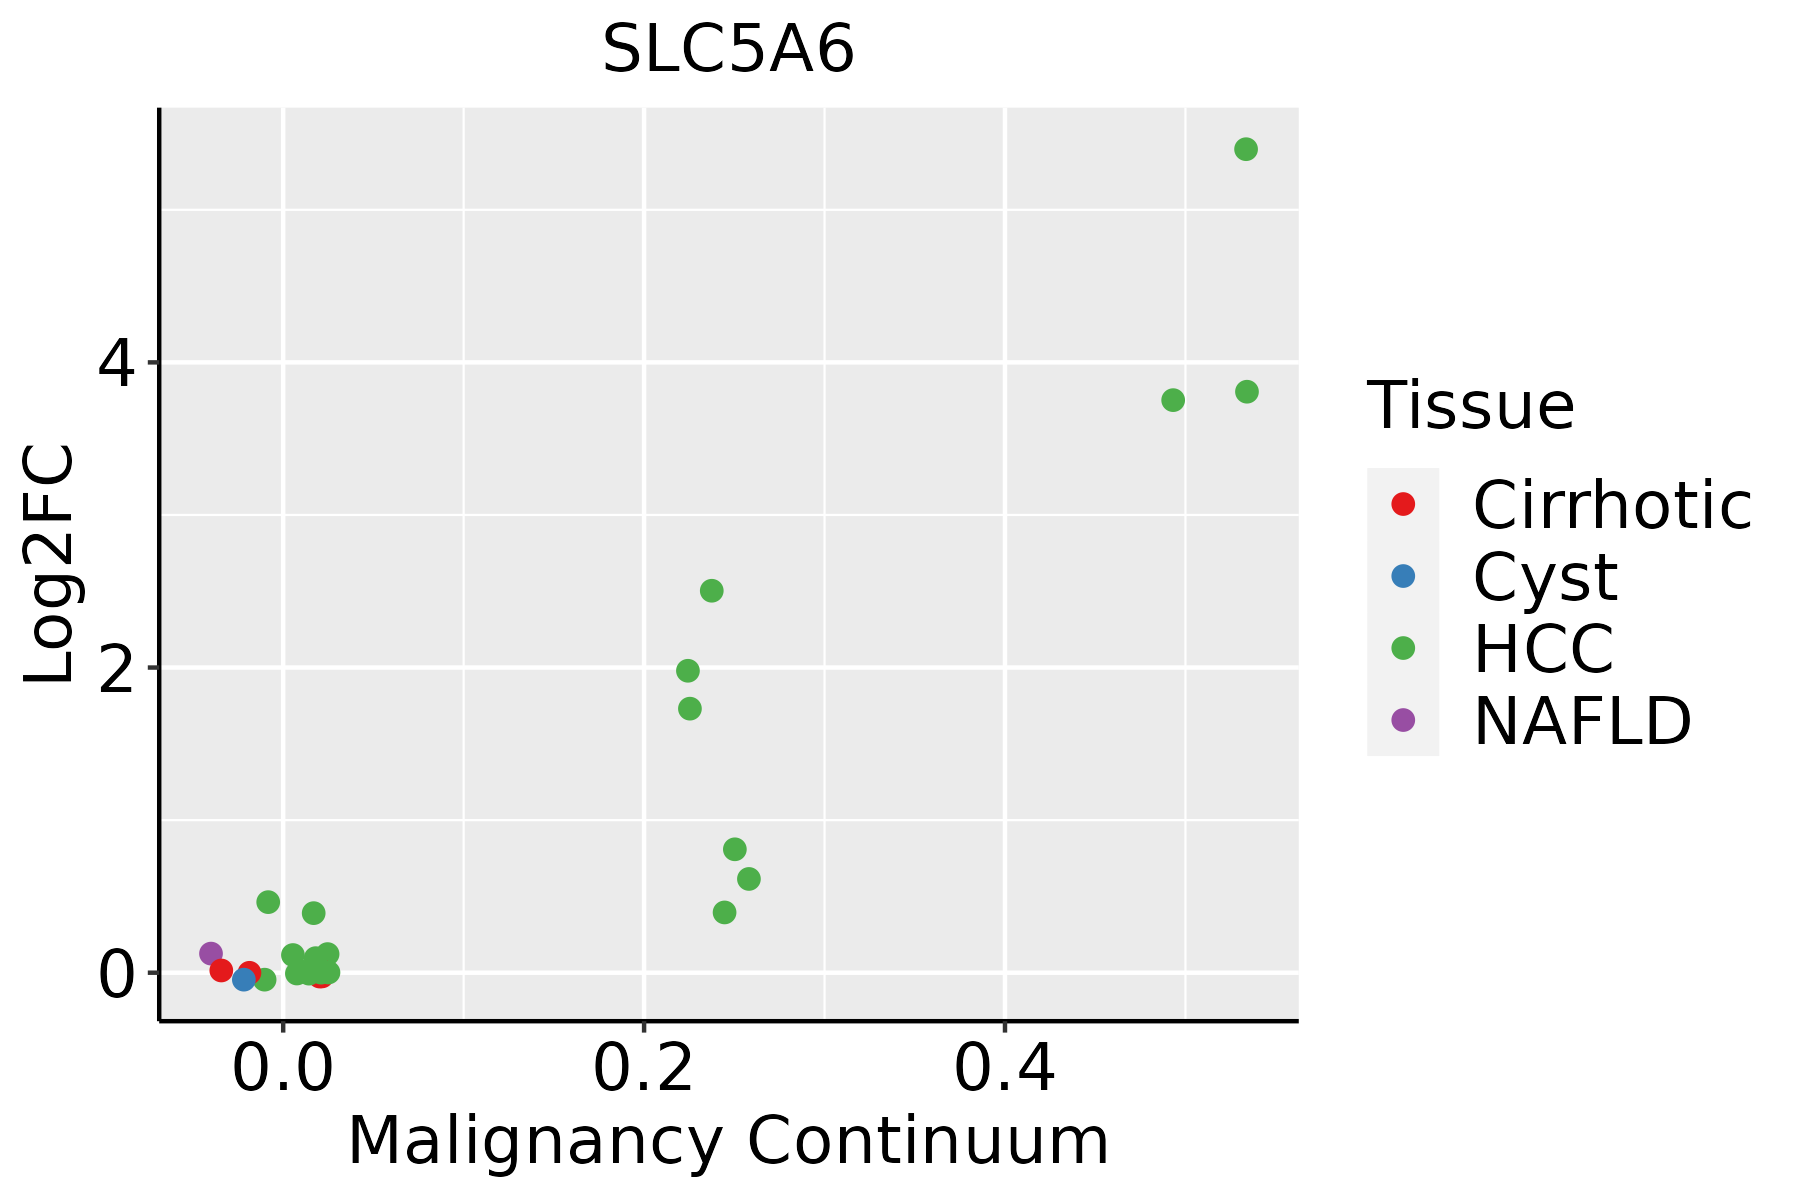 | HCC: Hepatocellular carcinoma |
| NAFLD: Non-alcoholic fatty liver disease | ||
| Oral Cavity |  | EOLP: Erosive Oral lichen planus |
| LP: leukoplakia | ||
| NEOLP: Non-erosive oral lichen planus | ||
| OSCC: Oral squamous cell carcinoma |
| ∗log2FC in expression of this searched gene in stem-like cells from each diseased tissue sample relative to stem-like cells in normal samples in each tissue plotted against the malignancy continuum. Samples are colored based on if they are from different disease stage. |
Top |
Malignant transformation related pathway analysis |
| Find out the enriched GO biological processes and KEGG pathways involved in transition from healthy to precancer to cancer |
| Tissue | Disease Stage | Enriched GO biological Processes |
| Colorectum | AD |  |
| Colorectum | SER |  |
| Colorectum | MSS |  |
| Colorectum | MSI-H |  |
| Colorectum | FAP |  |
| ∗Top 15 enriched GO BP terms are showed in the bar plot of each disease state in each tissue. Each row represents a significant GO biological process which is colored according to the -log10(p.adjust). |
| Page: 1 2 3 4 5 6 7 8 9 |
| GO ID | Tissue | Disease Stage | Description | Gene Ratio | Bg Ratio | pvalue | p.adjust | Count |
| GO:0042886 | Colorectum | AD | amide transport | 83/3918 | 301/18723 | 3.37e-03 | 2.46e-02 | 83 |
| GO:0015698 | Colorectum | AD | inorganic anion transport | 52/3918 | 180/18723 | 6.83e-03 | 4.22e-02 | 52 |
| GO:0150104 | Colorectum | MSS | transport across blood-brain barrier | 28/3467 | 87/18723 | 1.54e-03 | 1.41e-02 | 28 |
| GO:0010232 | Colorectum | MSS | vascular transport | 28/3467 | 88/18723 | 1.87e-03 | 1.64e-02 | 28 |
| GO:00428861 | Colorectum | MSS | amide transport | 76/3467 | 301/18723 | 2.14e-03 | 1.80e-02 | 76 |
| GO:00068141 | Colorectum | CRC | sodium ion transport | 49/2078 | 245/18723 | 3.01e-05 | 7.86e-04 | 49 |
| GO:00030181 | Colorectum | CRC | vascular process in circulatory system | 45/2078 | 263/18723 | 2.10e-03 | 2.08e-02 | 45 |
| GO:01501042 | Colorectum | CRC | transport across blood-brain barrier | 18/2078 | 87/18723 | 6.50e-03 | 4.69e-02 | 18 |
| GO:015010411 | Liver | HCC | transport across blood-brain barrier | 50/7958 | 87/18723 | 3.42e-03 | 1.55e-02 | 50 |
| GO:001023211 | Liver | HCC | vascular transport | 50/7958 | 88/18723 | 4.69e-03 | 2.02e-02 | 50 |
| Page: 1 |
| Pathway ID | Tissue | Disease Stage | Description | Gene Ratio | Bg Ratio | pvalue | p.adjust | qvalue | Count |
| Page: 1 |
Top |
Cell-cell communication analysis |
| Identification of potential cell-cell interactions between two cell types and their ligand-receptor pairs for different disease states |
| Ligand | Receptor | LRpair | Pathway | Tissue | Disease Stage |
| Page: 1 |
Top |
Single-cell gene regulatory network inference analysis |
| Find out the significant the regulons (TFs) and the target genes of each regulon across cell types for different disease states |
| TF | Cell Type | Tissue | Disease Stage | Target Gene | RSS | Regulon Activity |
| ∗The dot plots of a searched regulon are shown for all cell subpopulations in each disease state of each tissue based on the regulon specific score inferred using pySCENIC and by calculating the average expression. |
| Page: 1 |
Top |
Somatic mutation of malignant transformation related genes |
| Annotation of somatic variants for genes involved in malignant transformation |
| Hugo Symbol | Variant Class | Variant Classification | dbSNP RS | HGVSc | HGVSp | HGVSp Short | SWISSPROT | BIOTYPE | SIFT | PolyPhen | Tumor Sample Barcode | Tissue | Histology | Sex | Age | Stage | Therapy Types | Drugs | Outcome |
| SLC5A6 | SNV | Missense_Mutation | c.700N>C | p.Val234Leu | p.V234L | Q9Y289 | protein_coding | tolerated(0.84) | benign(0.061) | TCGA-A2-A0D0-01 | Breast | breast invasive carcinoma | Female | <65 | I/II | Chemotherapy | cytoxan | SD | |
| SLC5A6 | SNV | Missense_Mutation | rs775950585 | c.1774N>A | p.Asp592Asn | p.D592N | Q9Y289 | protein_coding | tolerated(0.12) | benign(0.115) | TCGA-AN-A046-01 | Breast | breast invasive carcinoma | Female | >=65 | I/II | Unknown | Unknown | SD |
| SLC5A6 | SNV | Missense_Mutation | c.131N>G | p.Leu44Arg | p.L44R | Q9Y289 | protein_coding | deleterious(0) | probably_damaging(0.976) | TCGA-D8-A146-01 | Breast | breast invasive carcinoma | Female | <65 | I/II | Unknown | Unknown | SD | |
| SLC5A6 | SNV | Missense_Mutation | novel | c.575N>A | p.Ala192Asp | p.A192D | Q9Y289 | protein_coding | deleterious(0) | benign(0.261) | TCGA-E2-A2P6-01 | Breast | breast invasive carcinoma | Female | >=65 | I/II | Hormone Therapy | anastrozole | SD |
| SLC5A6 | SNV | Missense_Mutation | c.1231C>G | p.Leu411Val | p.L411V | Q9Y289 | protein_coding | tolerated(0.08) | possibly_damaging(0.456) | TCGA-E9-A1R2-01 | Breast | breast invasive carcinoma | Female | <65 | III/IV | Chemotherapy | taxotere | CR | |
| SLC5A6 | insertion | Frame_Shift_Ins | novel | c.1768_1769insGA | p.His590ArgfsTer63 | p.H590Rfs*63 | Q9Y289 | protein_coding | TCGA-AN-A0FN-01 | Breast | breast invasive carcinoma | Female | <65 | I/II | Unknown | Unknown | SD | ||
| SLC5A6 | insertion | Nonsense_Mutation | novel | c.1767_1768insTAAAAAAAAAAAATAAAAATAAA | p.His590Ter | p.H590* | Q9Y289 | protein_coding | TCGA-AN-A0FN-01 | Breast | breast invasive carcinoma | Female | <65 | I/II | Unknown | Unknown | SD | ||
| SLC5A6 | SNV | Missense_Mutation | c.757C>T | p.Arg253Trp | p.R253W | Q9Y289 | protein_coding | deleterious(0) | probably_damaging(1) | TCGA-2W-A8YY-01 | Cervix | cervical & endocervical cancer | Female | <65 | I/II | Chemotherapy | cisplatin | CR | |
| SLC5A6 | SNV | Missense_Mutation | c.1566N>G | p.Phe522Leu | p.F522L | Q9Y289 | protein_coding | tolerated(0.66) | benign(0) | TCGA-Q1-A73O-01 | Cervix | cervical & endocervical cancer | Female | <65 | I/II | Chemotherapy | cisplatin | CR | |
| SLC5A6 | SNV | Missense_Mutation | novel | c.1265N>A | p.Pro422His | p.P422H | Q9Y289 | protein_coding | deleterious(0.04) | possibly_damaging(0.852) | TCGA-VS-A94Z-01 | Cervix | cervical & endocervical cancer | Female | <65 | I/II | Chemotherapy | cisplatin | CR |
| Page: 1 2 3 4 5 6 7 |
Top |
Related drugs of malignant transformation related genes |
| Identification of chemicals and drugs interact with genes involved in malignant transfromation |
| (DGIdb 4.0) |
| Entrez ID | Symbol | Category | Interaction Types | Drug Claim Name | Drug Name | PMIDs |
| 8884 | SLC5A6 | EXTERNAL SIDE OF PLASMA MEMBRANE, DRUGGABLE GENOME, TRANSPORTER | Gabapentin enacarbil |
| Page: 1 |

Copyright 2023-Present -The University of Texas Health Science Center at Houston |