Schematic overview of the cellular and molecular mechanisms involved in the cancer progression, including the proposed cellular and molecular mechanisms in cancer cells trajectory. AT1: alveolar type 1 cells; AT2: alveolar type 2 cells; AAH: atypical adenomatous hyperplasia; AIS: adenocarcinoma in situ; MIA: minimally invasive adenocarcinoma; IA: invasive adenocarcinoma; EMT: epithelial-mesenchymal transition

Home

Download

Statistics

Help

Contact

Center for Computational Systems Medicine
leaf

Gene summary

leaf

Malignant transformation analysis

leaf

Malignant transformation related pathway analysis

leaf

Cell-cell communication analysis

leaf

Single-cell gene regulatory network inference analysis

leaf

Somatic mutation of malignant transformation related genes

leaf

Related drugs of malignant transformation related genes

Gene: SLC5A3

Gene summary for SLC5A3

check button Gene summary.

Gene informationSpeciesHuman
Gene symbol

SLC5A3

Gene ID

6526

Gene namesolute carrier family 5 member 3
Gene AliasBCW2
Cytomap21q22.11
Gene Typeprotein-coding
GO ID

GO:0003008

UniProtAcc

NA


Top

Malignant transformation analysis

check button Identification of the aberrant gene expression in precancerous and cancerous lesions by comparing the gene expression of stem-like cells in diseased tissues with normal stem cells
check button Malignant transformation involving gene list.
Entrez IDSymbolReplicatesSpeciesOrganTissueAdj P-valueLog2FCMalignancy
6526SLC5A3LZE4THumanEsophagusESCC8.64e-084.29e-010.0811
6526SLC5A3LZE7THumanEsophagusESCC1.77e-109.10e-010.0667
6526SLC5A3LZE8THumanEsophagusESCC1.55e-051.66e-010.067
6526SLC5A3LZE20THumanEsophagusESCC3.99e-032.37e-010.0662
6526SLC5A3LZE22THumanEsophagusESCC2.92e-042.44e-010.068
6526SLC5A3LZE24THumanEsophagusESCC2.47e-06-2.18e-020.0596
6526SLC5A3LZE6THumanEsophagusESCC1.05e-073.45e-010.0845
6526SLC5A3P1T-EHumanEsophagusESCC4.06e-031.59e-010.0875
6526SLC5A3P2T-EHumanEsophagusESCC4.57e-079.35e-020.1177
6526SLC5A3P4T-EHumanEsophagusESCC6.43e-083.63e-010.1323
6526SLC5A3P5T-EHumanEsophagusESCC6.06e-112.43e-010.1327
6526SLC5A3P8T-EHumanEsophagusESCC1.88e-143.56e-020.0889
6526SLC5A3P9T-EHumanEsophagusESCC1.68e-094.35e-020.1131
6526SLC5A3P10T-EHumanEsophagusESCC5.64e-143.18e-010.116
6526SLC5A3P12T-EHumanEsophagusESCC9.20e-225.00e-010.1122
6526SLC5A3P15T-EHumanEsophagusESCC7.11e-098.09e-020.1149
6526SLC5A3P16T-EHumanEsophagusESCC1.64e-088.39e-020.1153
6526SLC5A3P20T-EHumanEsophagusESCC2.03e-053.09e-020.1124
6526SLC5A3P21T-EHumanEsophagusESCC1.24e-141.67e-010.1617
6526SLC5A3P22T-EHumanEsophagusESCC2.18e-172.70e-010.1236
Page: 1 2 3 4 5 6 

check button Transcriptomic changes along malignancy continuum.
TissueExpression DynamicsAbbreviation
EsophagusThe image shows the transcriptomic changes along malignancy continuum.log2FC in expression of this searched gene in stem-like cells from each diseased tissue sample relative to stem-like cells in normal samples in each tissue plotted against the malignancy continuum. Samples are colored based on if they are from different disease stage.
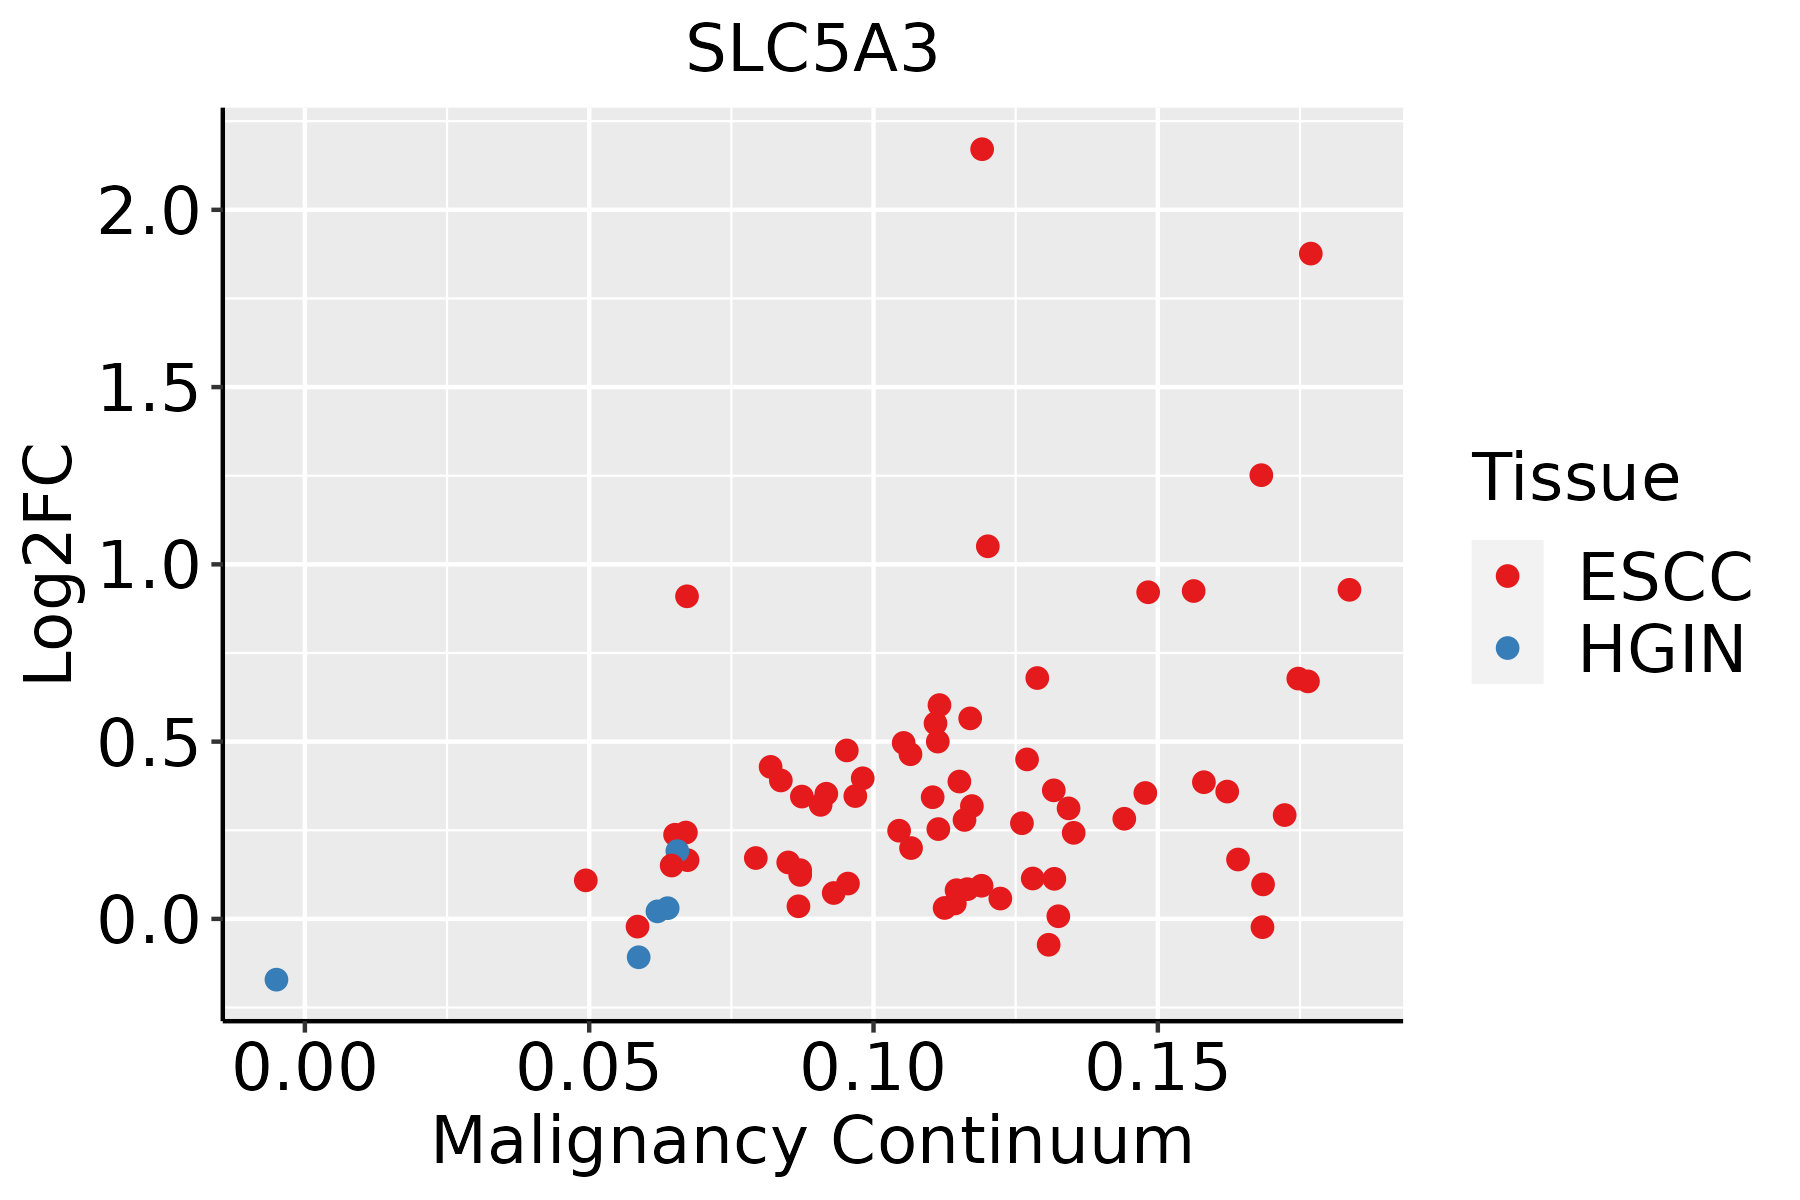
ESCC: Esophageal squamous cell carcinoma
HGIN: High-grade intraepithelial neoplasias
LGIN: Low-grade intraepithelial neoplasias
LiverThe image shows the transcriptomic changes along malignancy continuum.log2FC in expression of this searched gene in stem-like cells from each diseased tissue sample relative to stem-like cells in normal samples in each tissue plotted against the malignancy continuum. Samples are colored based on if they are from different disease stage.HCC: Hepatocellular carcinoma
NAFLD: Non-alcoholic fatty liver disease
Oral CavityThe image shows the transcriptomic changes along malignancy continuum.log2FC in expression of this searched gene in stem-like cells from each diseased tissue sample relative to stem-like cells in normal samples in each tissue plotted against the malignancy continuum. Samples are colored based on if they are from different disease stage.
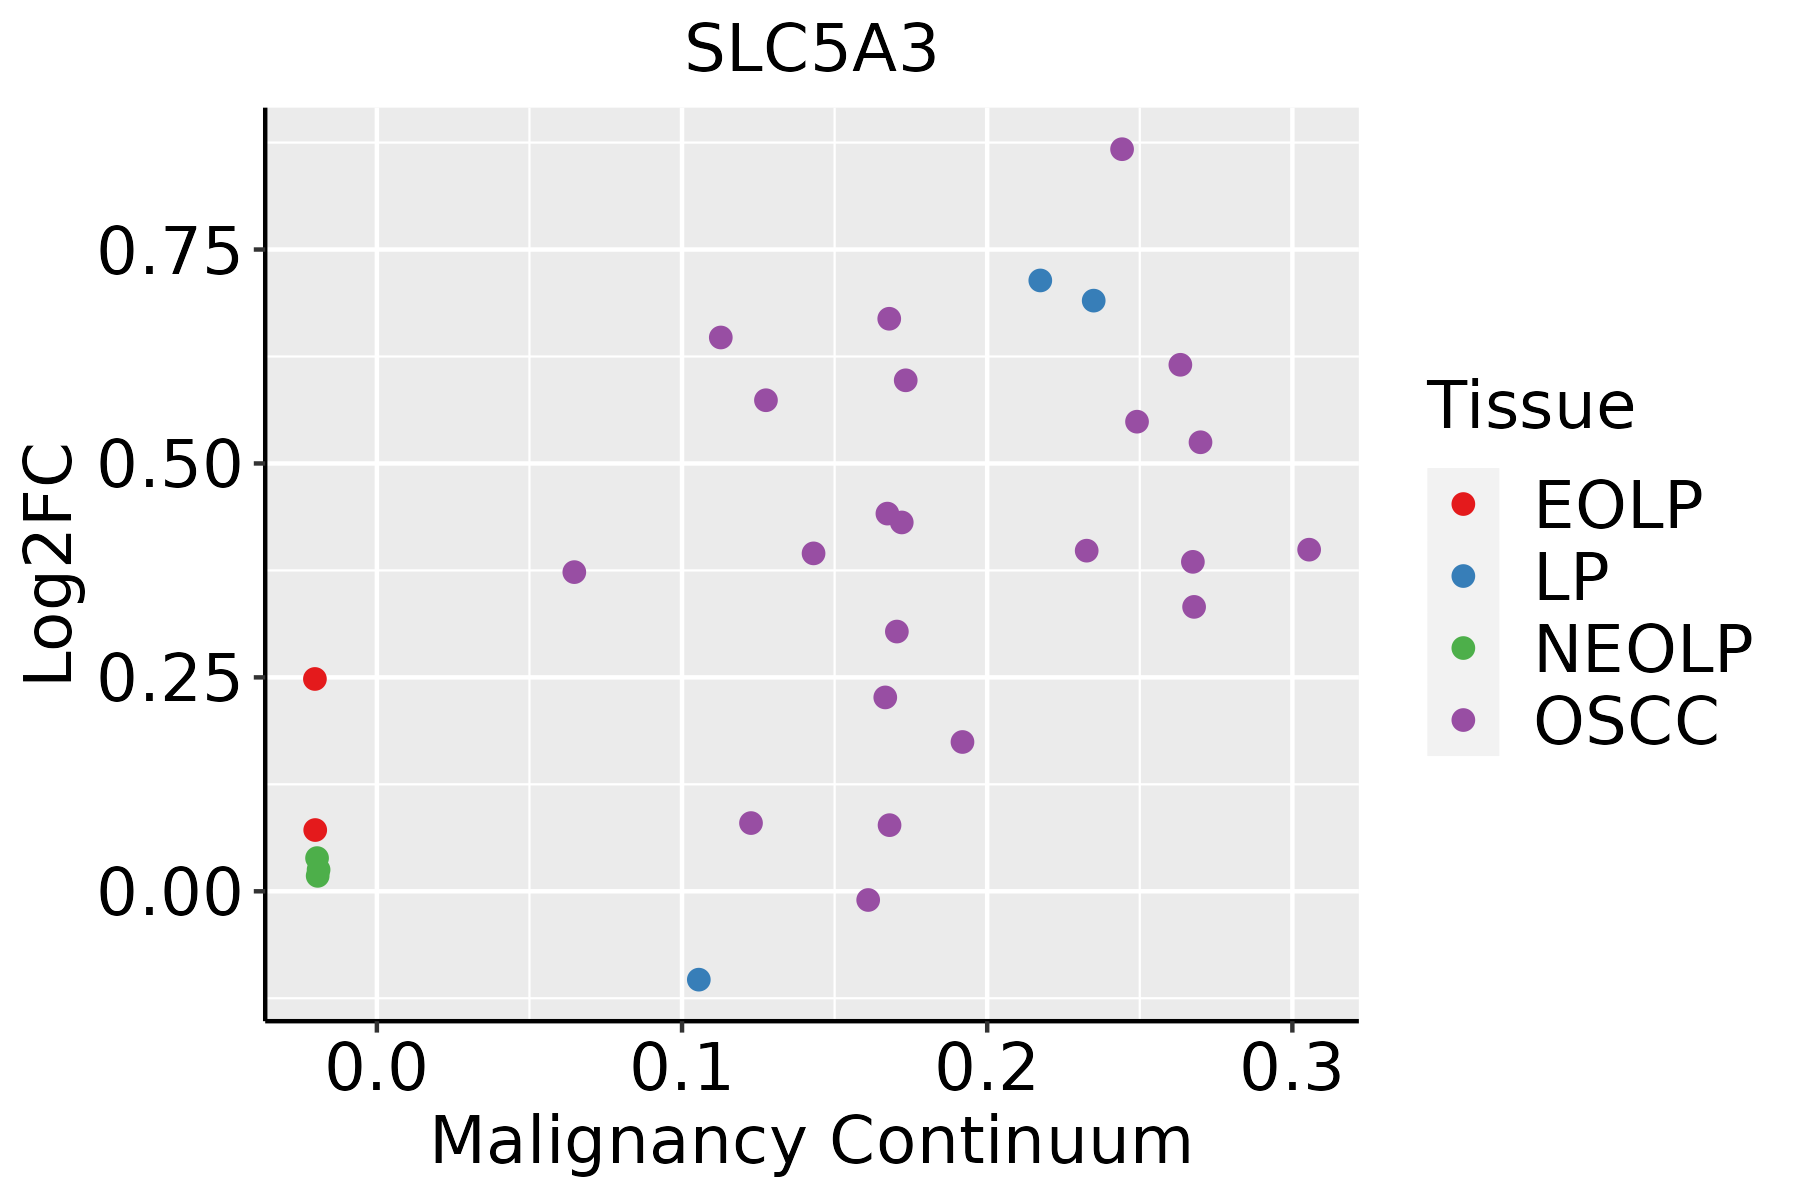
EOLP: Erosive Oral lichen planus
LP: leukoplakia
NEOLP: Non-erosive oral lichen planus
OSCC: Oral squamous cell carcinoma
ProstateThe image shows the transcriptomic changes along malignancy continuum.log2FC in expression of this searched gene in stem-like cells from each diseased tissue sample relative to stem-like cells in normal samples in each tissue plotted against the malignancy continuum. Samples are colored based on if they are from different disease stage.BPH: Benign Prostatic Hyperplasia
ThyroidThe image shows the transcriptomic changes along malignancy continuum.log2FC in expression of this searched gene in stem-like cells from each diseased tissue sample relative to stem-like cells in normal samples in each tissue plotted against the malignancy continuum. Samples are colored based on if they are from different disease stage.ATC: Anaplastic thyroid cancer
HT: Hashimoto's thyroiditis
PTC: Papillary thyroid cancer
∗log2FC in expression of this searched gene in stem-like cells from each diseased tissue sample relative to stem-like cells in normal samples in each tissue plotted against the malignancy continuum. Samples are colored based on if they are from different disease stage.

Top

Malignant transformation related pathway analysis

check buttonFind out the enriched GO biological processes and KEGG pathways involved in transition from healthy to precancer to cancer
check button Figure of enriched GO biological processes.
TissueDisease StageEnriched GO biological Processes
ColorectumADGO analysis - Figure of enriched GO biological processes: Top 15 enriched GO BP terms are showed in the bar plot of each disease state in each tissue. Each row represents a significant GO biological process which is colored according to the -log10(p.adjust).
ColorectumSERGO analysis - Figure of enriched GO biological processes: Top 15 enriched GO BP terms are showed in the bar plot of each disease state in each tissue. Each row represents a significant GO biological process which is colored according to the -log10(p.adjust).
ColorectumMSSGO analysis - Figure of enriched GO biological processes: Top 15 enriched GO BP terms are showed in the bar plot of each disease state in each tissue. Each row represents a significant GO biological process which is colored according to the -log10(p.adjust).
ColorectumMSI-HGO analysis - Figure of enriched GO biological processes: Top 15 enriched GO BP terms are showed in the bar plot of each disease state in each tissue. Each row represents a significant GO biological process which is colored according to the -log10(p.adjust).
ColorectumFAPGO analysis - Figure of enriched GO biological processes: Top 15 enriched GO BP terms are showed in the bar plot of each disease state in each tissue. Each row represents a significant GO biological process which is colored according to the -log10(p.adjust).
∗Top 15 enriched GO BP terms are showed in the bar plot of each disease state in each tissue. Each row represents a significant GO biological process which is colored according to the -log10(p.adjust).
Page: 1 2 3 4 5 6 7 8 9 

check button Enriched GO biological processes.
GO IDTissueDisease StageDescriptionGene RatioBg Ratiopvaluep.adjustCount
GO:1903829111EsophagusESCCpositive regulation of cellular protein localization199/8552276/187232.99e-193.45e-17199
GO:190547519EsophagusESCCregulation of protein localization to membrane117/8552175/187231.14e-082.26e-07117
GO:190547719EsophagusESCCpositive regulation of protein localization to membrane73/8552106/187231.13e-061.40e-0573
GO:200037718EsophagusESCCregulation of reactive oxygen species metabolic process100/8552157/187233.87e-064.17e-05100
GO:00060668EsophagusESCCalcohol metabolic process202/8552353/187237.32e-067.26e-05202
GO:00442626EsophagusESCCcellular carbohydrate metabolic process160/8552283/187231.43e-049.66e-04160
GO:007259318EsophagusESCCreactive oxygen species metabolic process137/8552239/187231.82e-041.16e-03137
GO:200037918EsophagusESCCpositive regulation of reactive oxygen species metabolic process45/855276/187231.21e-024.04e-0245
GO:190382922LiverHCCpositive regulation of cellular protein localization199/7958276/187231.15e-232.62e-21199
GO:000606621LiverHCCalcohol metabolic process208/7958353/187232.80e-109.50e-09208
GO:190547511LiverHCCregulation of protein localization to membrane113/7958175/187232.90e-097.78e-08113
GO:190547711LiverHCCpositive regulation of protein localization to membrane68/7958106/187235.50e-066.82e-0568
GO:200037722LiverHCCregulation of reactive oxygen species metabolic process92/7958157/187233.34e-053.35e-0492
GO:004426221LiverHCCcellular carbohydrate metabolic process153/7958283/187235.27e-055.00e-04153
GO:200037912LiverHCCpositive regulation of reactive oxygen species metabolic process47/795876/187235.19e-043.38e-0347
GO:007259312LiverHCCreactive oxygen species metabolic process124/7958239/187232.05e-031.04e-02124
GO:015010411LiverHCCtransport across blood-brain barrier50/795887/187233.42e-031.55e-0250
GO:001023211LiverHCCvascular transport50/795888/187234.69e-032.02e-0250
GO:0008643LiverHCCcarbohydrate transport80/7958152/187237.34e-032.92e-0280
GO:190382920Oral cavityOSCCpositive regulation of cellular protein localization179/7305276/187232.20e-182.41e-16179
Page: 1 2 3 

check button Enriched KEGG pathways.
Pathway IDTissueDisease StageDescriptionGene RatioBg Ratiopvaluep.adjustqvalueCount
Page: 1 

Top

Cell-cell communication analysis

check buttonIdentification of potential cell-cell interactions between two cell types and their ligand-receptor pairs for different disease states
LigandReceptorLRpairPathwayTissueDisease Stage
Page: 1 

Top

Single-cell gene regulatory network inference analysis

check buttonFind out the significant the regulons (TFs) and the target genes of each regulon across cell types for different disease states
TFCell TypeTissueDisease StageTarget GeneRSSRegulon Activity
∗The dot plots of a searched regulon are shown for all cell subpopulations in each disease state of each tissue based on the regulon specific score inferred using pySCENIC and by calculating the average expression.
Page: 1 

Top

Somatic mutation of malignant transformation related genes

check buttonAnnotation of somatic variants for genes involved in malignant transformation
Hugo SymbolVariant ClassVariant ClassificationdbSNP RSHGVScHGVSpHGVSp ShortSWISSPROTBIOTYPESIFTPolyPhenTumor Sample BarcodeTissueHistologySexAgeStageTherapy TypesDrugsOutcome
SLC5A3SNVMissense_Mutationnovelc.163N>Gp.Leu55Valp.L55VP53794protein_codingdeleterious(0.01)probably_damaging(0.999)TCGA-AR-A2LE-01Breastbreast invasive carcinomaFemale>=65I/IIHormone TherapytamoxiphenPD
SLC5A3SNVMissense_Mutationc.145G>Tp.Val49Leup.V49LP53794protein_codingtolerated(0.12)benign(0.003)TCGA-BH-A0H5-01Breastbreast invasive carcinomaFemale<65I/IIChemotherapycytoxanCR
SLC5A3SNVMissense_Mutationnovelc.34A>Gp.Ile12Valp.I12VP53794protein_codingtolerated(1)benign(0.003)TCGA-D8-A1JJ-01Breastbreast invasive carcinomaFemale<65I/IIChemotherapydoxorubicineSD
SLC5A3SNVMissense_Mutationc.880C>Tp.His294Tyrp.H294YP53794protein_codingdeleterious(0)possibly_damaging(0.855)TCGA-EW-A1OV-01Breastbreast invasive carcinomaFemale<65I/IIChemotherapyepirubicinSD
SLC5A3SNVMissense_Mutationnovelc.1702N>Ap.Gln568Lysp.Q568KP53794protein_codingtolerated(0.72)benign(0.135)TCGA-GM-A3XL-01Breastbreast invasive carcinomaFemale<65I/IIChemotherapyfluorouracilCR
SLC5A3insertionNonsense_Mutationnovelc.1470_1471insGGATGACTTGGAp.Ala490_Tyr491insGlyTerLeuGlyp.A490_Y491insG*LGP53794protein_codingTCGA-AN-A04A-01Breastbreast invasive carcinomaFemale<65III/IVUnknownUnknownSD
SLC5A3insertionFrame_Shift_Insnovelc.209_210insTTTTTTTTCTTTTTp.Ser71PhefsTer66p.S71Ffs*66P53794protein_codingTCGA-AO-A0JB-01Breastbreast invasive carcinomaFemale<65III/IVChemotherapycyclophosphamideSD
SLC5A3insertionNonsense_Mutationnovelc.211_212insAAAGAATGTCTTGTTGCGCCGTGTTTGCTAGAp.Ser71Terp.S71*P53794protein_codingTCGA-AO-A0JB-01Breastbreast invasive carcinomaFemale<65III/IVChemotherapycyclophosphamideSD
SLC5A3insertionNonsense_Mutationnovelc.412_413insTATGACAACTATATCCATTTACTGGAGTTTAAGAAGCTTTATAACp.Lys138delinsIleTerGlnLeuTyrProPheThrGlyValTerGluAlaLeuTerGlnp.K138delinsI*QLYPFTGV*EAL*QP53794protein_codingTCGA-AO-A0JD-01Breastbreast invasive carcinomaFemale<65III/IVChemotherapycyclophosphamideSD
SLC5A3deletionFrame_Shift_Delc.72delNp.Phe26LeufsTer11p.F26Lfs*11P53794protein_codingTCGA-BH-A0HA-01Breastbreast invasive carcinomaFemale<65I/IIUnknownUnknownSD
Page: 1 2 3 4 5 6 7 8 

Top

Related drugs of malignant transformation related genes

check buttonIdentification of chemicals and drugs interact with genes involved in malignant transfromation
(DGIdb 4.0)
Entrez IDSymbolCategoryInteraction TypesDrug Claim NameDrug NamePMIDs
6526SLC5A3EXTERNAL SIDE OF PLASMA MEMBRANE, DRUGGABLE GENOME, TRANSPORTERinhibitor178101467PHLORIZIN
Page: 1