
|
|||||
|
 | |
| |
| |
| |
| |
| |
|
Gene: SLC5A1 |
Gene summary for SLC5A1 |
| Gene information | Species | Human | Gene symbol | SLC5A1 | Gene ID | 6523 |
| Gene name | solute carrier family 5 member 1 | |
| Gene Alias | D22S675 | |
| Cytomap | 22q12.3 | |
| Gene Type | protein-coding | GO ID | GO:0000017 | UniProtAcc | P13866 |
Top |
Malignant transformation analysis |
| Identification of the aberrant gene expression in precancerous and cancerous lesions by comparing the gene expression of stem-like cells in diseased tissues with normal stem cells |
| Entrez ID | Symbol | Replicates | Species | Organ | Tissue | Adj P-value | Log2FC | Malignancy |
| 6523 | SLC5A1 | HTA11_99999970781_79442 | Human | Colorectum | MSS | 8.61e-19 | 7.93e-01 | 0.294 |
| 6523 | SLC5A1 | HTA11_99999965104_69814 | Human | Colorectum | MSS | 6.33e-07 | 6.34e-01 | 0.281 |
| 6523 | SLC5A1 | HTA11_99999971662_82457 | Human | Colorectum | MSS | 5.59e-05 | 5.34e-01 | 0.3859 |
| 6523 | SLC5A1 | A015-C-203 | Human | Colorectum | FAP | 8.24e-11 | -1.70e-01 | -0.1294 |
| 6523 | SLC5A1 | A014-C-040 | Human | Colorectum | FAP | 1.60e-03 | -3.59e-01 | -0.1184 |
| 6523 | SLC5A1 | A002-C-201 | Human | Colorectum | FAP | 6.18e-05 | -1.51e-01 | 0.0324 |
| 6523 | SLC5A1 | A001-C-108 | Human | Colorectum | FAP | 6.75e-04 | -6.23e-02 | -0.0272 |
| 6523 | SLC5A1 | A002-C-205 | Human | Colorectum | FAP | 1.51e-10 | -2.32e-01 | -0.1236 |
| 6523 | SLC5A1 | A015-C-006 | Human | Colorectum | FAP | 2.54e-06 | -1.65e-01 | -0.0994 |
| 6523 | SLC5A1 | A015-C-106 | Human | Colorectum | FAP | 3.00e-02 | 7.95e-02 | -0.0511 |
| 6523 | SLC5A1 | A002-C-114 | Human | Colorectum | FAP | 2.01e-06 | -1.51e-01 | -0.1561 |
| 6523 | SLC5A1 | A015-C-104 | Human | Colorectum | FAP | 2.70e-10 | -1.99e-01 | -0.1899 |
| 6523 | SLC5A1 | A002-C-016 | Human | Colorectum | FAP | 2.28e-04 | -1.03e-01 | 0.0521 |
| 6523 | SLC5A1 | A015-C-002 | Human | Colorectum | FAP | 5.11e-03 | -7.36e-02 | -0.0763 |
| 6523 | SLC5A1 | A002-C-116 | Human | Colorectum | FAP | 6.51e-11 | -1.85e-01 | -0.0452 |
| 6523 | SLC5A1 | A014-C-008 | Human | Colorectum | FAP | 4.70e-08 | -3.38e-01 | -0.191 |
| 6523 | SLC5A1 | A018-E-020 | Human | Colorectum | FAP | 2.00e-07 | -1.97e-01 | -0.2034 |
| 6523 | SLC5A1 | F034 | Human | Colorectum | FAP | 1.83e-04 | -1.19e-01 | -0.0665 |
| 6523 | SLC5A1 | Pat01-B | Human | Stomach | GC | 3.31e-57 | 1.13e+00 | 0.5754 |
| 6523 | SLC5A1 | Pat02-B | Human | Stomach | GC | 2.92e-11 | 2.22e-01 | 0.0368 |
| Page: 1 2 |
| Tissue | Expression Dynamics | Abbreviation |
| Colorectum (GSE201348) |  | FAP: Familial adenomatous polyposis |
| CRC: Colorectal cancer | ||
| Colorectum (HTA11) |  | AD: Adenomas |
| SER: Sessile serrated lesions | ||
| MSI-H: Microsatellite-high colorectal cancer | ||
| MSS: Microsatellite stable colorectal cancer | ||
| GC | 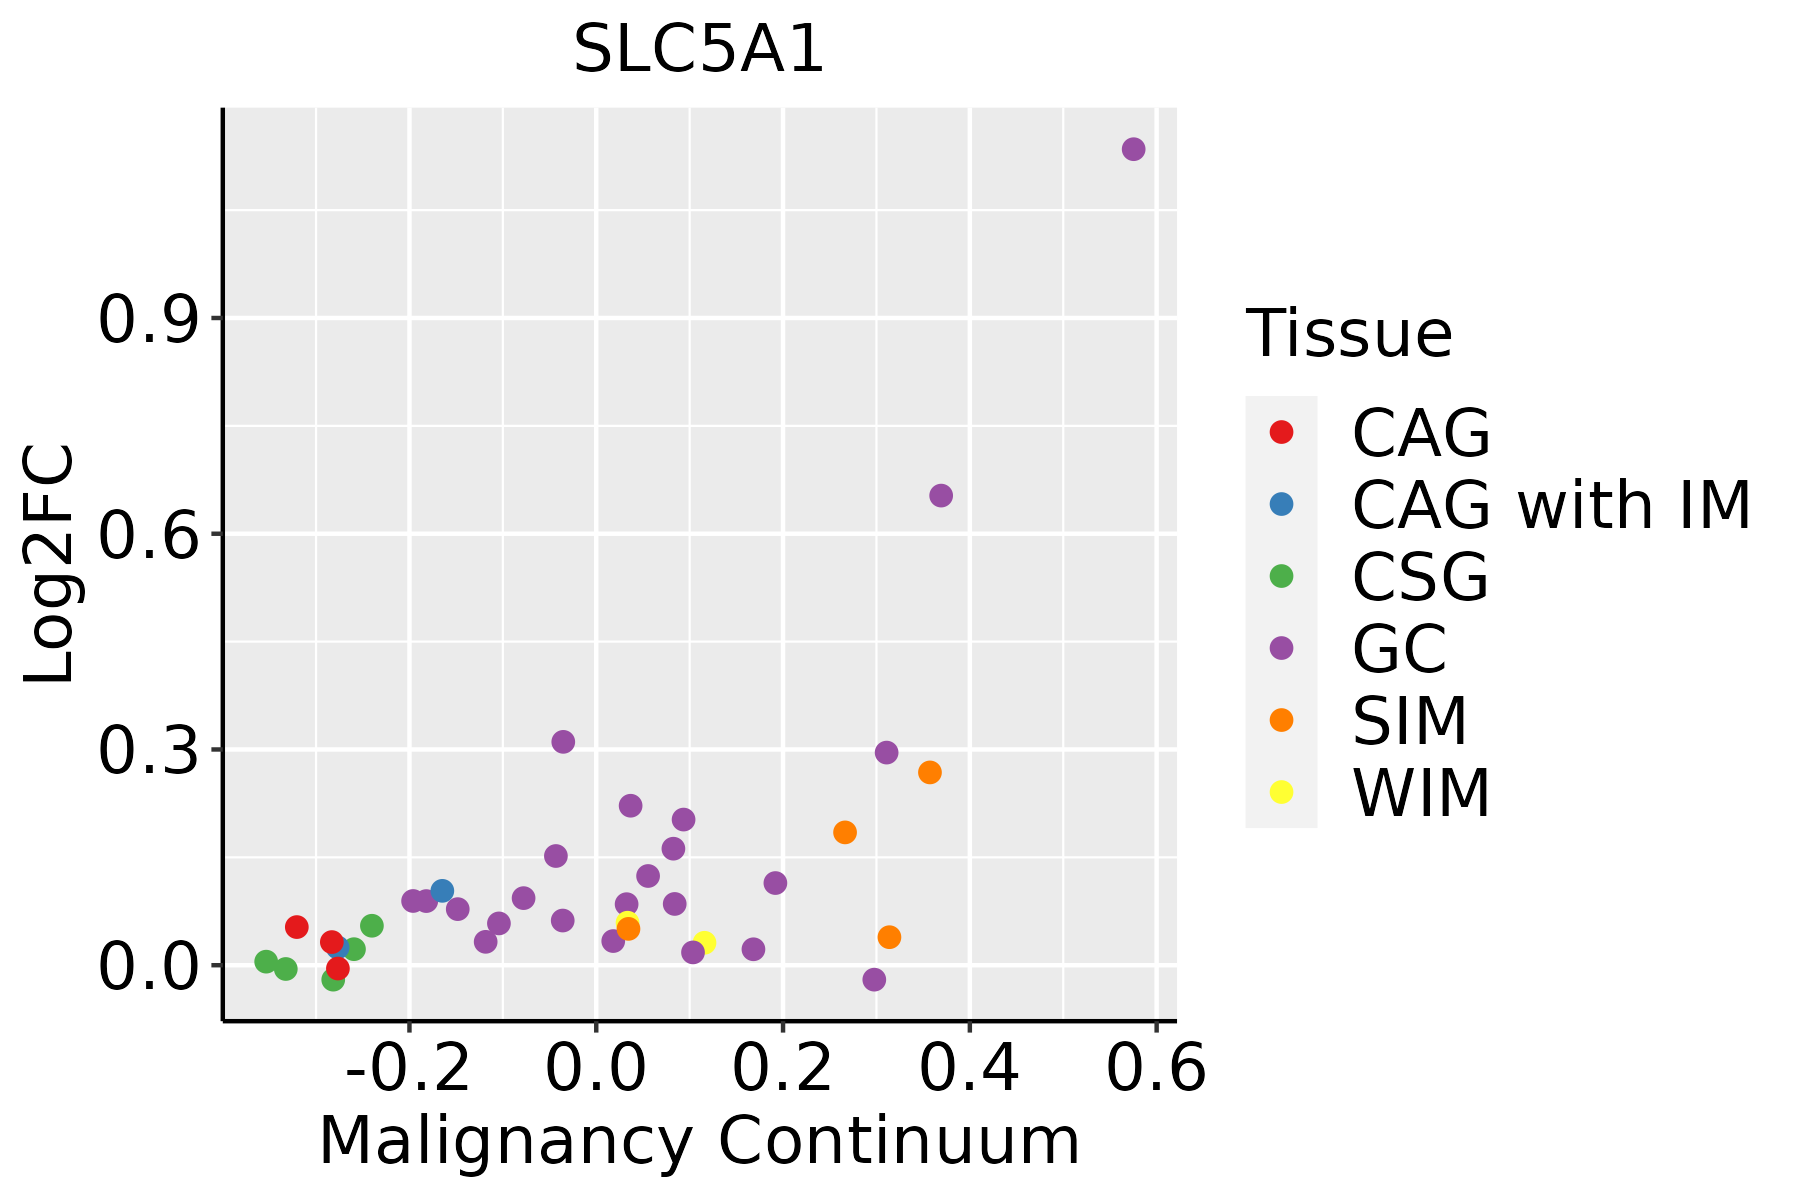 | CAG: Chronic atrophic gastritis |
| CAG with IM: Chronic atrophic gastritis with intestinal metaplasia | ||
| CSG: Chronic superficial gastritis | ||
| GC: Gastric cancer | ||
| SIM: Severe intestinal metaplasia | ||
| WIM: Wild intestinal metaplasia |
| ∗log2FC in expression of this searched gene in stem-like cells from each diseased tissue sample relative to stem-like cells in normal samples in each tissue plotted against the malignancy continuum. Samples are colored based on if they are from different disease stage. |
Top |
Malignant transformation related pathway analysis |
| Find out the enriched GO biological processes and KEGG pathways involved in transition from healthy to precancer to cancer |
| Tissue | Disease Stage | Enriched GO biological Processes |
| Colorectum | AD |  |
| Colorectum | SER |  |
| Colorectum | MSS |  |
| Colorectum | MSI-H |  |
| Colorectum | FAP |  |
| ∗Top 15 enriched GO BP terms are showed in the bar plot of each disease state in each tissue. Each row represents a significant GO biological process which is colored according to the -log10(p.adjust). |
| Page: 1 2 3 4 5 6 7 8 9 |
| GO ID | Tissue | Disease Stage | Description | Gene Ratio | Bg Ratio | pvalue | p.adjust | Count |
| GO:00508921 | Colorectum | MSS | intestinal absorption | 17/3467 | 41/18723 | 5.48e-04 | 6.10e-03 | 17 |
| GO:0150104 | Colorectum | MSS | transport across blood-brain barrier | 28/3467 | 87/18723 | 1.54e-03 | 1.41e-02 | 28 |
| GO:0010232 | Colorectum | MSS | vascular transport | 28/3467 | 88/18723 | 1.87e-03 | 1.64e-02 | 28 |
| GO:0070633 | Colorectum | MSS | transepithelial transport | 13/3467 | 31/18723 | 2.14e-03 | 1.80e-02 | 13 |
| GO:00226001 | Colorectum | MSS | digestive system process | 31/3467 | 104/18723 | 3.46e-03 | 2.59e-02 | 31 |
| GO:0035725 | Colorectum | FAP | sodium ion transmembrane transport | 44/2622 | 178/18723 | 9.31e-05 | 1.60e-03 | 44 |
| GO:00706331 | Colorectum | FAP | transepithelial transport | 13/2622 | 31/18723 | 1.34e-04 | 2.15e-03 | 13 |
| GO:01501041 | Colorectum | FAP | transport across blood-brain barrier | 25/2622 | 87/18723 | 2.63e-04 | 3.59e-03 | 25 |
| GO:00102321 | Colorectum | FAP | vascular transport | 25/2622 | 88/18723 | 3.19e-04 | 4.12e-03 | 25 |
| GO:0006814 | Colorectum | FAP | sodium ion transport | 54/2622 | 245/18723 | 3.98e-04 | 4.85e-03 | 54 |
| GO:0003018 | Colorectum | FAP | vascular process in circulatory system | 56/2622 | 263/18723 | 7.67e-04 | 8.12e-03 | 56 |
| GO:0046323 | Colorectum | FAP | glucose import | 20/2622 | 74/18723 | 2.36e-03 | 1.88e-02 | 20 |
| GO:0042045 | Colorectum | FAP | epithelial fluid transport | 5/2622 | 10/18723 | 7.32e-03 | 4.38e-02 | 5 |
| GO:00226002 | Colorectum | FAP | digestive system process | 24/2622 | 104/18723 | 8.41e-03 | 4.89e-02 | 24 |
| GO:00508922 | Colorectum | FAP | intestinal absorption | 12/2622 | 41/18723 | 8.57e-03 | 4.96e-02 | 12 |
| GO:0007586 | Stomach | GC | digestion | 38/1159 | 137/18723 | 1.80e-15 | 1.22e-12 | 38 |
| GO:00226006 | Stomach | GC | digestive system process | 30/1159 | 104/18723 | 5.40e-13 | 2.10e-10 | 30 |
| GO:00508925 | Stomach | GC | intestinal absorption | 18/1159 | 41/18723 | 8.10e-12 | 2.20e-09 | 18 |
| GO:00075861 | Stomach | CAG with IM | digestion | 29/1050 | 137/18723 | 4.42e-10 | 6.93e-08 | 29 |
| GO:002260011 | Stomach | CAG with IM | digestive system process | 22/1050 | 104/18723 | 5.62e-08 | 4.16e-06 | 22 |
| Page: 1 2 |
| Pathway ID | Tissue | Disease Stage | Description | Gene Ratio | Bg Ratio | pvalue | p.adjust | qvalue | Count |
| hsa04976 | Colorectum | FAP | Bile secretion | 24/1404 | 89/8465 | 8.76e-03 | 3.21e-02 | 1.96e-02 | 24 |
| hsa049761 | Colorectum | FAP | Bile secretion | 24/1404 | 89/8465 | 8.76e-03 | 3.21e-02 | 1.96e-02 | 24 |
| hsa04978 | Stomach | GC | Mineral absorption | 15/708 | 60/8465 | 8.88e-05 | 9.80e-04 | 6.90e-04 | 15 |
| hsa049781 | Stomach | GC | Mineral absorption | 15/708 | 60/8465 | 8.88e-05 | 9.80e-04 | 6.90e-04 | 15 |
| hsa049782 | Stomach | CAG with IM | Mineral absorption | 12/640 | 60/8465 | 1.52e-03 | 1.01e-02 | 7.10e-03 | 12 |
| hsa049783 | Stomach | CAG with IM | Mineral absorption | 12/640 | 60/8465 | 1.52e-03 | 1.01e-02 | 7.10e-03 | 12 |
| hsa049788 | Stomach | SIM | Mineral absorption | 11/465 | 60/8465 | 3.61e-04 | 3.41e-03 | 2.74e-03 | 11 |
| hsa049789 | Stomach | SIM | Mineral absorption | 11/465 | 60/8465 | 3.61e-04 | 3.41e-03 | 2.74e-03 | 11 |
| Page: 1 |
Top |
Cell-cell communication analysis |
| Identification of potential cell-cell interactions between two cell types and their ligand-receptor pairs for different disease states |
| Ligand | Receptor | LRpair | Pathway | Tissue | Disease Stage |
| Page: 1 |
Top |
Single-cell gene regulatory network inference analysis |
| Find out the significant the regulons (TFs) and the target genes of each regulon across cell types for different disease states |
| TF | Cell Type | Tissue | Disease Stage | Target Gene | RSS | Regulon Activity |
| ∗The dot plots of a searched regulon are shown for all cell subpopulations in each disease state of each tissue based on the regulon specific score inferred using pySCENIC and by calculating the average expression. |
| Page: 1 |
Top |
Somatic mutation of malignant transformation related genes |
| Annotation of somatic variants for genes involved in malignant transformation |
| Hugo Symbol | Variant Class | Variant Classification | dbSNP RS | HGVSc | HGVSp | HGVSp Short | SWISSPROT | BIOTYPE | SIFT | PolyPhen | Tumor Sample Barcode | Tissue | Histology | Sex | Age | Stage | Therapy Types | Drugs | Outcome |
| SLC5A1 | SNV | Missense_Mutation | novel | c.1923N>T | p.Trp641Cys | p.W641C | P13866 | protein_coding | deleterious(0.01) | probably_damaging(0.987) | TCGA-A2-A25A-01 | Breast | breast invasive carcinoma | Female | <65 | I/II | Unspecific | Cytoxan | SD |
| SLC5A1 | insertion | In_Frame_Ins | novel | c.870_871insCTTCCCTTTTACAAAGAGGTTTACAGT | p.Tyr290_Trp291insLeuProPheTyrLysGluValTyrSer | p.Y290_W291insLPFYKEVYS | P13866 | protein_coding | TCGA-A2-A04Y-01 | Breast | breast invasive carcinoma | Female | <65 | I/II | Chemotherapy | cytoxan | SD | ||
| SLC5A1 | insertion | Nonsense_Mutation | novel | c.556_557insGTGACCCTGGTGCTCTCTGCTGGTTTATATGAGCAACTGCACCATC | p.Ala186GlyfsTer11 | p.A186Gfs*11 | P13866 | protein_coding | TCGA-AO-A03O-01 | Breast | breast invasive carcinoma | Female | >=65 | I/II | Chemotherapy | doxorubicin | SD | ||
| SLC5A1 | SNV | Missense_Mutation | novel | c.899N>A | p.Arg300His | p.R300H | P13866 | protein_coding | deleterious(0) | probably_damaging(0.997) | TCGA-2W-A8YY-01 | Cervix | cervical & endocervical cancer | Female | <65 | I/II | Chemotherapy | cisplatin | CR |
| SLC5A1 | SNV | Missense_Mutation | rs202145392 | c.1360N>A | p.Asp454Asn | p.D454N | P13866 | protein_coding | tolerated(0.15) | possibly_damaging(0.7) | TCGA-C5-A1M6-01 | Cervix | cervical & endocervical cancer | Female | <65 | I/II | Chemotherapy | cisplatin | PD |
| SLC5A1 | SNV | Missense_Mutation | c.1496G>A | p.Arg499His | p.R499H | P13866 | protein_coding | deleterious(0.01) | probably_damaging(0.981) | TCGA-A6-5661-01 | Colorectum | colon adenocarcinoma | Female | >=65 | I/II | Unknown | Unknown | SD | |
| SLC5A1 | SNV | Missense_Mutation | c.289N>A | p.Ala97Thr | p.A97T | P13866 | protein_coding | deleterious(0) | possibly_damaging(0.73) | TCGA-AA-3949-01 | Colorectum | colon adenocarcinoma | Female | >=65 | III/IV | Unknown | Unknown | SD | |
| SLC5A1 | SNV | Missense_Mutation | c.1931N>C | p.Val644Ala | p.V644A | P13866 | protein_coding | deleterious(0.02) | benign(0.052) | TCGA-AA-3966-01 | Colorectum | colon adenocarcinoma | Female | >=65 | I/II | Unknown | Unknown | SD | |
| SLC5A1 | SNV | Missense_Mutation | novel | c.599N>G | p.Val200Gly | p.V200G | P13866 | protein_coding | deleterious(0) | probably_damaging(0.999) | TCGA-AA-A01K-01 | Colorectum | colon adenocarcinoma | Female | >=65 | III/IV | Chemotherapy | folinic | CR |
| SLC5A1 | SNV | Missense_Mutation | c.892G>A | p.Val298Met | p.V298M | P13866 | protein_coding | deleterious(0) | probably_damaging(1) | TCGA-AU-6004-01 | Colorectum | colon adenocarcinoma | Female | >=65 | I/II | Unknown | Unknown | SD |
| Page: 1 2 3 4 5 6 7 8 |
Top |
Related drugs of malignant transformation related genes |
| Identification of chemicals and drugs interact with genes involved in malignant transfromation |
| (DGIdb 4.0) |
| Entrez ID | Symbol | Category | Interaction Types | Drug Claim Name | Drug Name | PMIDs |
| 6523 | SLC5A1 | DRUGGABLE GENOME, EXTERNAL SIDE OF PLASMA MEMBRANE, TRANSPORTER | LIK-066 | LICOGLIFLOZIN | ||
| 6523 | SLC5A1 | DRUGGABLE GENOME, EXTERNAL SIDE OF PLASMA MEMBRANE, TRANSPORTER | inhibitor | 252166524 | SOTAGLIFLOZIN | |
| 6523 | SLC5A1 | DRUGGABLE GENOME, EXTERNAL SIDE OF PLASMA MEMBRANE, TRANSPORTER | STZ | STREPTOZOCIN | 1722397 | |
| 6523 | SLC5A1 | DRUGGABLE GENOME, EXTERNAL SIDE OF PLASMA MEMBRANE, TRANSPORTER | inhibitor | 178101464 | EMPAGLIFLOZIN | |
| 6523 | SLC5A1 | DRUGGABLE GENOME, EXTERNAL SIDE OF PLASMA MEMBRANE, TRANSPORTER | inhibitor | 336446933 | ||
| 6523 | SLC5A1 | DRUGGABLE GENOME, EXTERNAL SIDE OF PLASMA MEMBRANE, TRANSPORTER | GLUFOSFAMIDE | GLUFOSFAMIDE | ||
| 6523 | SLC5A1 | DRUGGABLE GENOME, EXTERNAL SIDE OF PLASMA MEMBRANE, TRANSPORTER | inhibitor | 404859101 | LICOGLIFLOZIN | |
| 6523 | SLC5A1 | DRUGGABLE GENOME, EXTERNAL SIDE OF PLASMA MEMBRANE, TRANSPORTER | LX4211 | |||
| 6523 | SLC5A1 | DRUGGABLE GENOME, EXTERNAL SIDE OF PLASMA MEMBRANE, TRANSPORTER | 1614235 + 2330672 | |||
| 6523 | SLC5A1 | DRUGGABLE GENOME, EXTERNAL SIDE OF PLASMA MEMBRANE, TRANSPORTER | inhibitor | 328083497 | TOFOGLIFLOZIN |
| Page: 1 2 |

Copyright 2023-Present -The University of Texas Health Science Center at Houston |