
|
|||||
|
 | |
| |
| |
| |
| |
| |
|
Gene: SLC51B |
Gene summary for SLC51B |
| Gene information | Species | Human | Gene symbol | SLC51B | Gene ID | 123264 |
| Gene name | solute carrier family 51 subunit beta | |
| Gene Alias | OSTB | |
| Cytomap | 15q22.31 | |
| Gene Type | protein-coding | GO ID | GO:0006464 | UniProtAcc | Q86UW2 |
Top |
Malignant transformation analysis |
| Identification of the aberrant gene expression in precancerous and cancerous lesions by comparing the gene expression of stem-like cells in diseased tissues with normal stem cells |
| Entrez ID | Symbol | Replicates | Species | Organ | Tissue | Adj P-value | Log2FC | Malignancy |
| 123264 | SLC51B | Pat01-B | Human | Stomach | GC | 4.13e-33 | 6.16e-01 | 0.5754 |
| 123264 | SLC51B | Pat03-B | Human | Stomach | GC | 3.75e-10 | 2.48e-01 | 0.3693 |
| 123264 | SLC51B | SIM_1 | Human | Stomach | SIM | 2.00e-06 | 2.59e-01 | 0.3573 |
| Page: 1 |
| Tissue | Expression Dynamics | Abbreviation |
| GC | 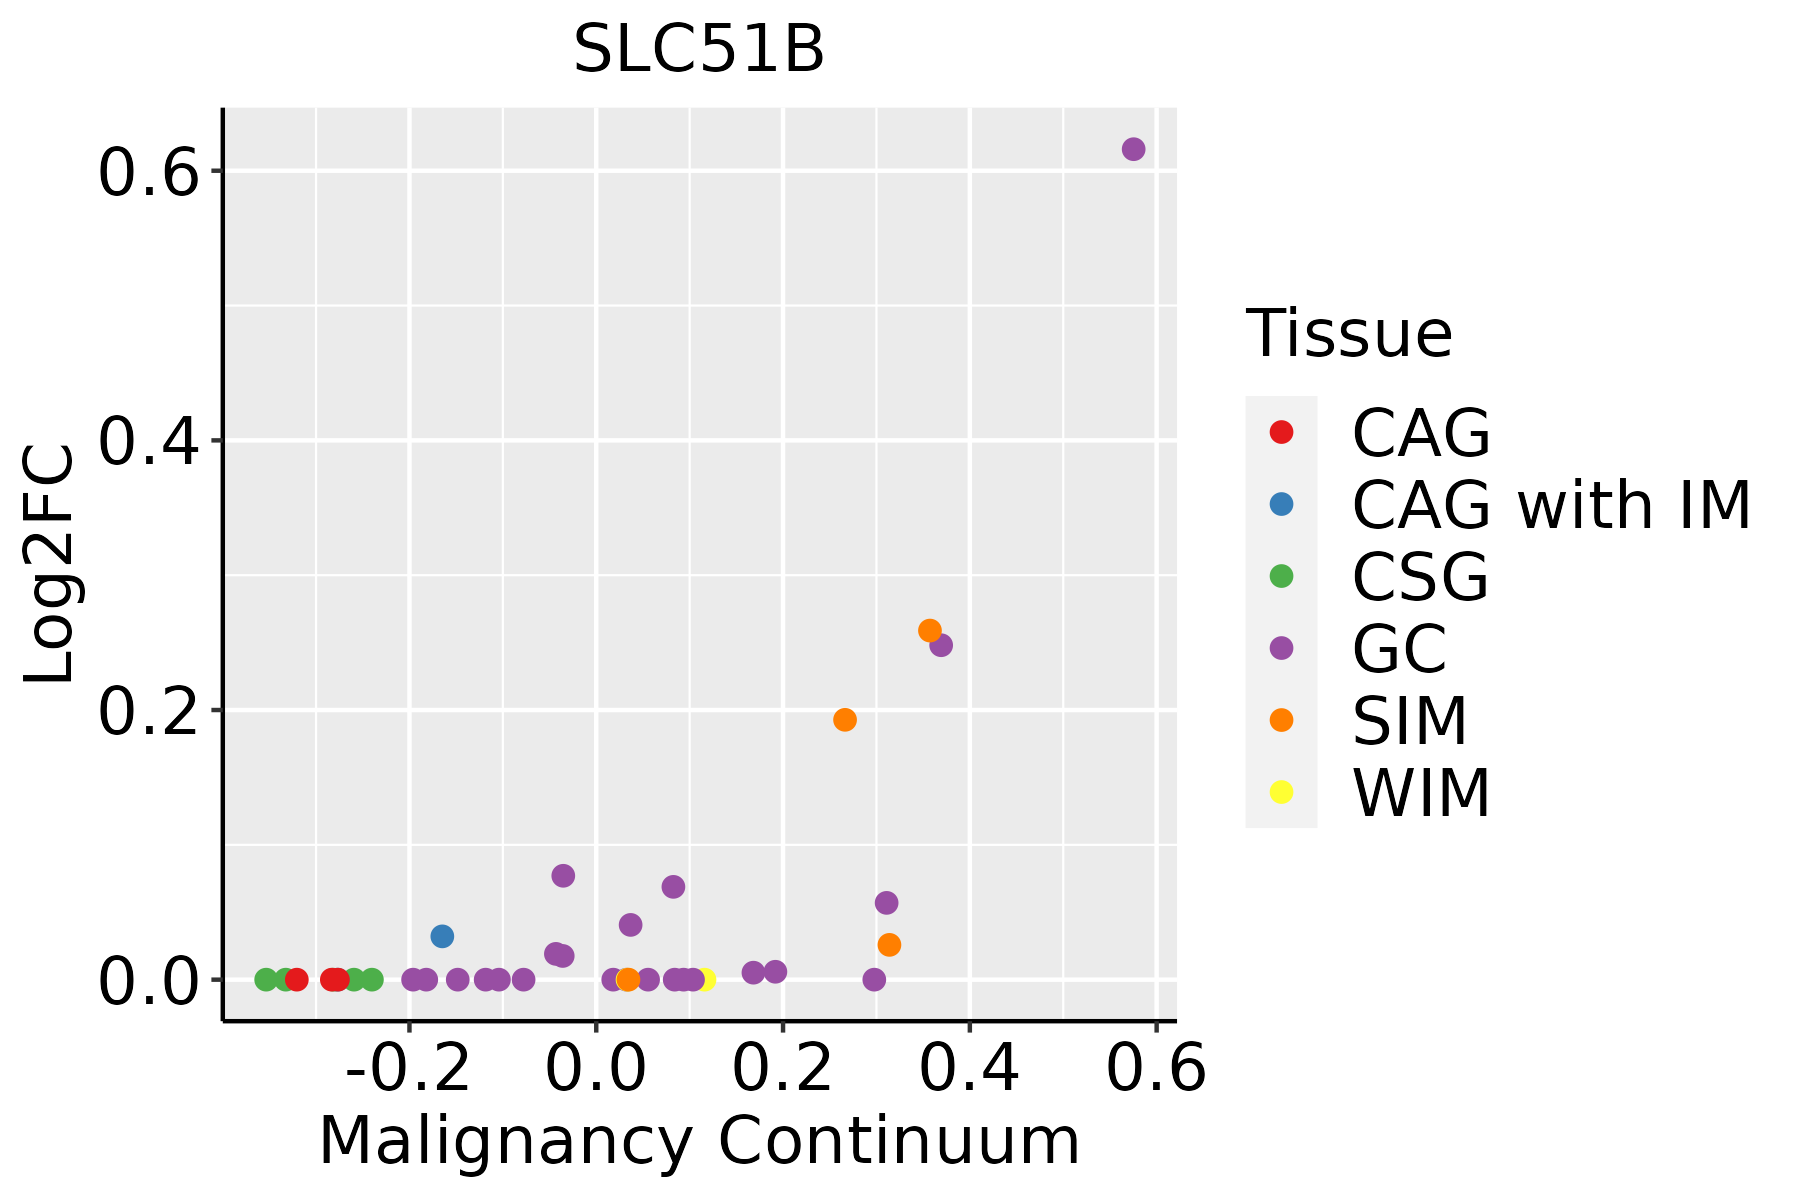 | CAG: Chronic atrophic gastritis |
| CAG with IM: Chronic atrophic gastritis with intestinal metaplasia | ||
| CSG: Chronic superficial gastritis | ||
| GC: Gastric cancer | ||
| SIM: Severe intestinal metaplasia | ||
| WIM: Wild intestinal metaplasia |
| ∗log2FC in expression of this searched gene in stem-like cells from each diseased tissue sample relative to stem-like cells in normal samples in each tissue plotted against the malignancy continuum. Samples are colored based on if they are from different disease stage. |
Top |
Malignant transformation related pathway analysis |
| Find out the enriched GO biological processes and KEGG pathways involved in transition from healthy to precancer to cancer |
| Tissue | Disease Stage | Enriched GO biological Processes |
| Colorectum | AD |  |
| Colorectum | SER |  |
| Colorectum | MSS |  |
| Colorectum | MSI-H |  |
| Colorectum | FAP |  |
| ∗Top 15 enriched GO BP terms are showed in the bar plot of each disease state in each tissue. Each row represents a significant GO biological process which is colored according to the -log10(p.adjust). |
| Page: 1 2 3 4 5 6 7 8 9 |
| GO ID | Tissue | Disease Stage | Description | Gene Ratio | Bg Ratio | pvalue | p.adjust | Count |
| GO:00316476 | Stomach | GC | regulation of protein stability | 40/1159 | 298/18723 | 3.23e-06 | 1.31e-04 | 40 |
| GO:19049516 | Stomach | GC | positive regulation of establishment of protein localization | 39/1159 | 319/18723 | 3.79e-05 | 9.76e-04 | 39 |
| GO:00512226 | Stomach | GC | positive regulation of protein transport | 36/1159 | 303/18723 | 1.33e-04 | 2.49e-03 | 36 |
| GO:00066056 | Stomach | GC | protein targeting | 34/1159 | 314/18723 | 1.09e-03 | 1.27e-02 | 34 |
| GO:003164751 | Stomach | SIM | regulation of protein stability | 30/708 | 298/18723 | 1.14e-06 | 6.23e-05 | 30 |
| GO:190495151 | Stomach | SIM | positive regulation of establishment of protein localization | 28/708 | 319/18723 | 3.35e-05 | 9.71e-04 | 28 |
| GO:000660551 | Stomach | SIM | protein targeting | 27/708 | 314/18723 | 6.56e-05 | 1.70e-03 | 27 |
| GO:005122251 | Stomach | SIM | positive regulation of protein transport | 25/708 | 303/18723 | 2.30e-04 | 4.61e-03 | 25 |
| GO:00108764 | Stomach | SIM | lipid localization | 30/708 | 448/18723 | 1.87e-03 | 2.08e-02 | 30 |
| GO:009015011 | Stomach | SIM | establishment of protein localization to membrane | 20/708 | 260/18723 | 2.18e-03 | 2.27e-02 | 20 |
| GO:00068693 | Stomach | SIM | lipid transport | 27/708 | 398/18723 | 2.58e-03 | 2.55e-02 | 27 |
| GO:190382931 | Stomach | SIM | positive regulation of cellular protein localization | 20/708 | 276/18723 | 4.29e-03 | 3.81e-02 | 20 |
| Page: 1 |
| Pathway ID | Tissue | Disease Stage | Description | Gene Ratio | Bg Ratio | pvalue | p.adjust | qvalue | Count |
| Page: 1 |
Top |
Cell-cell communication analysis |
| Identification of potential cell-cell interactions between two cell types and their ligand-receptor pairs for different disease states |
| Ligand | Receptor | LRpair | Pathway | Tissue | Disease Stage |
| Page: 1 |
Top |
Single-cell gene regulatory network inference analysis |
| Find out the significant the regulons (TFs) and the target genes of each regulon across cell types for different disease states |
| TF | Cell Type | Tissue | Disease Stage | Target Gene | RSS | Regulon Activity |
| ∗The dot plots of a searched regulon are shown for all cell subpopulations in each disease state of each tissue based on the regulon specific score inferred using pySCENIC and by calculating the average expression. |
| Page: 1 |
Top |
Somatic mutation of malignant transformation related genes |
| Annotation of somatic variants for genes involved in malignant transformation |
| Hugo Symbol | Variant Class | Variant Classification | dbSNP RS | HGVSc | HGVSp | HGVSp Short | SWISSPROT | BIOTYPE | SIFT | PolyPhen | Tumor Sample Barcode | Tissue | Histology | Sex | Age | Stage | Therapy Types | Drugs | Outcome |
| SLC51B | SNV | Missense_Mutation | rs766649904 | c.247N>A | p.Ala83Thr | p.A83T | Q86UW2 | protein_coding | tolerated(0.38) | benign(0.058) | TCGA-AN-A0XR-01 | Breast | breast invasive carcinoma | Female | <65 | III/IV | Unknown | Unknown | SD |
| SLC51B | SNV | Missense_Mutation | novel | c.170G>T | p.Arg57Ile | p.R57I | Q86UW2 | protein_coding | deleterious(0) | probably_damaging(0.917) | TCGA-E2-A1IU-01 | Breast | breast invasive carcinoma | Female | <65 | I/II | Hormone Therapy | arimidex | SD |
| SLC51B | SNV | Missense_Mutation | novel | c.240N>C | p.Leu80Phe | p.L80F | Q86UW2 | protein_coding | tolerated(0.15) | possibly_damaging(0.79) | TCGA-CA-6717-01 | Colorectum | colon adenocarcinoma | Male | <65 | I/II | Chemotherapy | oxaliplatin | CR |
| SLC51B | insertion | Frame_Shift_Ins | novel | c.340_341dupGA | p.Asp114GlufsTer30 | p.D114Efs*30 | Q86UW2 | protein_coding | TCGA-A6-A565-01 | Colorectum | colon adenocarcinoma | Female | <65 | III/IV | Unspecific | 5FU | PD | ||
| SLC51B | SNV | Missense_Mutation | novel | c.365N>G | p.Asp122Gly | p.D122G | Q86UW2 | protein_coding | tolerated(0.05) | benign(0.439) | TCGA-A5-A0G2-01 | Endometrium | uterine corpus endometrioid carcinoma | Female | <65 | III/IV | Unknown | Unknown | SD |
| SLC51B | SNV | Missense_Mutation | novel | c.241G>C | p.Asp81His | p.D81H | Q86UW2 | protein_coding | tolerated(0.12) | benign(0.35) | TCGA-AX-A2IO-01 | Endometrium | uterine corpus endometrioid carcinoma | Female | >=65 | I/II | Chemotherapy | carboplatin | SD |
| SLC51B | SNV | Missense_Mutation | c.134C>T | p.Ala45Val | p.A45V | Q86UW2 | protein_coding | tolerated(0.45) | benign(0.007) | TCGA-D1-A103-01 | Endometrium | uterine corpus endometrioid carcinoma | Female | >=65 | I/II | Unknown | Unknown | SD | |
| SLC51B | SNV | Missense_Mutation | novel | c.301N>A | p.Pro101Thr | p.P101T | Q86UW2 | protein_coding | tolerated(0.13) | possibly_damaging(0.571) | TCGA-55-6987-01 | Lung | lung adenocarcinoma | Male | >=65 | I/II | Unknown | Unknown | SD |
| Page: 1 |
Top |
Related drugs of malignant transformation related genes |
| Identification of chemicals and drugs interact with genes involved in malignant transfromation |
| (DGIdb 4.0) |
| Entrez ID | Symbol | Category | Interaction Types | Drug Claim Name | Drug Name | PMIDs |
| Page: 1 |

Copyright 2023-Present -The University of Texas Health Science Center at Houston |